Category Archives: Projects

Getting Up and Running with a 3D Printer

I recently received some money to purchase a 3D printer to aid my laboratory experiments. I thought that it would be good to share how I decided on the printer that I did and how hard/easy it was to setup. Currently I've only run a few simple test prints, but will be printing some mounting equipment for laboratory experiments within a few weeks.

2014-08-16 05.08.30

Choosing a Printer

When choosing a printer, there are many factors to consider. The consumer 3D printer movement is still very young, so there are many different designs available that require different amounts of tinkering to work and have vastly different capabilities. To help decide, I made a few requirements and decision points :

1. I must be able to print something that is at least 8"x8"x8". Print area is an important consideration and is one of the biggest influences on cost. With this print size I can make most prototypes, brackets, etc that we need. Larger parts can always be printed in sections and joined, but it's not the strongest or easiest thing to do.
2. Print material and method. There are printers that can print in many types of plastic and even in wood. Some printers fuse plastic in layers in an "addictive manufacturing" process. Others can fuse a liquid into a plastic with a process referred to as stereo lithography. Most consumer level machines with a large print area are the type that extrude plastic. There is a large matrix of advantages and disadvantages, but we will just leave it at this for now.
3. The final factor I considered is the development of the machine. Informally this is the "tinker factor." How much are you willing to modify and experiment with the machine to get increased versatility vs. how much do you want a machine that is a push button that just works? I've always been the tinkering type but there is a balance. Some more experimental and low cost machines are not as reliable as I would prefer, but something that is fully developed like the MakerBot line doesn't leave as much versatility. The other portion is the licensing of the software and hardware. I've always been a proponent of the free and open source movement. It's how we are going to advance science and technology. Companies like MakerBot are not fully open source and that just doesn't sit well as it prevents the community from fixing problems in a piece of equipment that was rather expensive.

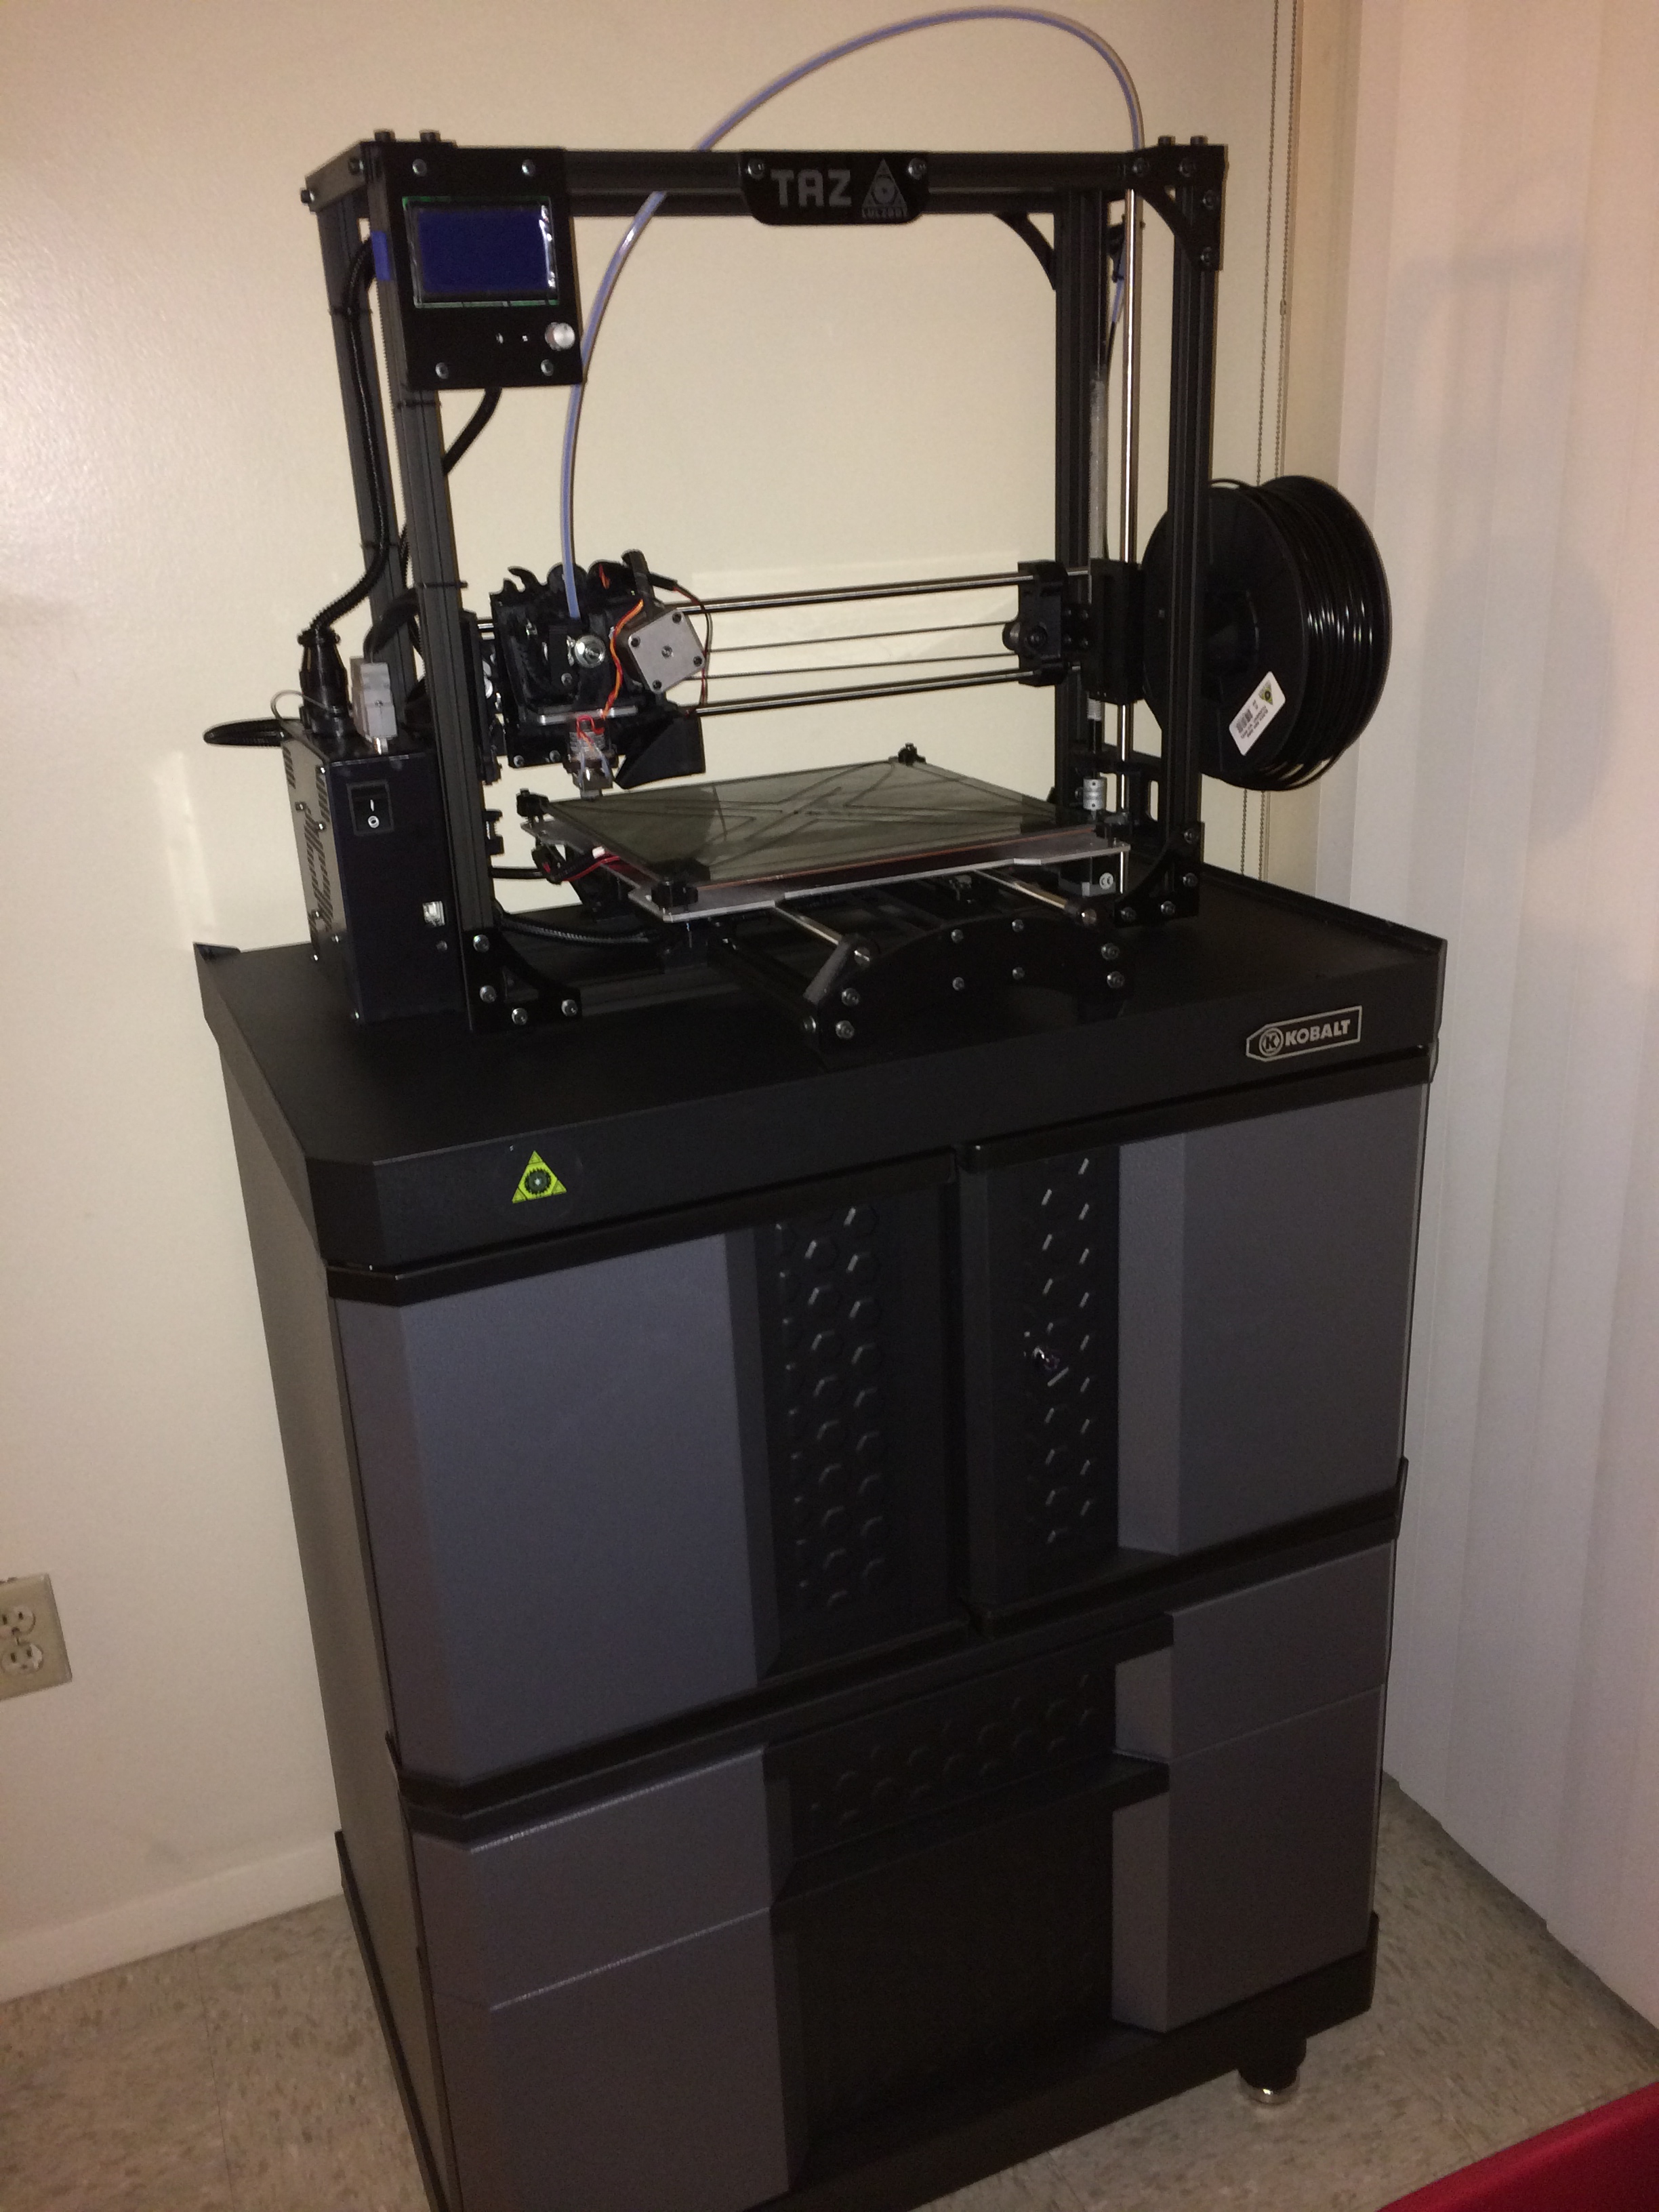
With all of those considerations and lots of research, I decided on the Taz 4 printer by Lulzbot. You can purchase the printer from Amazon, but I decided to purchase through Sparkfun Electronics since they are a small(ish) business that really supports education and the maker movement. I ordered the printer within a few hours of passing my comprehensive exams and it was on the way!

Setting up the printer

I received the printer and followed all of the setup instructions. This involved assembling the axes and removing the packing protection. I've never done this before, but overall it was very straightforward and took about 45 minutes. The next steps were what made me nervous.

To get quality prints the printer surface must be level with relation to the print head track. There are various end stops and leveling screws to adjust. Using a piece of printer paper as a gap gauge, I just followed the instructions and had the print bed leveled in about 20 minutes. There is also a test print pattern that prints two layers of plastic around the base plate to let you make sure the level is right on. Everything must be kept clean and adjusted as with any precision bit of gear, but overall I was impressed with the design.

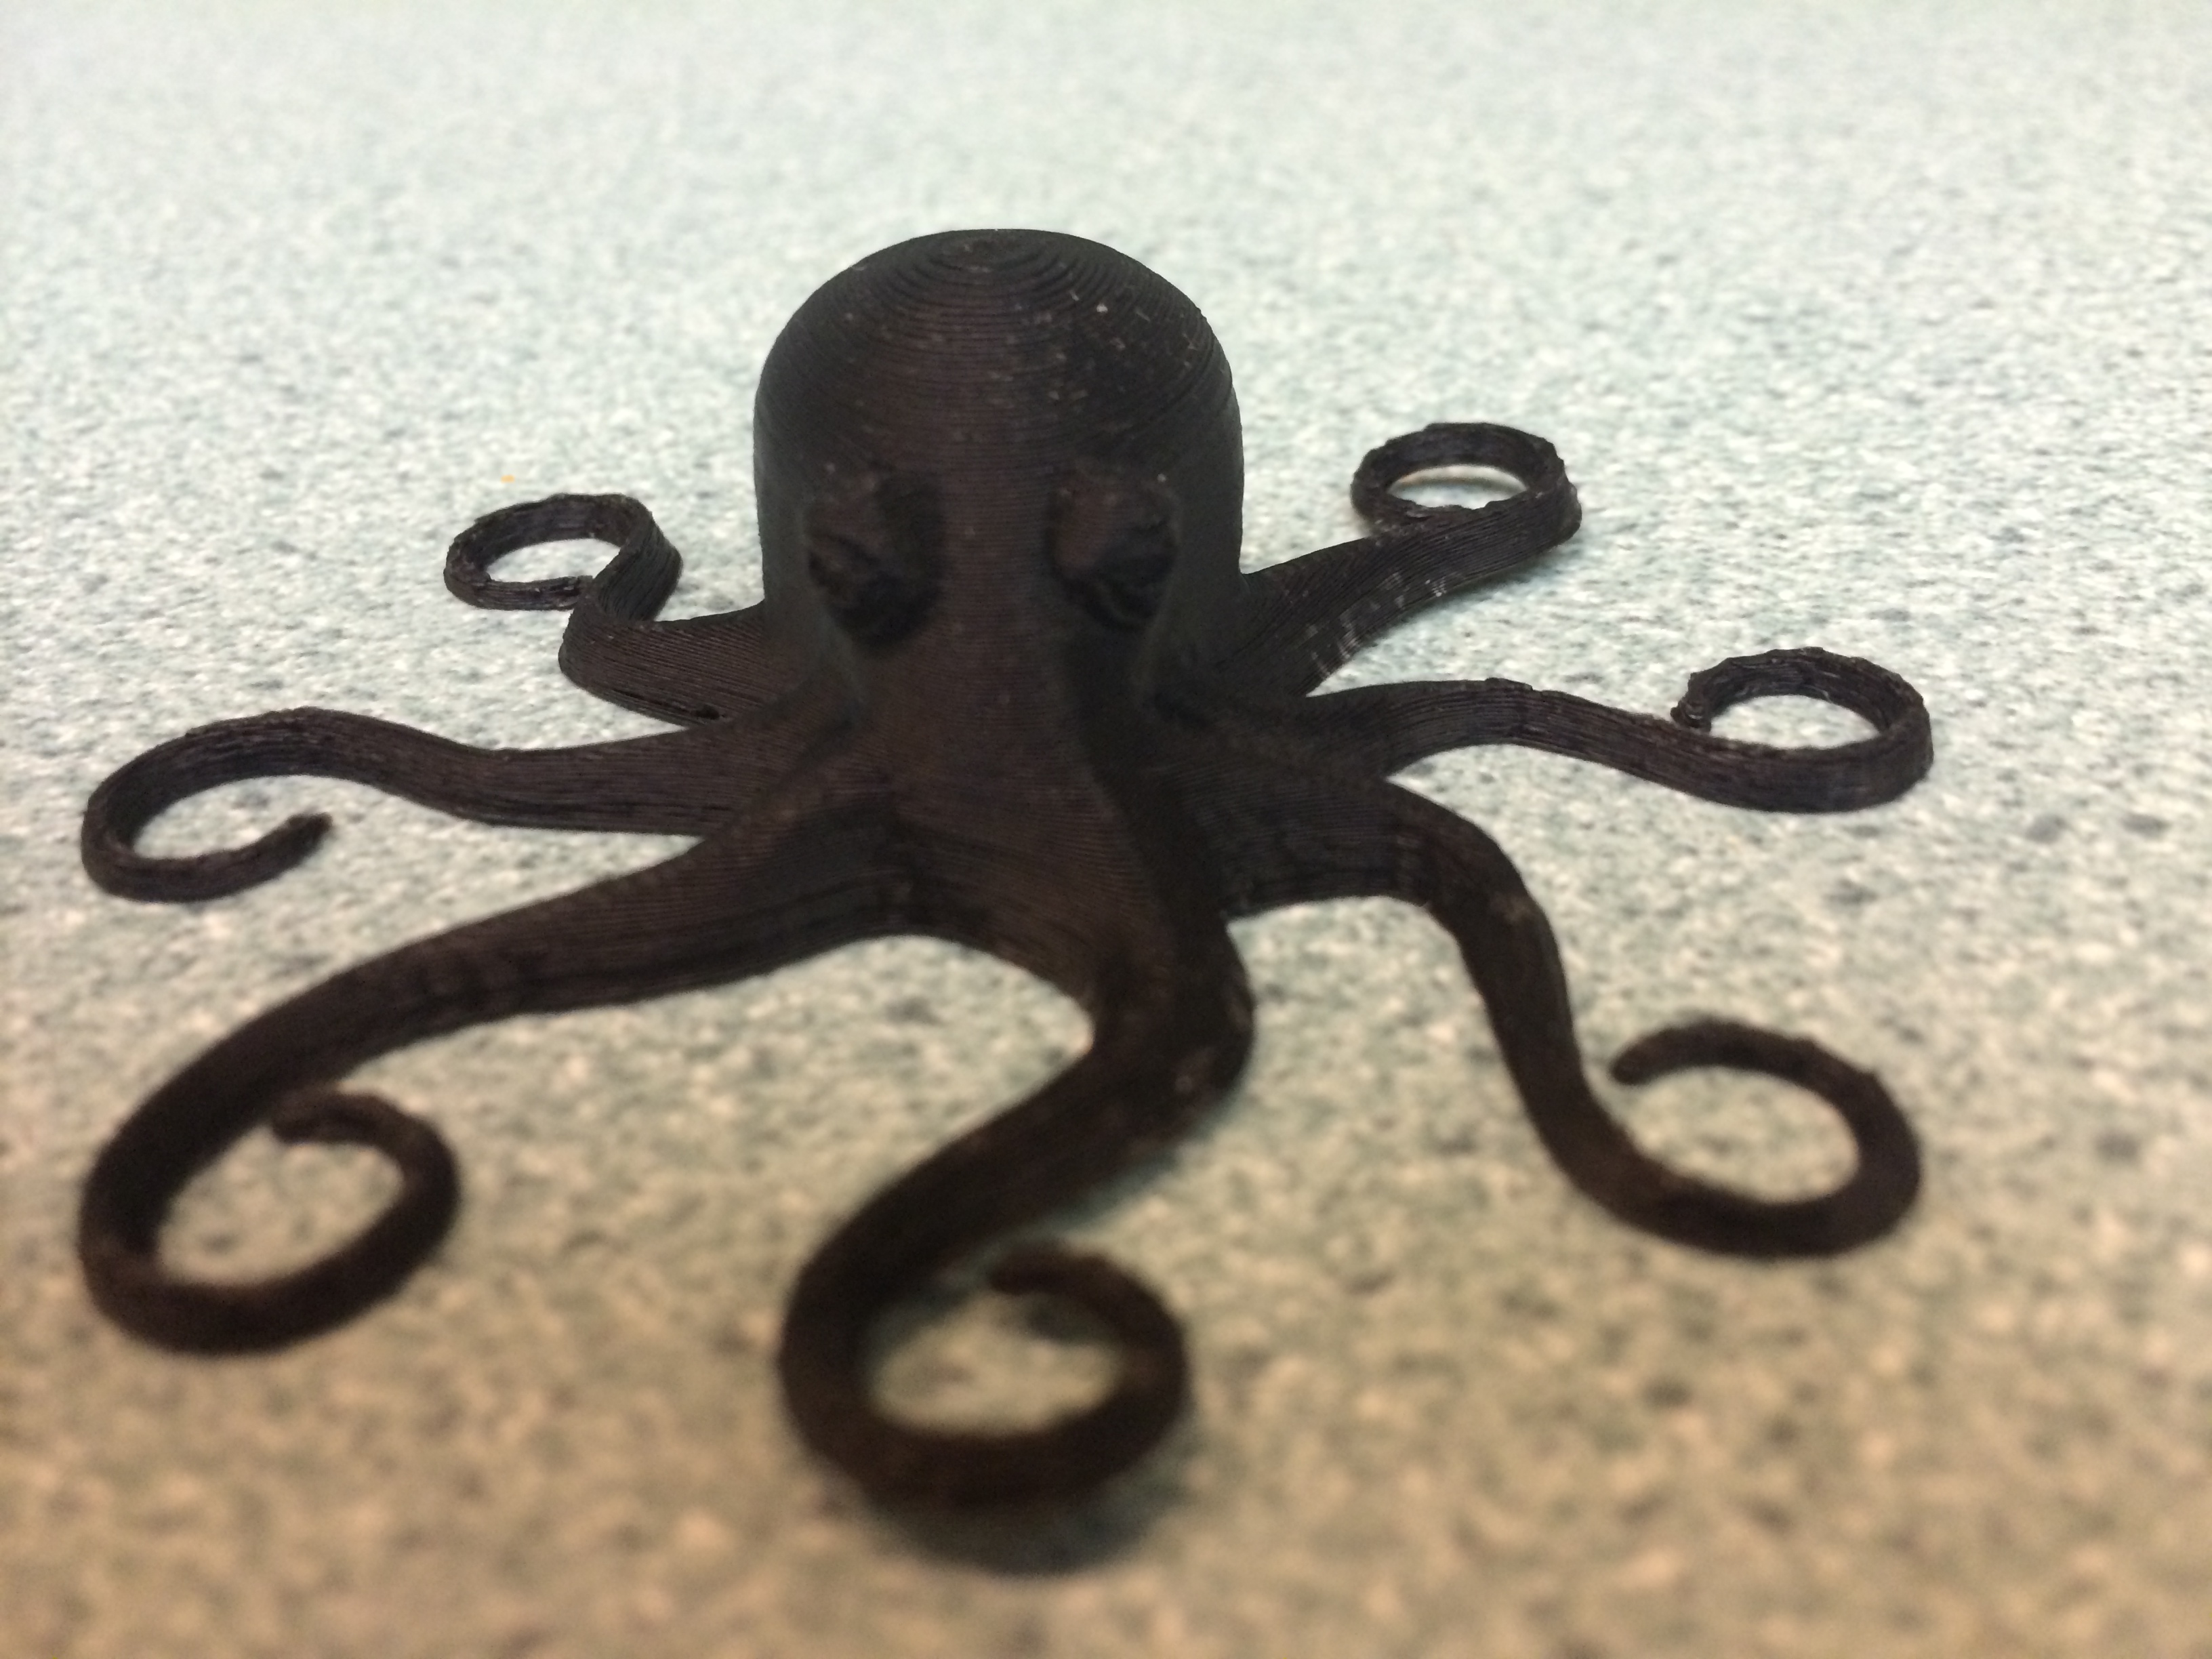
The printer ships with an octopus test print that was my first object. I loaded up the file and hit print. The printer ran for about an hour and at the end I had the print shown below!

2014-08-14 22.01.49

What's Next

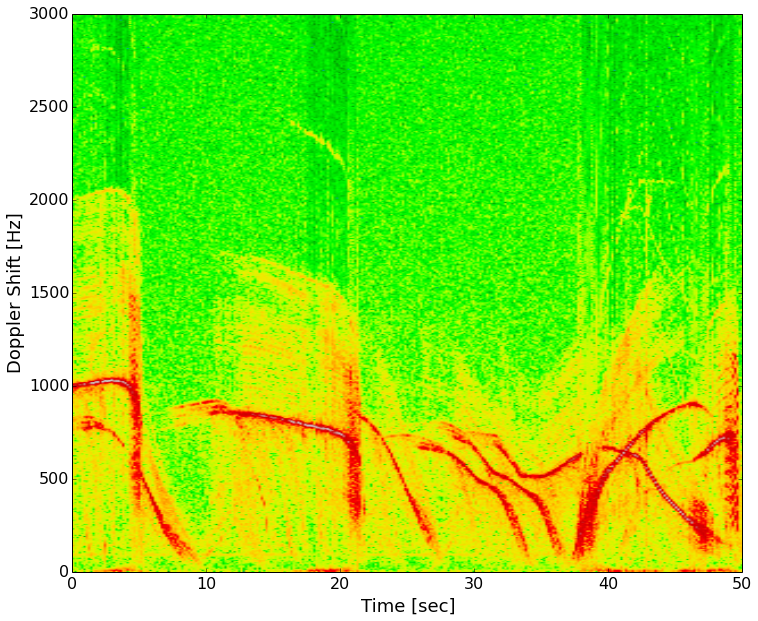
I've got some plans for what to print next. Currently I'm designing some new brackets to hold sensors in place during experiments and a few new parts like shields and pulleys to improve the quality of some of our demonstration apparatuses in the lab. I'm sure some of the results will end up as their own blog posts, but you can always see what's new by following me on Twitter (@geo_leeman). I also would like to thank Hess energy and Shell energy for their support of various aspects of these projects and of course the National Science Foundation for supporting me and many aspects of my lab research. Everything I've said is of course my own opinion and does not reflect the views of any of those funding organizations. Next post we will likely return to more general topics like seeing trends in data or go back and look at more Doppler radar experiments.

Update!

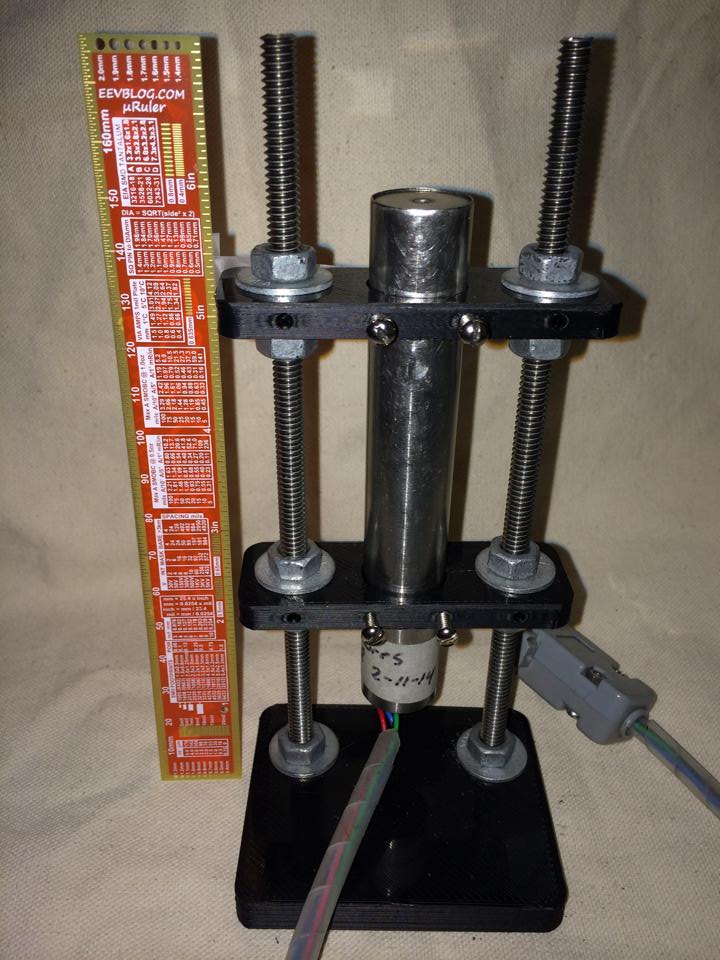
I was able to print my first laboratory parts, a set of brackets to make a magnetic holder for a displacement transducer.  I will be posting the cad files to my github account under an open license.

10347538_10152638131370731_7763062347780746327_n

Exploring Scientific Computing at SciPy 2014

Texas Campus

This past week I've been in Austin, TX attending SciPy 2014, the scientific Python conference.  I came in 2010 for the first time, but hadn't been able to make it back again until this year.  I love this conference because it gives me the chance to step away from work on my PhD and distractions of hobby projections to focus on keeping up with the world of scientific computing with Python.  I try to walk the fine line between being a researcher, engineer, and programmer everyday.  That means that it is easy to fall behind the state of the art in any one of those, and conferences like this are my way to getting a chance to learn from the best.

SciPy consists of tutorials, the conference, and sprints:

The first two days were tutorials in which I got to learn about using interactive widgets in iPython notebooks, reproducible science, image processing, and Bayesian analysis.  I see lots of things that I can apply in my research and teaching workflows!  Interactive notebooks are one of the last things that I was wishing for from the Mathematica notebooks.

The next three days were talks in which we got to see the newest software developments and creative applications of Python to scientific problems.  I, of course, gravitated to the geophysics oriented talks and even ran into some people with common connections.  It was during the conference that I gave my poster presentation.  I knew that the poster focused more on the application of Python to earthquake science than any earth-shaking (pun-intended) software development.  There were a few on the software side that wondered why I was there (as expected), but the poster was generally very well received.  Again I had several chance encounters with people from Google and other companies that had similar backgrounds or were just very interested in earthquakes!

The final two days (I'm writing this on the last day) were sprints.  These are large pushes to further develop the software while a critical mass of experts are in one location.  I'm still new enough to these massive open-source projections (on the development side at least) that I wasn't incredibly useful, but the reception of the developers was great!  Everyone was excited if you wanted to help and would spend as much time as needed to get you up and running.  During the sprints I've been following a fix for an issue that has recently caused problems in my plotting.  I also fixed a tiny issue (with help) and had my first pull request accepted.  For software people these are tiny steps, but for someone coming from just developing in-house purpose-designed tools.... it was an hit of the open-source collaboration drug.

Lastly, I worked on a project of my own during the evenings.  During the 2010 conference I worked with a friend to make a filter remove the annoying vuvuzela sound from the World Cup audio.  This year I've been making a fun earthquake visualization tool.  You'll be seeing it here on the blog, and may have already seen it if you follow me on twitter.  I learned a lot during this year's SciPy 2014, got to spend time with other alums of OU Meteorology, and meet some new folks.  Next on the blog we'll be back to some radar or maybe a quick earthquake discussion!

Doppler Radar at Home: Experiments with a CW Radar Part 1

When you hear "radar", you probably think of weather radar and a policeman writing a ticket.  In reality there are many kinds of radar used for everything from detecting when to open automatic doors at shops to imaging cracks in concrete foundations.  I've always found radar and radar data fascinating.  Some time back I saw Dr. Gregory Charvat modify an old police radar on YouTube and look at the resulting signal.  I happened to see that model of radar (a 1970's Kustom Electronics) go by on EBay and managed to buy it.  I'm going to present several experiments with the radar over a few posts.  If you want to learn more about radar and the different types of radar I highly recommend Dr. Charvat's book Small and Short-Range Radar Systems.  I haven't bought a personal copy yet, but did manage to read a few chapters of a borrowed copy.

The doppler radar I purchased.  I'm not using the head unit.

The doppler radar I purchased. I'm not using the head unit.

The radar I have outputs the doppler shift of a signal that is transmitted, reflected, and received.  Doppler is familiar to all of us as we hear the tone of a train horn or ambulance change as it rushes past us.  Since there is relative motion of the transmitter (horn) and receiver (your ears), there is a shift in received frequency.  Let's say that the source emits sound at a constant number of cycles per second (frequency).  Now let's suppose that the distance between you and the source begins to close quickly as you move towards each other.  The apparent frequency will go up because the source is closer to you each emitted cycle and you are closer to the source!

The doppler effect of a moving source.  Image: Wikipedia

The doppler effect of a moving source. Image: Wikipedia

This particular radar transmits a signal at a frequency of 10.25 GHz.  This outgoing signal is continually transmitted and reflected/scattered off of objects in the environment.  If the object isn't moving, the signal returns to the radar at 10.25 GHz.  If the object is moving, the signal experiences a doppler shift and the returned frequency is higher or lower than 10.25 GHz (depending on the direction of travel).  This particular radar can be easily hacked and we can record the doppler frequency out of a device called a mixer.  The way this unit is designed, we can't tell if the frequency went up or down, just how much it changed.  This means we don't know if the targets (cars) are coming or going, just how fast they are traveling.  Maybe in a future set of posts, we'll build a more complex radar system such as the MIT Cantenna Radar.  Be sure to comment if that's something you are interested in.

Since we'll be measuring speeds that are "slow" compared to the speed of light, we can ignore relativistic effects and calculate the speed of the object knowing the frequency change from the mixer, and the frequency of the radar.

Simplified doppler velocity.

I took the radar out to the street and recorded several minutes of traffic going by, including city busses.  Making a plot of the data with time increasing as you travel left to right and doppler frequency (speed) increasing bottom to top, we get what's known as a spectrogram.  Color represents the intensity of the signal at a given frequency at a certain point in time.

Speeds of several cars on my street.  1000 Hz is about 33 mph and 500 Hz is about 16 mph.

Speeds of several cars on my street. 1000 Hz is about 33 mph and 500 Hz is about 16 mph.

The red lines are strong reflectors (the cars).  Most of the vehicles slow down and turn on a side street in front of the radar.  About 30 seconds in there are three vehicles, two slow down and turn, the third again accelerates on past.  Next I'll be lining up a video of these cars passing the radar with the data and you'll be able to hear the doppler signal.  To do that I'm learning how to use a video processing package (OpenCV) with Python.

In the next few installments, we'll look at videos synced with these data, radar signatures of people running, how radar works when used from a moving car, and any other good targets that you suggest!

Drawdio: Creating Music with Your Hands

Awhile back I saw a post from the folks at the MIT Media Lab on a little creation they called the "drawdio" (here).  This looked like a fun little project! It's an oscillator based on the classic 555 timer integrated circuit, but with a twist.  The twist is that you can control the frequency of the oscillation (tone of the note played by a speaker) by varying the resistance between two contacts.  These contacts seem to commonly be a pencil lead and your body, but as the MIT website demonstrates, almost anything can be used.

Schematic: Make.com

Schematic: Make.com

I decided it was time to build one of these, so I headed over the MAKE to get the plans.  I already had most of the parts (or good substitutes) on hand.  The battery holder and enclosure would have to come later.  I built the circuit with simple point-to-point wiring on perforated board.  The speaker is a salvaged part from a fax machine!

Drawdio No Case


I plugged the power supply in a touched the signal wires together.  The speaker let out a shrill tone and we were in business.  The next challenge was figuring out a case a final setup for the device.  I wanted this to be durable since lots of people at work and home would be playing with it.  The solution ended up being hot glue and a plastic crayon case.  I drilled holes in the case above the speaker for sound and added a power switch.  The final touch was terminal posts for the sense wires that control the pitch.

To make the sensor I just wrapped bare wire around a pencil body for one contact and inserted a push pin into the lead at the top for a second contact.  The goal is to complete that circuit and change the resistance between the two contacts.  The easiest way is to draw a graphite track on paper and make the circuit through your hands.  See the demo video below.

This is an incredibly fun project and can be very educational to the beginning electronics hobbyist or a way to get school children interested in STEM fields.  What are you waiting for? Go build a drawdio! (Kits available from Adafruit)

Why a Standing Desk Didn't Work for Me

Standing Desk Leeman

I spend a lot of time at work... probably more than is really healthy for me.  In an effort to mitigate any harmful effects that working has on my health, I decided to try the standing desk idea.  We've all heard about how sitting all day is very detrimental to your health (example).  Recently our department has been renovating offices and giving people the option of a small motorized adjustable height desk.  I was very excited about his until I found out that my office was not going to be renovated.  I looked at the standing desks that professors had purchased, such as the Geek Desk, but realized that those commercials desks are out of the graduate student budget.  I also had never used a standing desk before.... what if it didn't work for me?

After reading lots of articles online, I decided to build something like a standing desk on-top of my existing desk.  Following the advice over at "Only a Model", I made the IKEA pilgrimage and bought the required parts (a coffee table, a shelf, and two brackets).  I got back, cleaned off my desk, assembled the parts, and had my very own standing desk!  It was slightly shaky under the weight of two 27" monitors, but overall useable.  I thought my health problems had been successfully avoided.

I noticed that my feet began to get sore, walking down the hall at the end of the day was painful.  Reading more, it appeared that I needed a foot pad.  I bought the best that I could find, in fact it cost more than all of my standing desk parts!  The mat was incredibly comfortable and thick enough that I could take my shoes off and dig my toes in.  It still didn't solve the problem though.  I continued standing for weeks, brought in a stool to sit a few hours a day, but no gain.  Standing felt great, but not for 10-12 hours a day.

I noticed that doing tasks such as filling out paperwork that required focus, but not creativity were helped.  I wanted to get it done! Tasks like writing and coding suffered.  Not being able to lean back and think of the right words or the correct function call slowed me down.  Reading and absorbing papers was also difficult.  At the end of the day, it just wasn't working (another example).

Maybe if I only worked 8 hours a day, 5 days a week, things would have gone differently.  An adjustable height desk may have helped as well, but I doubt that I would take the time to change configurations more than once a day.  I ended up back at my sitting configuration with a new coffee table at home.

There are other options out there.  Several people in the department have recently purchased a FitDesk. These cycle desks look good for computer tasks, but are not intended to replace a full desk with their small surface area.  Probably the best option is to have multiple work spaces.  One standing position, one sitting position, and possibly something else as well.  That's possible if you have a larger office/cube, but a small office with 6 graduate students just doesn't have the room.

So what do I do? I've been trying to be better about getting up every hour or so and taking a short walk/refocusing my eyes at a long distance.  Maybe something like a foot roller would help as well.  What is your workspace setup like? Remember to make sure it is ergonomic!

Liquid Cooled Laptop Stand

This is going to be a short post that was requested during the LifeHacker "How I Work" feature.  In the post (here) I had mentioned my custom laptop stand that has an automotive transmission cooler and there was some interest in its construction.  Since moving I haven't hooked everything (fluid and such) up, so I did make any thermal profiles of the stand, but maybe at some point I'll attach some thermocouples and so just that.  Regardless, here are a few photos and some construction notes.

First off I should state the purpose and design requirements of the stand.  I wanted a stand to that the laptop monitor would line up nicely with my second monitor and wasn't made of books.  At the time I was running lots of rather intensive thermal models and gridding some large data sets, so that my laptop would be running very hot with the fans full blast for anywhere from 5-20 hours straight.  To keep it running a bit cooler I decided to build the stand of something thermally conductive, Aluminium was a good choice since that's what the laptop case is made of and it looks nice.  It's also not bad at conducting heat!
The stand was designed to hold the laptop screen at the same level as my second monitor and give a nice angle of viewing.

I bought some Al sheet a Lowe's, as well as a small strap of metal, and some "L" shaped material.  The channel makes the supports for the sheet and the runners on the desk.  I left them long incase I decide to mount the fluid tank and pump back there.  So far I haven't found a setup that is quiet and that fits in the space.  I will try again soon, but I've played with pumps and small aquarium tanks in the past.  

Using a sheet metal shear and brake I cut and bent the top plate to hold my laptop.  Be sure that the rubber feet on the bottom of the computer are off the stand, we want metal-metal contact for the best heat transfer!
So there were no screw heads to scratch my laptop, I used adhesive to mount the top plate to the frame.  The frame was assembled with nuts and bolts, then set on plastic feet to prevent scratches to the glass desktop.  
Next I made the stand match the computer a bit better by giving it a brushed Al finish instead of shiny metal.  A wire polishing wheel attached to the drill gave a nice, but time consuming finish to the entire stand.  
To further the cooling I wanted to mount a heat-sink to the bottom of the stand.  It so happened that I found a great solution at the automotive store that would allow for liquid cooling! A small generic automotive transmission cooler add-on kit (about $25 at the time) provides lots of surface area and a nice look.  The cooler is mounted with JB-weld and seems to get nice and warm when I'm working the laptop.  I'll probably inject some thermal grease to increase the coupling even more.

The transmission cooler on the bottom of the stand.

The surface where the computer sits.  
  This was a really fun little afternoon project and its not done yet! Eventually I'll run onto a tank/pump combo that I like and will fit onto the stand.  I'll mount it and use some colored water to give a nice effect when I'm cooling.  The easiest control mechanism is a small temperature sensor that turns the pump on and off as necessary to maintain a set-point.  When that happens, I'll be sure to post and update.  
To William (the commenter that requested some details of my stand): Sorry this took so long! The LifeHacker article went live not long before I took my candidacy exam! 
As always feel free to comment/email questions!

The Infrasound Bucket - Part 1 - Hardware

I'd like to write a short series of posts describing my setup of the infrasound unit I've written about before.  This is the same unit we used to look at traveling acoustic energy from the Russian meteorite and will soon use to examine earthquakes! Placing the unit inside my office or even inside the apartment proved to be very noisy as I saw every time someone opened or closed a door!  The makers (Infiltec) suggested that I put it outside, maybe in a drink cooler to shield it from the weather.  I did exactly that (photos below), but the cooler turned out to not be water proof and had about 2 cm water standing in the bottom when I checked it after a small storm.  The data quality while the instrument was outside was amazing though, with seismic signals coming through very clearly.  It was time to design a new system that would: 1) Be safe to leave outside in the weather, 2) Not have thick data cables running inside to a computer, 3) Would not require an inside computer, and 4) Would automatically post the current data online.

For the first post we're going to talk about the casing setup and mounting of all the vital hardware.  One weekend we decided to go wandering about Home Depot to find a suitable shell for the instrument as well as pickup a few other essential supplies.  Lendi had the flash of inspiration that we should use a 5-gallon plastic bucket... the ones at the Home Depot "Homer's All Purpose Bucket" even have an O-ring seal on the lid.  Perfect.

A built in O-ring seal on the bucket.

Now to figure out how to hold the hardware up off the bottom of the bucket.  In an ideal world this isn't needed, but in reality water may get in and I don't want it covering electronics thrown in the bottom of the bucket.  We used 1/4" plywood cut to a keystone shape that just fits the vertical profile of the bucket.  Adding two "L" brackets from the shelving section meant for ~$15 we had the shell and left over plywood.
Test fitting the plywood into the bucket.  Notice the cooler in the background that formerly housed the instrument.

I bolted the infrasound unit to the wood by using "plumber's tape" or metal strap with holes down its length.  This isn't the most elegant solution, but it meant no drilling the infrasound case which is semi-sealed on its own.  It is also very easy to get the unit out for any maintenance.   My RaspberryPi ended up having problems on the circuit board, so I've bolted a Beagle Bone Black to the board as well.

Front of the mounting board.  Infrasound unit (right), Beagle Bone (left), and power plugs (top left).

Rear of the mounting board with power passthrough.  

With no tall standoffs handy I made use of locking nuts, washers, and other assorted 4-40 hardware.

Two holes were drilled in the side of the bucket: one for the power and one for the air tube to the infrasound instrument.  I passed the power cable through (outdoor zip cord) through as well as clear plastic tubing and sealed it with bathroom silicon sealant.  I'd recommend sealing on the inside and outside of the bucket bulkhead.  Make sure to leave extra cable and tube for drip loops. A drip loop like structure was fashioned on the outside of the bucket to ensure no rain would blow up the tube into the unit.  We taped the tube down and then ran beads of silicon to secure it to the bucket.  After the sealant dried we moved the tape and secured the rest of the tubing.

Power and air tube sealed into the bucket and loops to prevent water flow.

Inside the bucket: notice the power plug.

In later posts we'll talk about how the power is actually provided and such, but the part that pertains to the hardware is the mounting of two binding posts on the plywood at the standard 3/4" spacing.  This allows us to power the board from a banana jack on the bench for testing or operationally in the bucket.  I drilled a passthrough hole to send power from the back of the jacks to the front of the panel.

Initially I built a 5V regulator to power the computer with from an LM7805 linear voltage regulator, but this was indeed a poor choice.  Even with a decent heat sink, the chip still got blistering hot when I was drawing 700mA (of the 1000mA rated power).  Considering this would be outside in the summer heat and the fact that I didn't want the failure point of a mechanical fan I decided to use a buck voltage converter.  Linear regulators dissipate all extra power as heat.  For example: I was feeding 12VDC to the converter with a 700mA load running at 5VDC.  That means that (12V-5V)*0.7 = 4.9 Watts of power was being turned into waste heat! No wonder, remember we think of watts as energy/time (Joules/second actually).  That's a lot of wasted electricity and really just a complication to our design, but it was very clean power.

The old linear regulator.  It's now awaiting a new use in the parts bin.

The buck converter is a switching type regulator.  I don't want to get into how switching regulators work current, but it's an interesting topic and you should have a read on the theory if you like.  I bought a small unit (P/N 1385) from Adafruit that is rated to 3A (though it gets warm there).  The power isn't quite as clean from this switching supply, but it's fine for out use here.  It works great with the Beagle Bone and provides lots of extra power for 5V accessories.  Don't want to order and ship from Adafruit? You can get the exact same thing from a model shop.  They are called "battery eliminator circuits" and allow modelers to plug their airplane, car, etc servo electronics (5VDC operation) into a 12V battery they already have in their kit.  Just clip the 3 pin servo plug off the end and you are ready to go.  Don't forget good soldering practice and to use heatshrink tube! Shorts could spark a fire, which we don't want.

The "battery eliminator circuit" or my 5V buck converter to supply 5VDC to the Beagle Bone.

So there it is! Next time I'm going to talk about setting up the power and network infrastructure.  Maybe even the serial communications! We're going to try to avoid using a serial-USB converter since the Bagle Bone has only one USB port (that I'm using for a WiFi adapter), I don't want to use a hub, and it's a chance to learn about signal level shifting and wire into that temping header on the board.

Everything fit into the bucket nicely and powers up from the bench power supply.

Chelyabinsk Meteorite - Infrasound, Seismic, and Satellites oh my!

Just as Earth was about to have a close encounter with asteroid 2012 DA14, the people of Chelyabinsk, Russia had a personal experience.  Before we talk about both 2012 DA14 and the Chelyabinsk event some terminology needs to be set out.  A meteoroid is a small chunk of debris in space, generally anything from a fleck of dust to a small boulder.  A larger space bit of debris is termed an asteroid.  A meteor is when some of this debris enters our atmosphere, heating up due to friction.  A meteor is called a meteorite if it actually reaches the surface of the Earth and survives impact.  Everyday we are pelted with many tiny meteors, but few reach the surface.  Most meteorites are never discovered as they are statistically much more likely to land in the ocean due to it's coverage of Earth's surface.  Sometimes meteorites are found on land, in fact it is common for scientists to go to Antarctica to look for the dark rocks on the surface of a white sheet of ice.  There are many pages on hunting meteorites  and a book as well, it's worth reading about if your curious how we find rocks that landed a long time ago.

It's worth saying that there are different kinds of space debris, some more stony, some made of almost solid metal, and some of ice.  While it's worth discussing, I'd rather focus on the current events in this post, so if you are curious there is a nice page at geology.com that gives the basics.

To begin, lets talk about 2012 DA14, or the non-intuitive name that we gave a near Earth asteroid that is about 160 feet in diameter and weighs a massive 190,000 metric tons.  This asteroid could do some serious damage and was scheduled to have a close call with Earth on February 15th.  How close? Well, it would be about 17,200 miles from the surface, which seems like a long way.  It's not.  The moon is 250,000 miles away (roughly) and we've been there and back in a matter of a few days.  In fact, the geosynchronous satellites that beam TV and weather data down to Earth orbit about 22,236 miles above the surface to rotate at the same rate the Earth does.  As shown in the figure below, 2012 DA14 passed between us and the geostationary satellite band; a very close call.

Why talk about 2012 DA14 in a post about a meteor over Russia? To say they are not related in any way.  They approached from entirely different directions and it just happened to be a coincidence of space and time.

Now for the event in Russia.  At 3:20:26 UTC on Feburary 15th a large meteor about the size of a schoolbus entered the atmosphere.  The 49-55 foot estimated diameter object probably weighed about 7000-10000 tons.  While heating up upon atmospheric entry the meteor "detonated" or exploded in mid-air.  This has happened before, a list of historic airbursts can be found here.  The most famous being a large explosion (also over Russia) in 1908 called the Tunguska event.  That explosion released the energy of 10-15 million tons of TNT, leveling forests and destroying an area of about 830 square miles.  The event that just occurred was about 500 kilotons of TNT equivalent, or roughly 20 times smaller.  Shock waves from the event still managed to send around 1500 people to local hospitals with shards of glass and building materials in their faces/skin from rushing to a window too see what was happening.  Videos of the entry are all over the web, in several you can hear the detonation and shock wave.

So how do we know so much about this object considering we didn't know anything about it until it exploded overhead? Well, remote sensing helps us.  When a meteor entered over Wisconsin in 2010, I wrote about following the trail on the US Doppler Radar Network (here).  This time we could see the meteor from weather satellites (Meteosat 10 image below) as well as on seismic and infrasound stations.  Another meteosat also captured several frames that have been made into a video here.  Current estimates of the entry speed are in the area of 40,000 mph with a very shallow entry angle.

First the seismic observations.  So far I've seen reports of the Borovoye, Kazakhstan station seeing a gorgeous signal (thanks to Luke Zoet on this one). The station details, and even a photo are available at the USGS network operations page.  Below is a filtered (0.15 Hz low-pass) seismogram from BRVK.  This would be a result of the shock wave rattling the ground and seismic station.

Next, and rather interesting, are the infrasound observations.  Infrasound is very low frequency sound (below 20Hz) that we can't hear, but can record as air pressure variations.  It so happens that Steve Piltz of the Tulsa National Weather Service has a microbarograph.  Upon seeing his data from an earlier earthquake (yes, ground movement causes air pressure waves), I immediately bought a unit from Infiltec and set it up in the office at Penn State.  Below is a picture of the station.

Infrasound propagation is incredibly complex and difficult to predict over such long distances, so I've done a simple calculation that is very likely going to be revised upon some discussions with seismologists this week.  First, I wanted to know how long the sound would have to travel.  To find the shortest travel distance between a latitude and longitude set you can assume a spherical Earth (not too bad for such a back of the envelope calculation) and some math.  Remember trigonometry? Well when it's modified to work on a sphere instead of in a plane it's creatively called 'spherical trigonometry' and consists of a strange function called the haversin.  If you are curious about how I calculated the travel path of the sound waves checkout the wikipedia page on the Haversine formula, but I've included the formula below.  Below is the result of the calculation, a great circle path between Chelyabinsk and State College, PA.
d = 2 r \arcsin\left(\sqrt{\operatorname{haversin}(\phi_2 - \phi_1) + \cos(\phi_1) \cos(\phi_2)\operatorname{haversin}(\lambda_2-\lambda_1)}\right)

The distance the wave would travel would be something like 8670 kilometers.  Sound travels at 340.29 m/s at sea level, but since we're making assumptions we'll say 300 m/s is a nice number.  So the wave would take somewhere in the 7-8 hour range to reach State College (assuming it's non-dispersive and many other likely not so great assumptions).  Luckily for us, the event and the arrivals are overnight.  During the day my infrasound station is swamped by signals from office doors opening and closing amongst other things.  The meteor entered the atmosphere at 10:20 pm local time, so I've plotted the infrasound from 10 minutes before the meteor entered to well after the energy should arrive.  There is a large increase in the noise shortly after entry, but this is too soon.  Could it be seismic energy or arrival of a faster shock path? Maybe, that's a point for some discussion and revision later.  The big thing to notice is the noise increase at about 7-8 hours after the entry.  It's still early in the morning, so it is doubtful that this is people coming into work.

I've made a .SAC (seismic analysis code) file of the raw data for about 24 hours around the event available to download here.  Download the file (~19Mb) and play with it! The data is collected at 50Hz, but all that is in the meta-data (as well as location details).  I use ObsPy to do most of my analysis in Python, but you could use SAC or other codes meant for seismic event analysis.

Steve's station in Oklahoma recorded similar signatures.  His data over a slightly shorter time span (5:21-11:42 UTC) is below, showing similar signatures.

Infrasound is actually what allows us to determine the energy release from the explosion.  As it turns out seismic stations and infrasound have been used to monitor nuclear testing for years (a relevant topic currently considering the recent tests by North Korea).

Overall, I'd say stay tuned for any updates.  Eventually the infrasound station I have will be setup for live streaming.  I'm sure after discussion with some folks more versed in infrasound travel we can clean up the data and maybe do some more back of the envelope energy/rate calculations for demonstation purposes.

Fluxgate Magnetometer Wrap-Up (For now)

Per lots of emails and requests I’m going to post what I have from the design of the fluxgate magnetometer mentioned in several previous posts (like this one).  The schematic attached at the bottom is a rough draft, but should provide some guidelines for designing and building a version of this instrument.  I’ve also attached links to several PDFs that I found very helpful when building this demo.

It should be noted that this design doesn’t have a plain readout with XXXXXX nT magnetic field, but displays a waveform on the oscilloscope.  Could one be made? Absolutely! Since this was more of a demonstration of the underlying physics I didn’t bother, but it would be a good weekend project.

First off let me list a few things I would build differently were I building this again:

-       Use shielded lead wires to reduce crosstalk to the coil.

-       Use a simple Analog-to-Digital converter so this output is projected from a laptop to the classroom screen (much easier than gathering students around an oscilloscope).  I think an Arduino might do the trick.  Raspberry Pi would be a good choice too.

-       Add gain adjustment knobs to the control panel.

-       I would again use the Velleman kit for the signal generator instead of re-designing the wheel.

When using this in the classroom I laid it alongside commercial magnetometers on the table.  We discussed the physical principles behind the instrument, and then students would use the demo fluxgate to generate an output wave.  Afterwards we used the commercial magnetometers to do simple tasks like finding conduits and keys. 

It would also be nice to have a first-principles proton-precession magnetometer.  There is a book “Signals from the Subatomic World: How to Build a Proton PrecessionMagnetometer” that describes one such instrument, but significant improvements in the instrument could be made with modern programming languages and ADC devices. 

I still welcome questions on the fluxgate and will probably update the instrument next time I teach an Intro Geophysics course (undetermined).  Thank you for all the interest and if you build one, please send your results and we’ll put them up here for all to benefit.  

Laser Cave Profiling - The Beginning

Inspired by caving friend Nathan Williams photos of this technique I decided to try to duplicate his results and then write some great software.  The idea is to make profiles of cave tunnels known as cross sections very easily and accurately.  Cross sections are commonly sketched by a cave mapper by eye with a very rough scale.  Sometimes the passage is measured in height and width with a tape.

Here we use a motorized laser level and a DSLR camera to try to construct profiles.  After seeing Nathan's photos I got the laser level from Harbor Freight Tools (~$60) and used my Nikon D40X in a local Arkansas cave.

Today I just did a quick test about 100 ft. into the passage.  Below is a picture looking toward the level with flash so the tunnel profile can be seen.  Then I did a 20 second exposure with the level running and all lights off.  There was a small amount of light from the entrance, but negligible.

I then read the image into python, remove tripod reflections by subtracting the average of the blue and green channels from the red and then inverting the resulting monochrome image.  The result is seen below:

The big thing I need is the software to then produce a set of points that describe the profile so I can implement routines to compute area and make a pseudo 3-D model of the cave by stacking many closely spaced profiles.  I also tested the scale of the image by counting how many pixels wide the level appears and then determined the pixels/cm count to get the size of the tunnel.  This process will be improved and automated as the software develops.

I'm open to suggestions from cavers and numerical methods folks.  I have a contouring algorithm (Moore-Neighbor Tracing) coded, but it doesn't handle the breaks in the profile.  Any ideas on making it continuous and possibly minor smoothing? I plan to build a "T" shape device with 4 dim LEDs to provide a larger scale target.