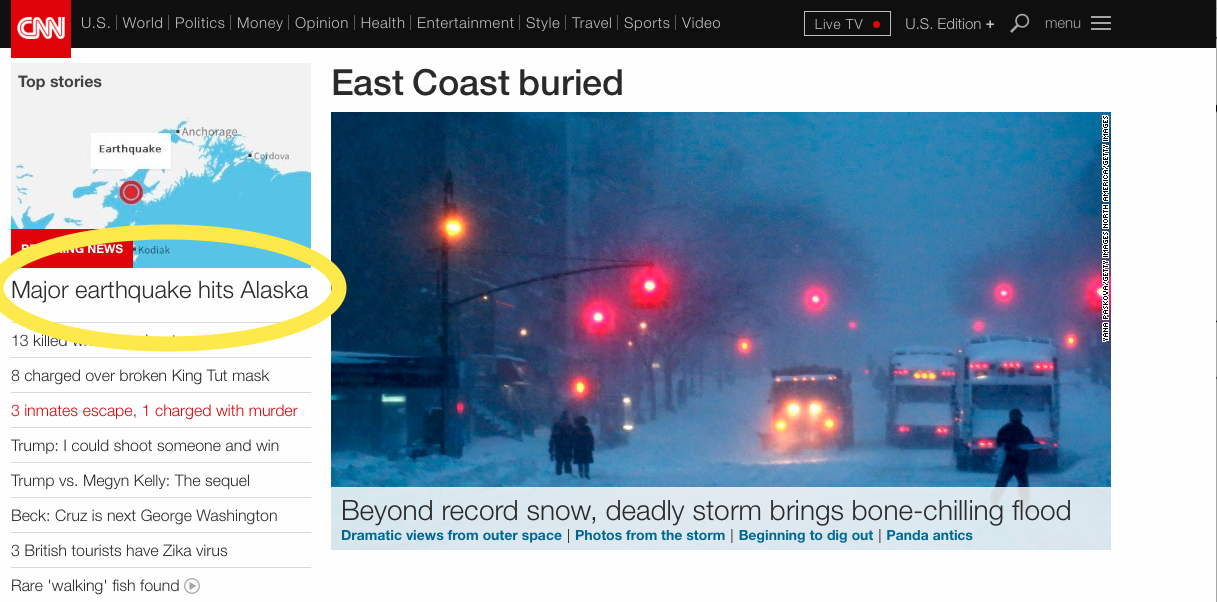
This morning there was a magnitude 7.1 earthquake beneath Alaska. Alaska is no stranger to earthquakes, and I'm not going to talk about the tectonics, but I wanted to share the ground motion videos I produced for the event. Also be sure to checkout the ground motion videos over at IRIS as well. At present no major damage or injury was reported. Though CNN did sensationalize the earthquake (as they always do):
First a video from a nearby station, Homer, AK. About 8 mm maximum ground displacement with some pretty large ground accelerations.
The earthquake recorded in Australia. Not as exciting, but notice the packets of waves towards the end of the video, these are the surface waves that took the longer route around the globe compared to their earlier counter parts. (Called R1/R2 and G1/G2.)
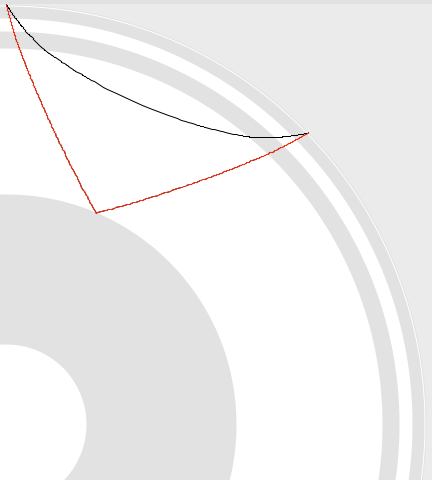
Here's a central US station near where I grew up. Nice surface waves and a good example of what looks like the PcP phase (P-wave reflected off the outer core of the planet.) The PcP phase is at about 604 seconds, around 100 seconds after the P wave. In the figure below the movie, the approximate PcP path is red, the P path is black. Pretty neat!
As frequent readers of the blog or listeners of the podcast will know, I really like doing outreach activities. It's one thing to do meaningful science, but another entirely to be able to share that science with the people that paid for it (taxpayers generally) and show them why what we do matters. Outreach is also a great way to get young people interested in STEAM (Science, Technology, Engineering, Art, Math). When anyone you are talking to, adult or child, gets a concept that they never understood before, the lightbulb going on is obvious and very rewarding.
Our lab group recently participated in two outreach events. I've shared about the demonstrations we commonly use before when talking about a local science fair. There are a few that probably deserve their own videos or posts, but I wanted to share one in particular that I improved upon greatly this year: Squeezing Rocks.
Awhile back I shared a video that explained how rocks are like springs. The normal demonstration we used was a granite block with strain gauges on it and a strip chart recorder... yes... with paper and pen. I thought showing lab visitors such an old piece of technology was a bit ironic after they had just heard about our lab being one of the most advanced in the world. Indeed when I started the paper feed, a few parents would chuckle at recognizing the equipment from decades ago. For the video I made an on-screen chart recorder with an Arduino. That was better, but I felt there had to be a better way yet. Young children didn't really understand graphs or time series yet. Other than making the line wiggle, they didn't really get the idea that it represented the rock deforming as they stepped on it or squeezed it.
I decided to go semi old-school with a giant analog meter to show how much the rock was deformed. I wanted to avoid a lot of analog electronics as they always get finicky to setup, so I elected to go with the solution on a chip route with a micro-controller and the HX711 load cell amplifier/digitizer. For the giant meter, I didn't think building an actual meter movement was very practical, but a servo and plexiglass setup should work.
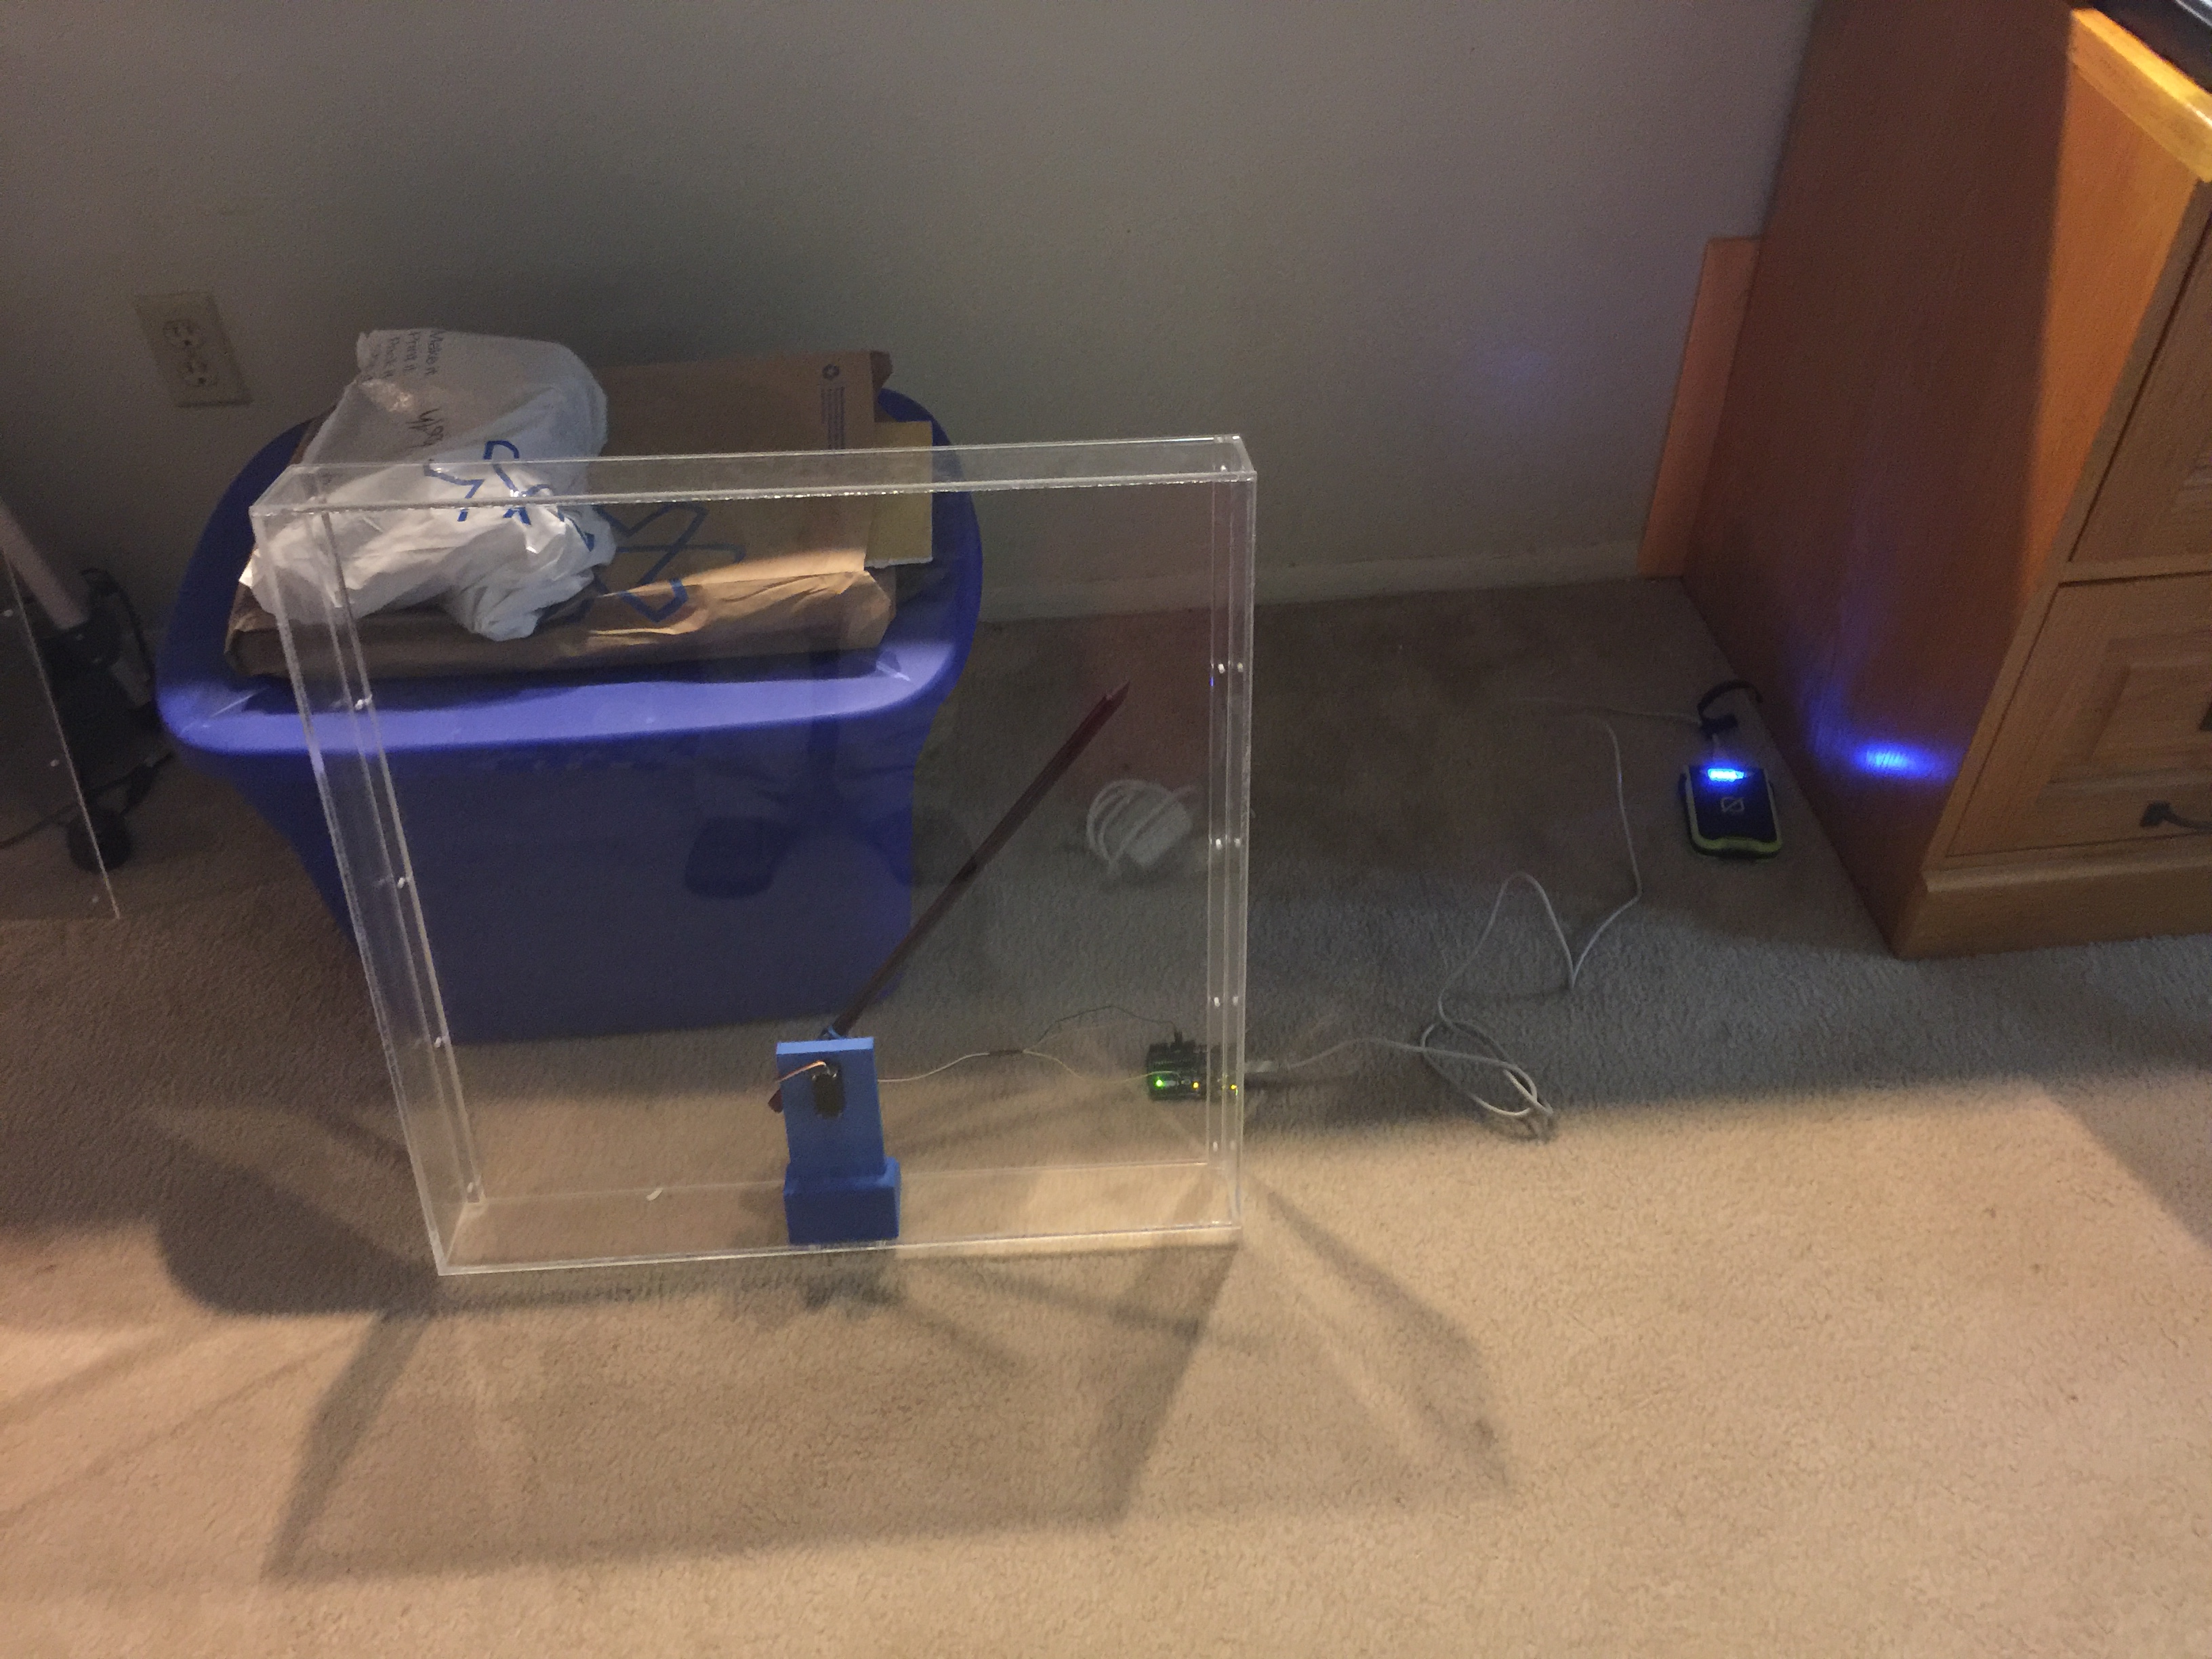
A very early test of the meters shows it's 3D printed servo holder inside and the electronics trailing behind.
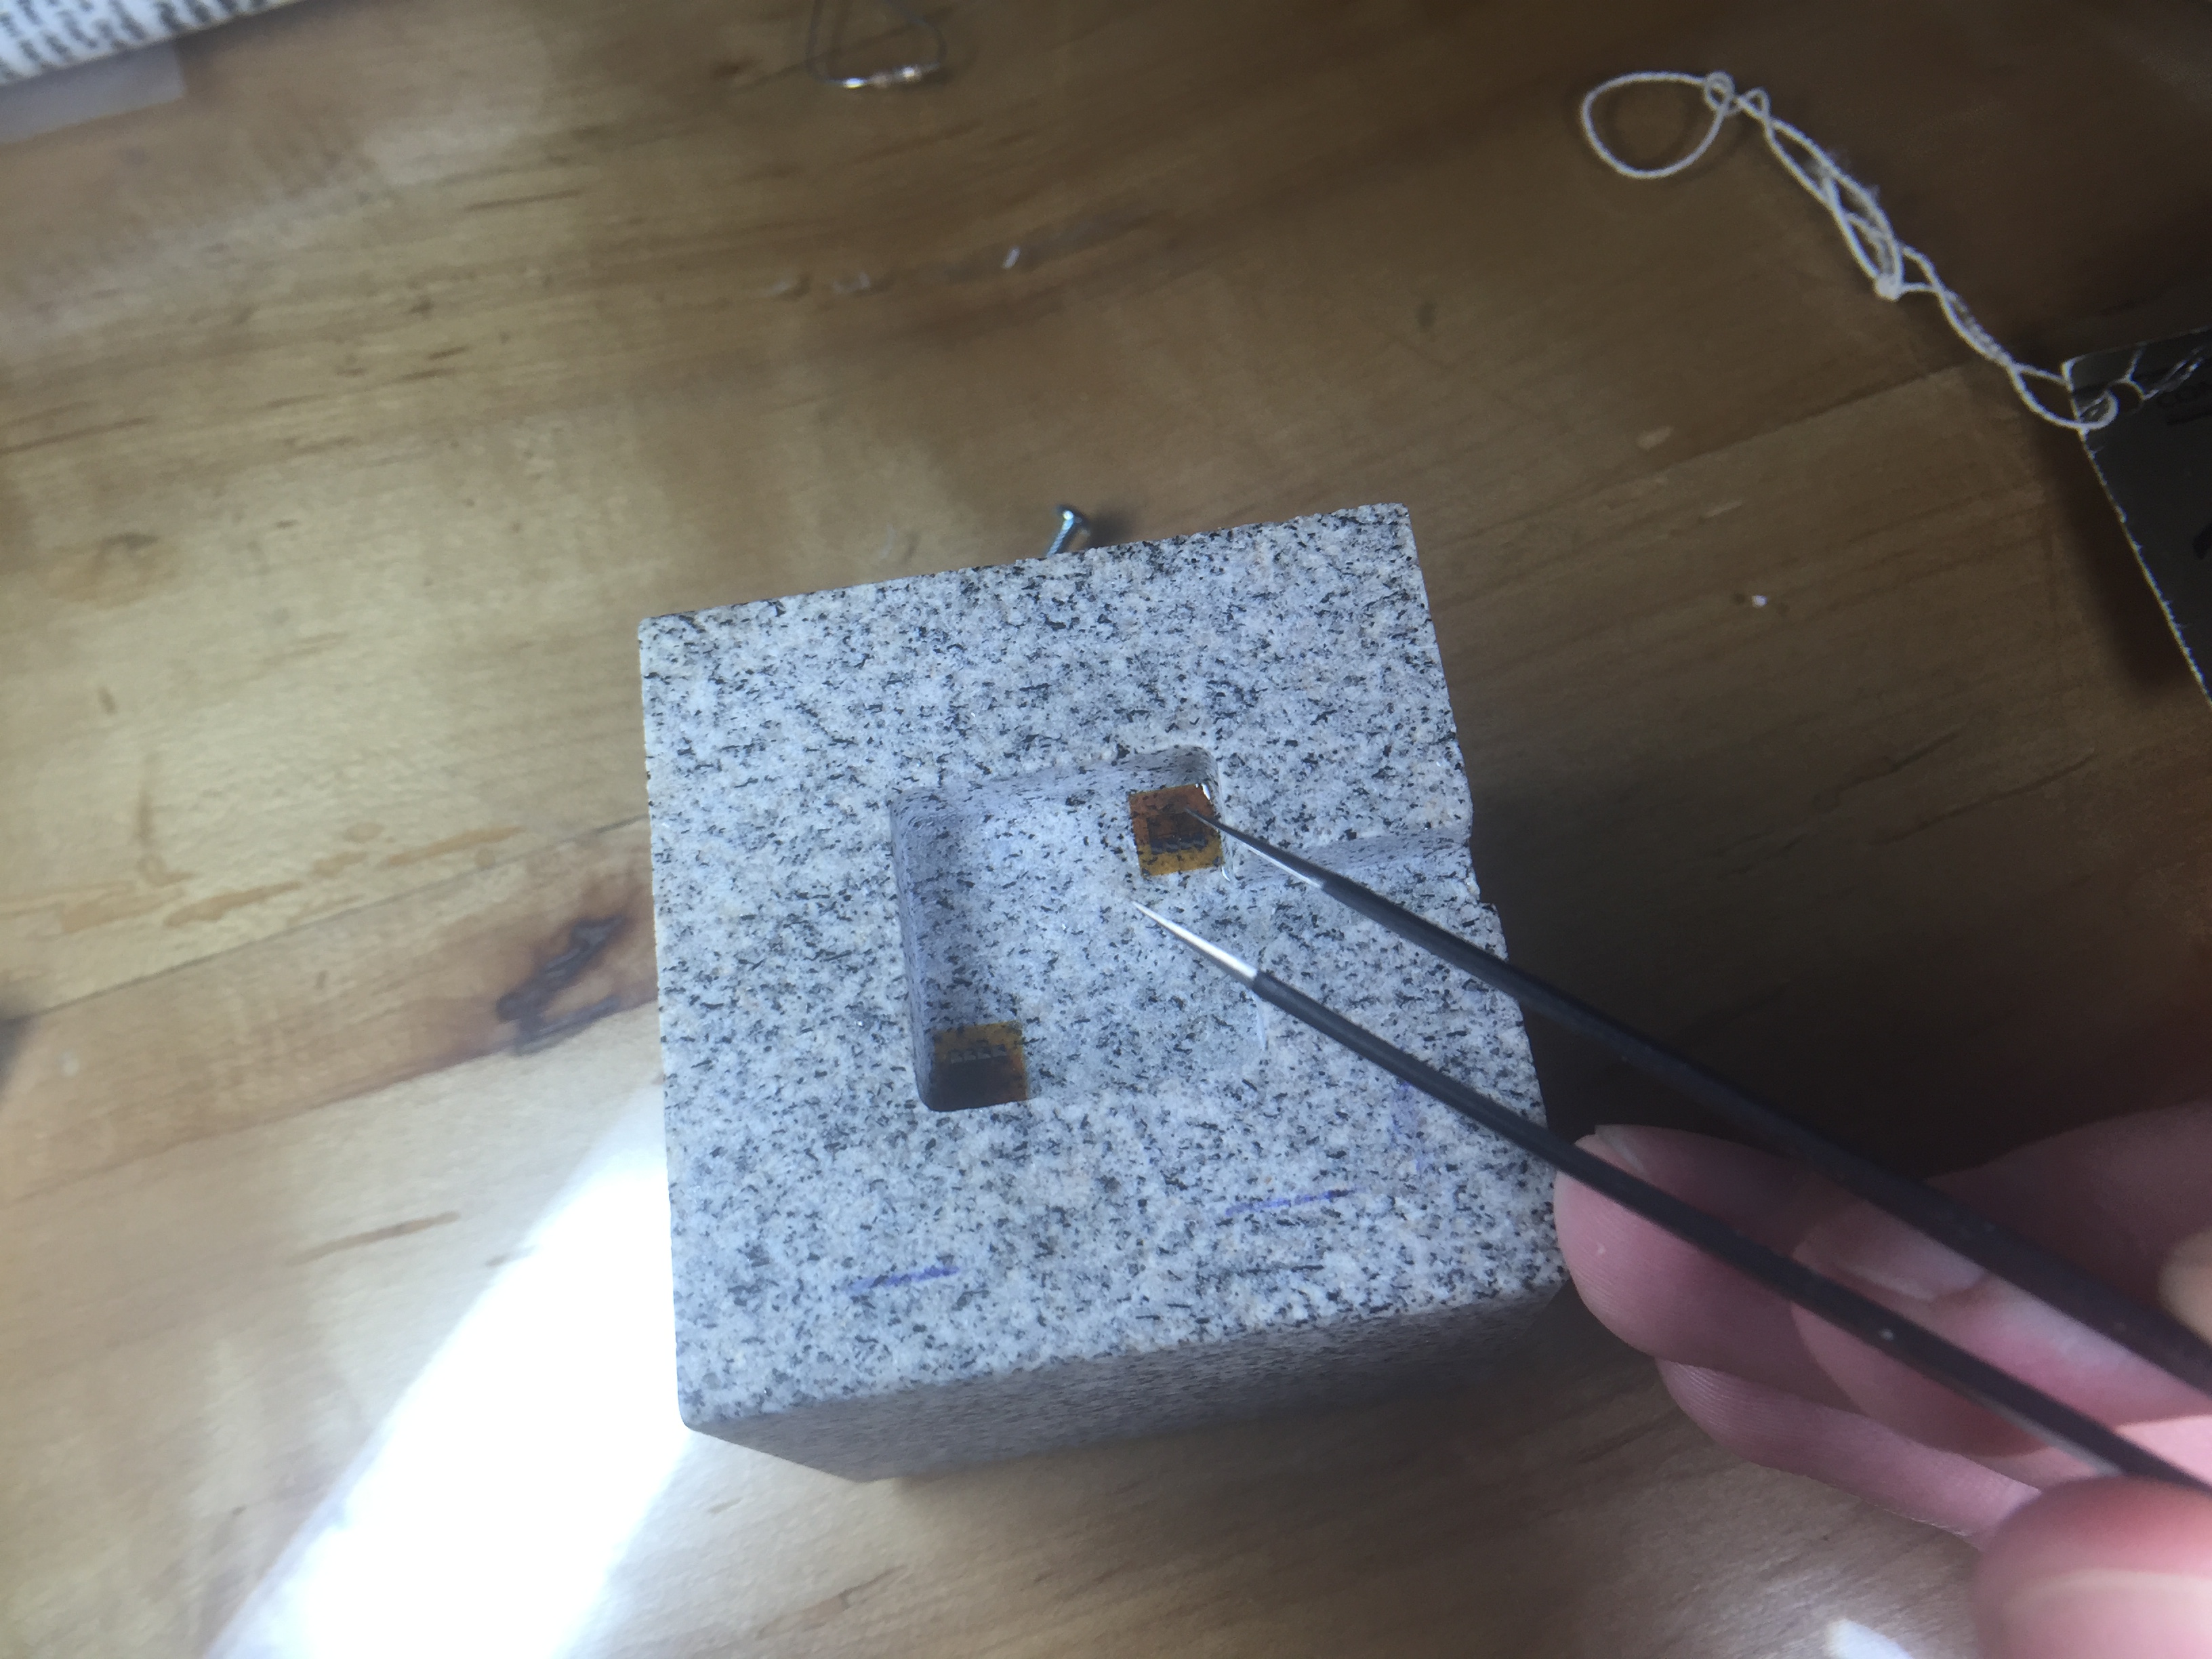
Another thing I wanted to change was the rock we use for the demo. The large granite bar you stepped on was bulky and hard to transport. I also though squeezing with your hands would add to the effect. We had a small cube of granite about 2" on a side cut with a water jet, then ground smooth. The machine shop milled out a 1/4" deep recess where I could epoxy the strain gauges.
Placing strain gauges under a magnifier with tweezers and epoxy.
Going into step-by-step build instructions is something I'm working on over at the project's Hack-a-Day page. I'm also getting the code and drawings together in a GitHub repository (slowly since it is job application time). Currently the instructions are lacking somewhat, but stay tuned. Checkout the video of the final product working below:
The demo was a great success. We debuted it at the AGU Exploration Station event. Penn State even wrote up a nice little article about our group. Parents and kids were amazed that they could deform the rock, and even more amazed when I told them that full scale on the meter was about 0.5µm of deformation. In other words they had compressed the rock about 1/40 the width of a single human hair.
A few lessons came out of this. Shipping an acrylic box is a bad idea. The meter was cracked on the side in return shipping. The damage is reparable, but I'm going to build a smaller (~12-18") unit with a wood frame and back and acrylic for the front panel. I also had a problem with parts breaking off the PCB in shipment. I wanted the electronics exposed for people to see, but maybe a clear case is best instead of open. I may try open one more time with a better case on it for transport. The final lesson was just how hard on equipment young kids can be. We had some enthusiastic rock squeezers, and by the end of the day the insulation on the wires to the rock was starting to crack. I'm still not sure what the best way to deal with this is, but I'm going to try a jacketed cable for starters.
Keep an eye on the project page for updates and if any big changes are made, you'll see them here on the blog as well. I'm still thinking of ways to improve this demo and a few others, but this was a giant step forward. Kids seeing a big "Rock Squeeze O Meter" was a real attention getter.
Hmm... As I'm writing this I'm thinking about a giant LED bar graph. It's easy to transport and kind of like those test your strength games at the fair... I think I better go parts shopping.