Category Archives: Open Source

KiCad and TextExpander - How I saved a few hours of BOM making

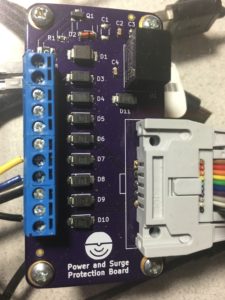
2016-07-30 21.03.20Folks that follow my various projects have probably noticed that I've recently formed an instrumentation and consulting company. I've had great fun doing several jobs for folks ranging from CAD design of brackets to writing numerical models for projects to designing custom measurement solutions. I've also been very busy designing some exciting new hardware that I hope will be available soon. In this post I wanted to share a time saving trick I used in KiCad while designing my printed circuit boards for one of these projects.

When designing things to be made in any quantity by an assembler or manufacturer (and for financial reasons) you need to keep a really good bill of materials or "BOM". Doing this often involves linked Excel sheets, binders of parts lists, and general gnashing of teeth. When working on the BOM for my circuit boards I found an excellent post by Dan over at Rheingold Heavy on designing for manufacture with KiCad. In this post he outlines a really nice workflow on how to keep track of part numbers and other meta-data  for each component. Ideally this would happen at the beginning of a project. You would assign a part (say a resistor) a manufacturer's part number, distributor's part number, etc. Then, you can copy that component (and it's metadata) as many times as you need by simply hovering over it and hitting "C". Well, I already had my entire schematic and board layout completed. I had a lot of components that were used many times (think 10 k resistors, 0.1uF caps, and jumpers). I didn't want to keep copying and pasting the information over and over from the websites of the manufactures and distributors and I didn't want to delete the components and copy in components with metadata for fear of destroying my completed project, footprint associations, and who knows what else. My solution? TextExpander.

TextExpander is a program that stores snippets of text and lets you type a few trigger keys to place all of that text in a fraction of a second. I've used it for years and it has easily saved me tens of hours on my laptop. I've got snippets for date and time stamps, outlines for our podcast, form replies about common technical issues in our lab, chunks of code that I use a lot, and really just about anything else you can imagine. (I forgot to add LaTeX equations/tables in there, but that alone saves me a lot of time on every paper I write.) The pricing model for TextExpander has changed recently, and I'm not a huge fan of the new scheme, but that's beside the point.

My idea was simple. I made a set of snippets that would expand into web addresses and part numbers. I would copy information in for a certain part, then using TextExpander add that information to add parts of that kind. After that, I'd change the snippets to the next part and repeat. Yes, this took awhile, but nowhere near as long as if I'd done all of the population by "hand". I've made a quick demo video below to show you how it's done. I hope this ends up being useful to others, let me know of any tricks you've come across to speed your DFM process.

How Thick is the Crust?

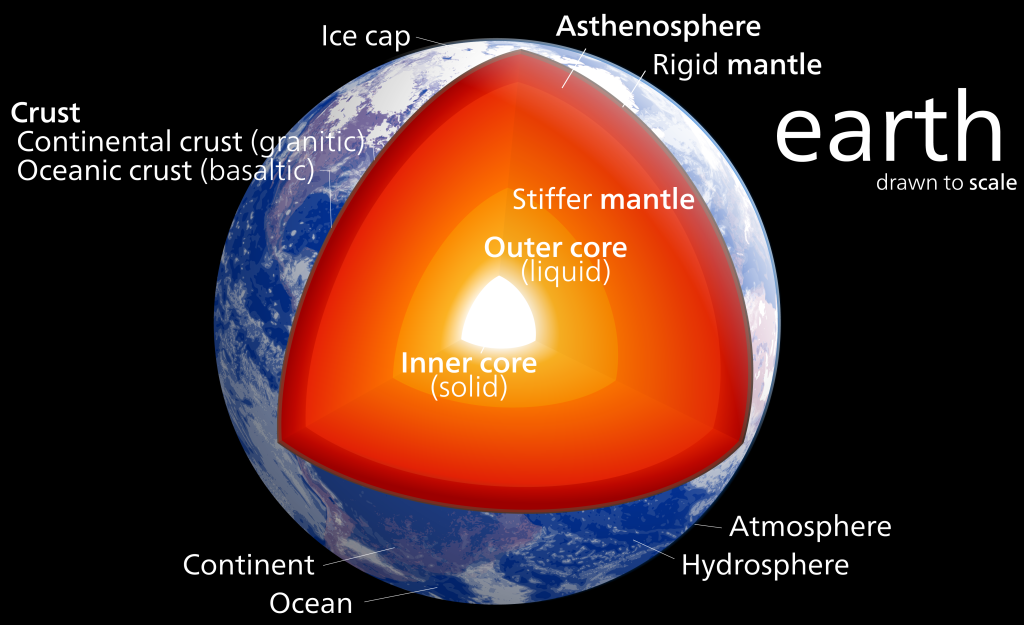
Earth's Structure (Wikipedia)

Earth's Structure (Wikipedia)

I think the first time I really heard much about the Earth's crust was on the TV show "Bill Nye the Science Guy." (In fact, I was obsessive about not missing an episode as a child and I was ecstatic when I got to see Bill speak at Penn State last year.) He talked about earthquakes and Earth's structure, cut in with funny segments of a family telling their son, "Ritchie, eat your crust."

The crust in an interesting thing - it's what we live on top of and there are lots of interesting places where it's different due to geologic processes that concentrate certain types of materials. The crust is broken up into around a dozen major tectonic plates that move at about 4-6"/year. These plates are either oceanic or continental crust. Oceanic crust is generally relatively thin ~6 km (4 miles) and oceanic crust is much thicker at ~35 km (22 miles). The thin oceanic crust is also more mafic and dense than the felsic continental crust.

These differences create complex interactions when the plates meet each other at plate boundaries. We did a whole show on plate tectonics over at the Don't Panic Geocast recently, so if you'd like to hear about the discovery and arguments over plate tectonics you should check it out.

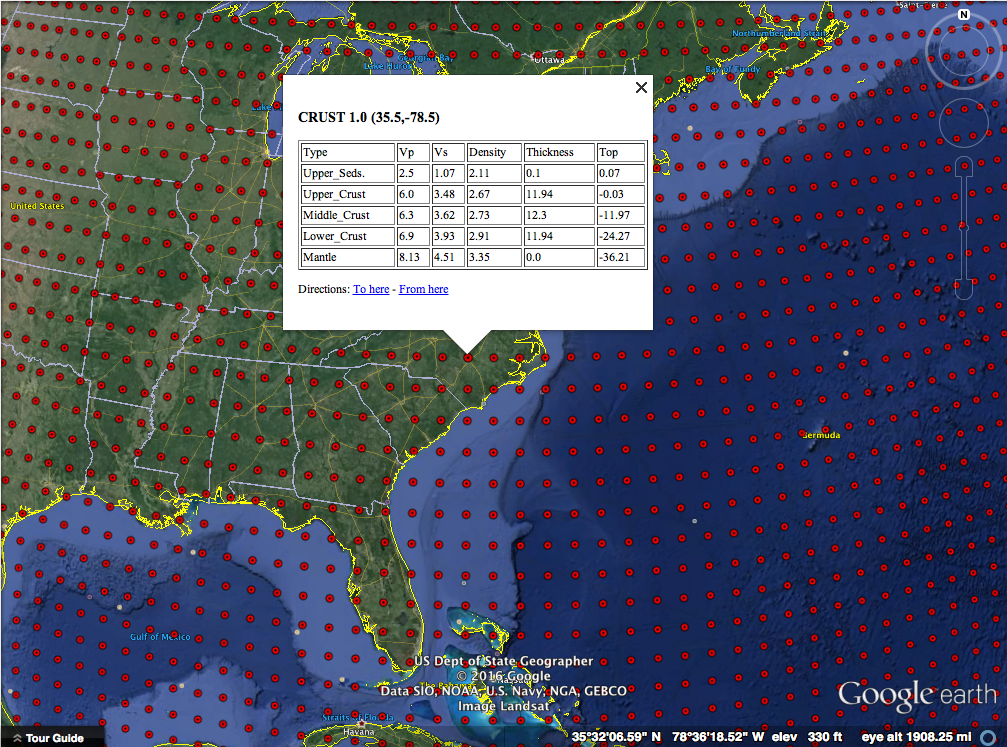
Today, I'd like to share a tool and Dr. Charles Ammon and I have made to visualize a crust model and allow anyone to explore the crust. All you need is Google Earth! We used a model called Crust 1.0 by Laske et al. that has how thick the crust (broken up into a few divisions) is for  64,800 points on the Earth along with some other crustal properties. That's every one degree of latitude and longitude! They put a lot of work into making this model. Generally we would use a Fortran program to get values out of the model, but Dr. Ammon had an idea to visualize the data in a more intuitive way with Google Earth. Over the Thanksgiving holiday I wrote a Python utility to access the model values and then we wrote a simple script that generates a Google Earth KML file based on the model.

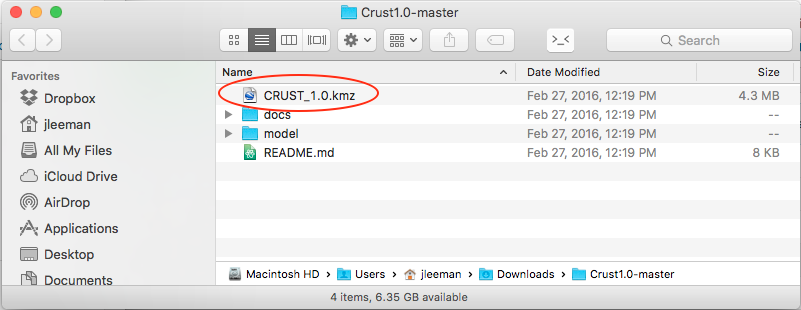
All you have to do is head over to the project's GitHub page and click the "Download ZIP" button. While you're waiting on the download you can scroll down and read all about the development, the model, and find activities to try. Next, open folder you downloaded (most operating systems will automatically unzip it for you now) there will be several files, but the only one you need is the CRUST_1.0.kmz file.

Screenshot 2016-03-12 07.29.51

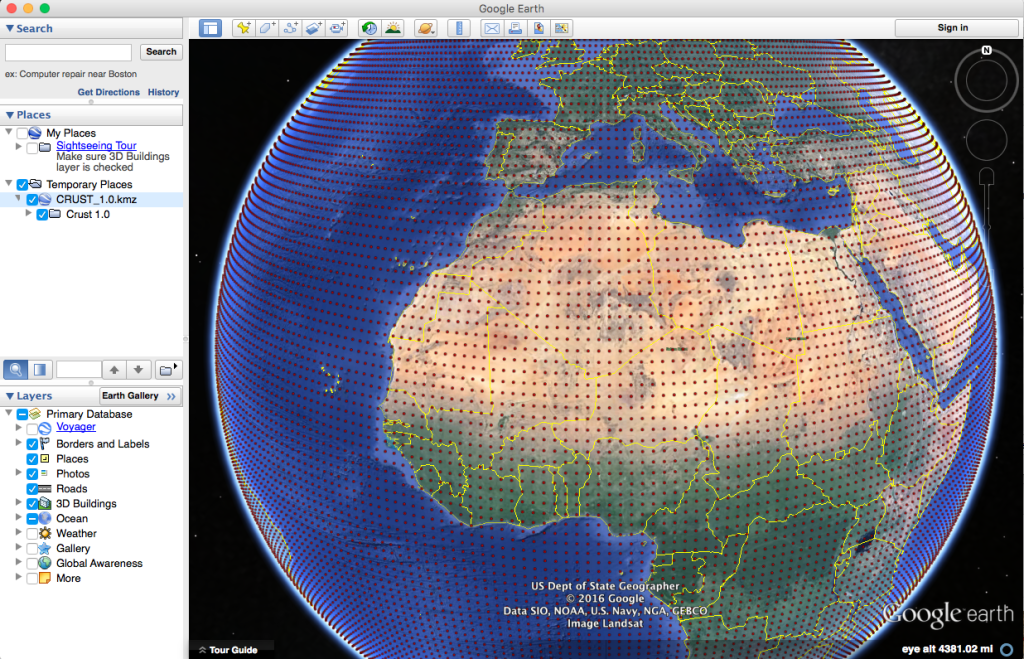
As long as you have Google Earth installed, double click that file and you'll see the Earth appear covered in red dots. If you zoom out too far, they will disappear though!

Screenshot 2016-03-12 07.31.49

Each red dot is a location where the model has the average crustal properties like how fast P and S seismic waves can travel and the density. All of these are explained in more detail on the project webpage. You should also try some of the projects we have listed there! As a starter, let's look at oceanic and continental crust and verify my assertion about their 3x thickness difference.

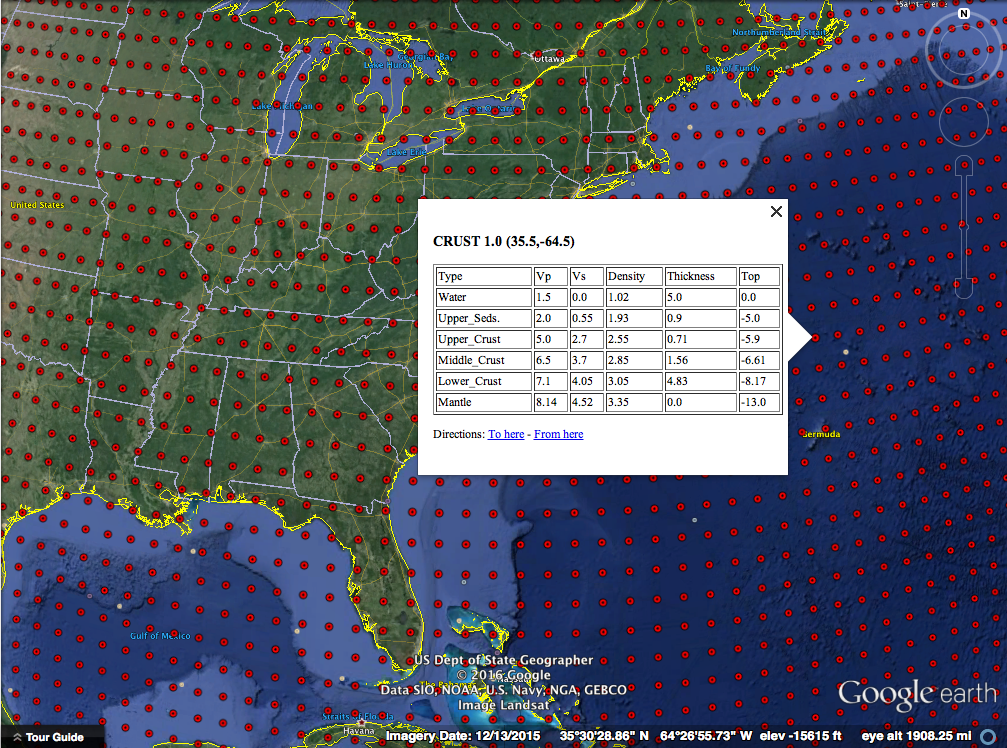
Clicking out in the Atlantic Ocean (make sure you are not on the continental shelf) we see about 13 km thick crust (the top of the mantle number). The water depth is also handy to have on-hand sometimes.

Screenshot 2016-03-12 07.35.15

Clicking well onto the North American plate we see about 36 km thick crust. Next you should head over to mountainous regions and basins and see how the structure of the crust is different - why is that? Sorry, no homework answers here!

Screenshot 2016-03-12 07.35.26

This is a really fun way to learn about the crust and a good reference tool as well! There are flyers in the docs folder that you can print to use as teaching aids or handout to students! We had a lot of fun making this 1-day project and hope that you'll explore it and let us know what you think! A big thanks to the folks that did the massive amount of work making the model - we just made it visible in Google Earth! Everything is open-source as always.

Squeezing Rocks with your Bare Hands

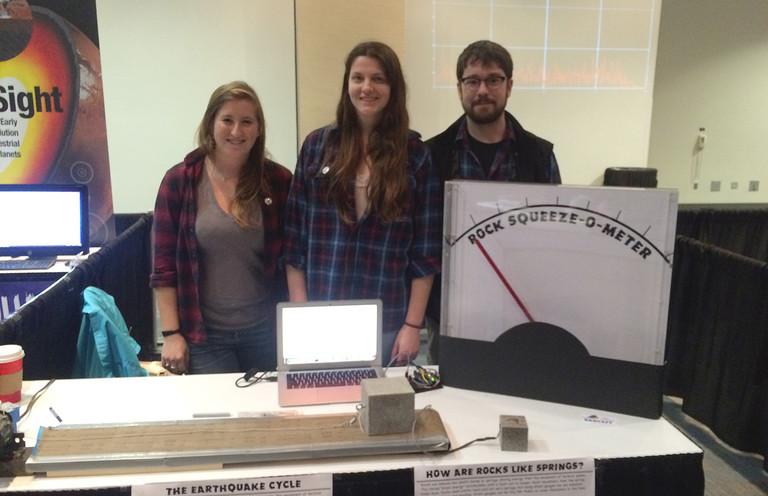
Our lab group. Photo: Chris Marone

Our lab demo group. Photo: Chris Marone

As frequent readers of the blog or listeners of the podcast will know, I really like doing outreach activities. It's one thing to do meaningful science, but another entirely to be able to share that science with the people that paid for it (taxpayers generally) and show them why what we do matters. Outreach is also a great way to get young people interested in STEAM (Science, Technology, Engineering, Art, Math). When anyone you are talking to, adult or child, gets a concept that they never understood before, the lightbulb going on is obvious and very rewarding.

Our lab group recently participated in two outreach events. I've shared about the demonstrations we commonly use before when talking about a local science fair. There are a few that probably deserve their own videos or posts, but I wanted to share one in particular that I improved upon greatly this year: Squeezing Rocks.

Awhile back I shared a video that explained how rocks are like springs. The normal demonstration we used was a granite block with strain gauges on it and a strip chart recorder... yes... with paper and pen. I thought showing lab visitors such an old piece of technology was a bit ironic after they had just heard about our lab being one of the most advanced in the world. Indeed when I started the paper feed, a few parents would chuckle at recognizing the equipment from decades ago. For the video I made an on-screen chart recorder with an Arduino. That was better, but I felt there had to be a better way yet. Young children didn't really understand graphs or time series yet. Other than making the line wiggle, they didn't really get the idea that it represented the rock deforming as they stepped on it or squeezed it.

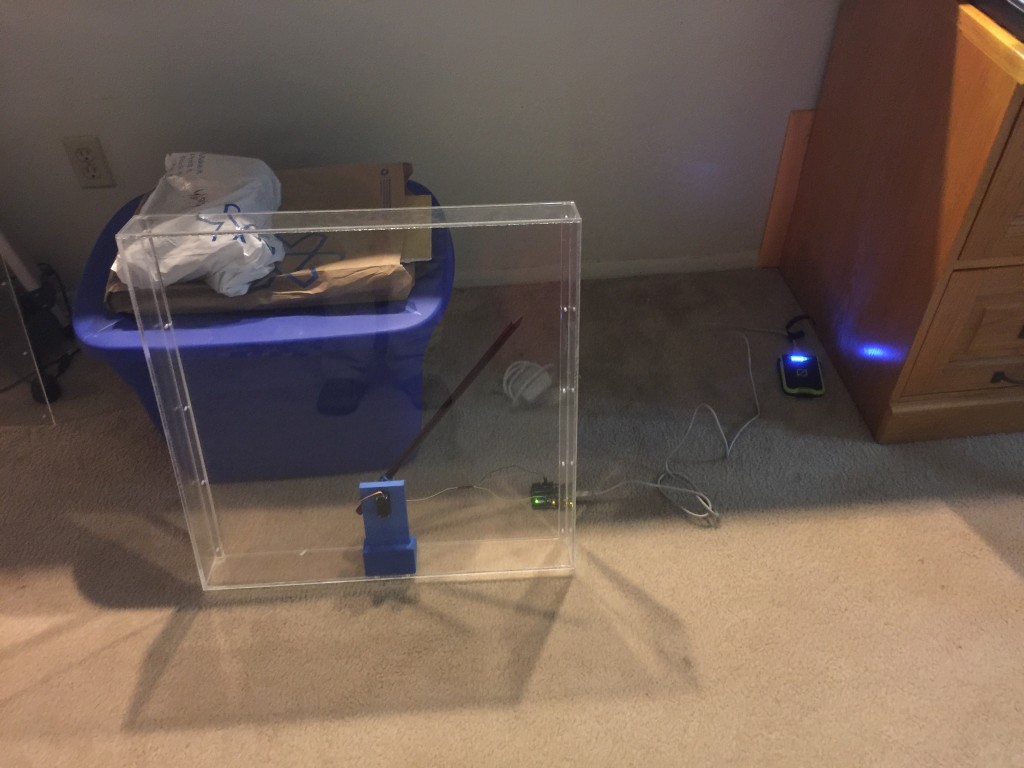
I decided to go semi old-school with a giant analog meter to show how much the rock was deformed. I wanted to avoid a lot of analog electronics as they always get finicky to setup, so I elected to go with the solution on a chip route with a micro-controller and the HX711 load cell amplifier/digitizer. For the giant meter, I didn't think building an actual meter movement was very practical, but a servo and plexiglass setup should work.

A very early test of the meters shows it's 3D printed servo holder inside and the electronics trailing behind.

A very early test of the meters shows it's 3D printed servo holder inside and the electronics trailing behind.

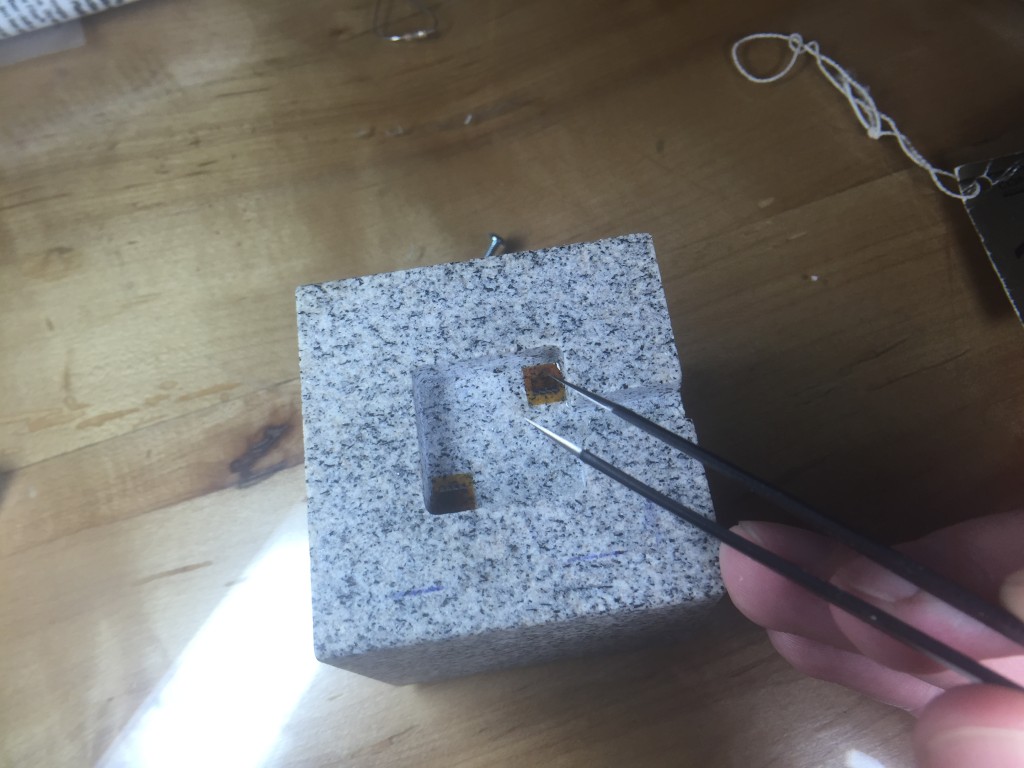
Another thing I wanted to change was the rock we use for the demo. The large granite bar you stepped on was bulky and hard to transport. I also though squeezing with your hands would add to the effect. We had a small cube of granite about 2" on a side cut with a  water jet, then ground smooth. The machine shop milled out a 1/4" deep recess where I could epoxy the strain gauges.

Placing strain gauges under a magnifier with tweezers and epoxy.

Placing strain gauges under a magnifier with tweezers and epoxy.

Going into step-by-step build instructions is something I'm working on over at the project's Hack-a-Day page. I'm also getting the code and drawings together in a GitHub repository (slowly since it is job application time). Currently the instructions are lacking somewhat, but stay tuned. Checkout the video of the final product working below:

The demo was a great success. We debuted it at the AGU Exploration Station event. Penn State even wrote up a nice little article about our group. Parents and kids were amazed that they could deform the rock, and even more amazed when I told them that full scale on the meter was about 0.5µm of deformation. In other words they had compressed the rock about 1/40 the width of a single human hair.

A few lessons came out of this. Shipping an acrylic box is a bad idea. The meter was cracked on the side in return shipping. The damage is reparable, but I'm going to build a smaller (~12-18") unit with a wood frame and back and acrylic for the front panel. I also had a problem with parts breaking off the PCB in shipment. I wanted the electronics exposed for people to see, but maybe a clear case is best instead of open. I may try open one more time with a better case on it for transport. The final lesson was just how hard on equipment young kids can be. We had some enthusiastic rock squeezers, and by the end of the day the insulation on the wires to the rock was starting to crack. I'm still not sure what the best way to deal with this is, but I'm going to try a jacketed cable for starters.

Keep an eye on the project page for updates and if any big changes are made, you'll see them here on the blog as well. I'm still thinking of ways to improve this demo and a few others, but this was a giant step forward. Kids seeing a big "Rock Squeeze O Meter" was a real attention getter.

Hmm... As I'm writing this I'm thinking about a giant LED bar graph. It's easy to transport and kind of like those test your strength games at the fair... I think I better go parts shopping.

Setting up a Lab Thermal Chamber

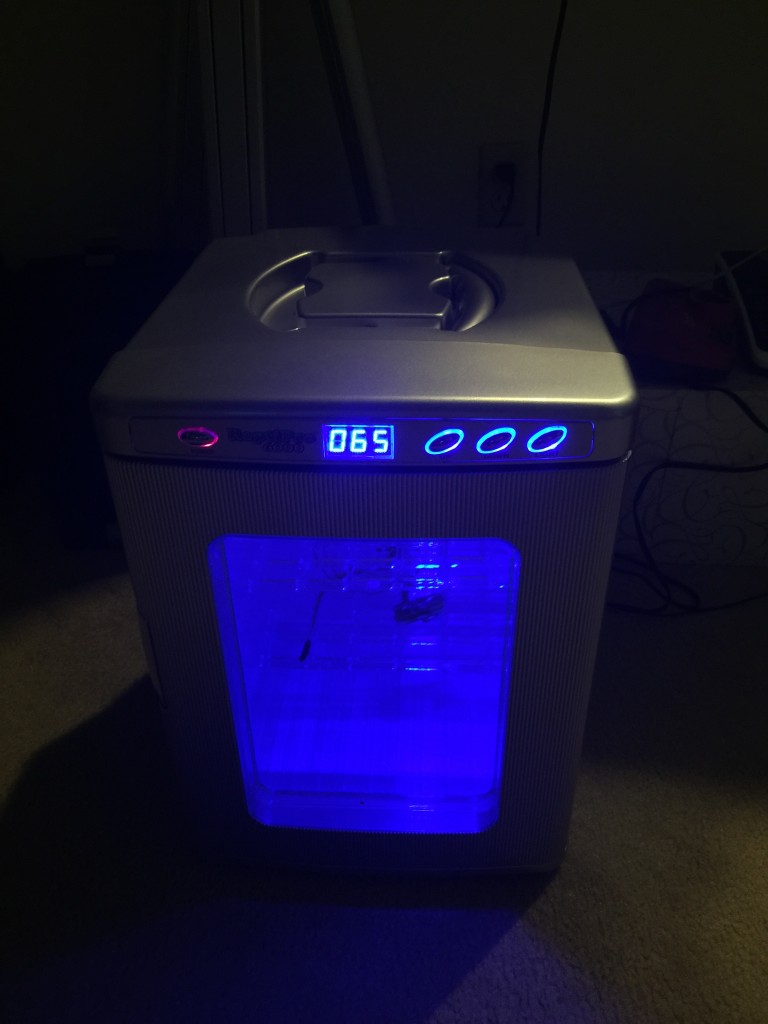
chamber_dark

I've been working on developing some geophysical instruments that will need some significant temperature compensation. Often times when you buy a sensor there is some temperature dependance (if not humidity, pressure, and a slew of other variables). The manufacturer will generally quote a compensation figure. Say we are measuring voltage with an analog-to-digital converter (ADC); the temperature dependance may be quoted as some number of volts per degree of temperature change over a certain range of voltages and temperatures. Generally this is a linear correction. Most of the time that is good enough, but for scientific applications we sometimes need to squeeze out every error we can and compare instruments. Maybe one sensor is sightly more temperature dependent than another; comparing the sensors could then lead us to some false conclusions. This means that sometimes we need to calibrate every sensor we are going to use. In the lab I work in, we calibrate all of our transducers every 6 months by using transfer standards. (Standards, transfer of standards, and calibration theory are a whole series of posts in themselves.)

To do thermal calibrations it is common to put the instruments into a thermal chamber in which we can vary the temperature over a wide range of conditions while keeping the physical variable we are measuring (voltage, pressure, load, etc) constant. Then we know any change in the reading is due to thermal effects on the system. If we are measuring something like tilt or displacement, we have to be sure that we are calibrating the electronics, not signals from thermal expansion of metals and materials that make up our testing jig.

I scoured EBay and the surplus store at our University, but only found very large and expensive units. I remembered that several years ago Dave Jones over at the EEVBlog had mentioned a cheap alternative made from a peltier device wine cooler. I dug up his video (below) and went to the web again in search of the device.

I found the chamber marketed as a reptile egg incubator on Amazon. The reviews were not great, some saying the unit was off by several degrees or did not maintain the +/- 1 degree temperature as marketed. I decided to give it a shot since it was the only affordable alternative and if it didn't work, maybe I could hack it with a new control system and use the box/peltier element with my own system. In this post I'm going to show you the stock performance of the chamber and some initial tests to figure out if it will do the job.

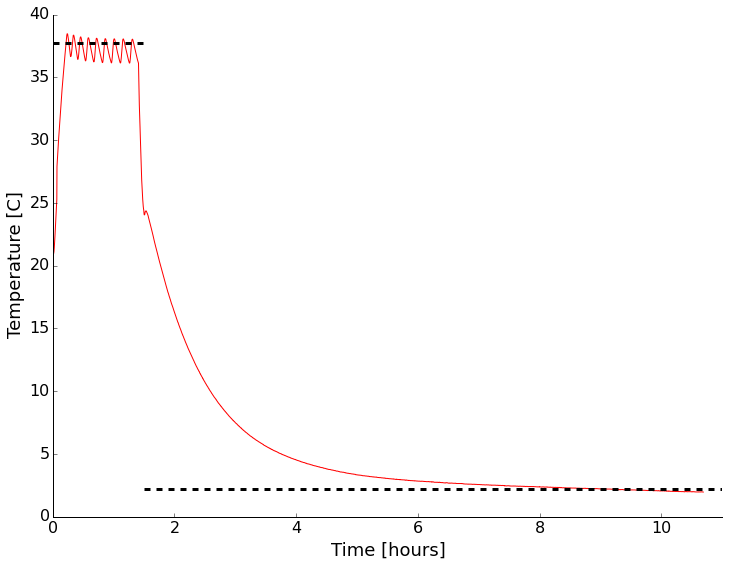
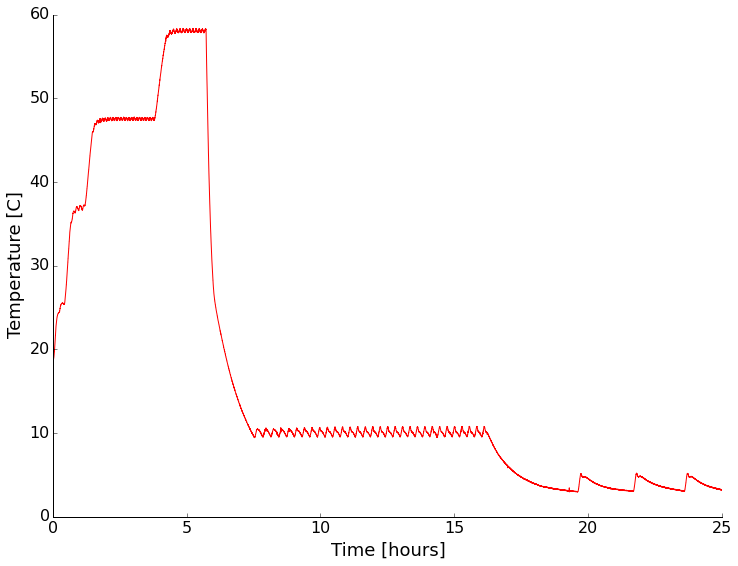
As soon as it arrived I setup the unit and put an environmental sensor in (my WxBackpack for the Light Blue Bean used back in the drone post) inside. I wanted to see if it was even close to the temperature displayed on the front and how good the control was with no thermal load inside. There was a small data drop-out causing a kink early in the record (around 30 C). It looks like the temperature is right on what I had set it to with the quoted +/- 1 degree range. There is some stabilization time and the mean isn't the same as the set point, but that makes sense to me, you don't want to overheat eggs! This looks encouraging overall. I also noticed that the LED light inside the chamber flickered wildly when the peltier device was drawing a lot of power heating/cooling the system. I then opened the door and set the unit to cool. After reaching room temperature, I closed the door and went to bed. It certainly isn't fast, but I was able to get down to about 2C with no thermal load. That was good enough for me. Time to add a cable port, checkout the LED issue, and test with some water jars for more thermal mass.

Initial test of the thermal chamber with nothing inside except a temperature logger. Set point shown by dashed line.

Initial test of the thermal chamber with nothing inside except a temperature logger. Set point shown by dashed line.

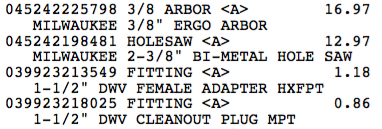
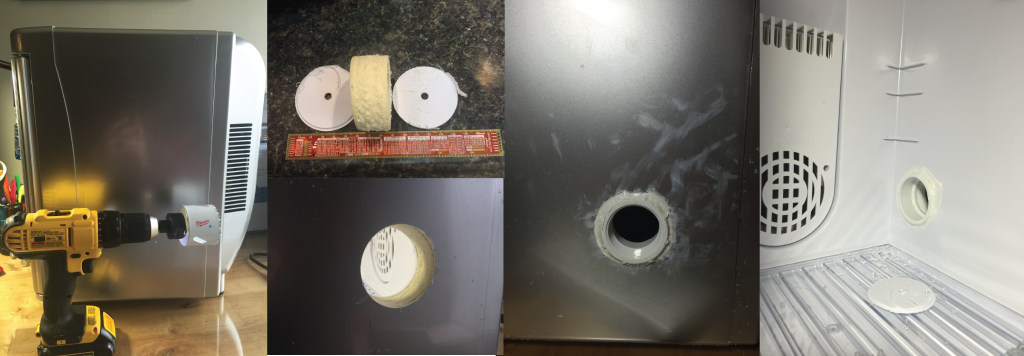
The next step was to add a cable port to be able to get test cables in and out. I decided to follow what Dave did and add a 1.5" test port with a PVC fitting, a hole saw, and some silicone sealant. Below are a few pictures of drilling and inserting the fitting. I used Home Depot parts (listing below). I didn't have the correct size hole-saw. That's happened a lot lately, so I invested in the Milwaukee interchangeable system. I got a threaded fitting so I can put a plug in if needed. the time honored tradition is to put your cables through the port and stuff a rag in though. This works as well as a plug generally, but it's nice to have the option.

Screenshot 2015-10-31 14.44.16

Before, during, and after cable port placement. The center of the hole is 7 3/8" back from the front do

Before, during, and after cable port placement. The center of the hole is 7 3/8" back from the front door seal, and 5 1/8" up from table top level. I used gel super glue to quickly fix the fitting to the plastic layers and foam. After that dried, I used silicone bath adhesive/sealant to seal the inside and outside. The edge of a junk-mail credit card offer made smoothing the silicone easier.

While working inside the chamber I pulled out the LED board and noticed a dodgy looking solder joint. I reflowed it. I also pulled the back off the unit to make sure there were no dangerous connections or anything that looked poor quality. Nothing jumped out.

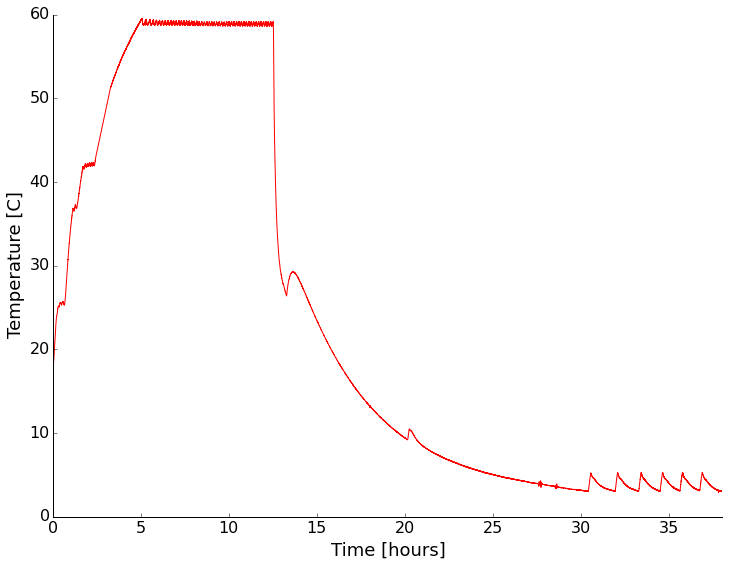
I put the whole thing back together and put a sensor in to monitor the environment and tested again. This time I tried a few different set points with and without containers of water inside the chamber. First with nothing but the sensor setup inside:

Fo

For both heating and cooling the performance under no thermal load (other than the sensor electronics) was pretty good. Cooling is rather slow and more poorly controlled than heating though.

Next I put sealed containers of water on the shelves of the chamber to add some thermal mass and see if that changed the characteristics of the chamber any. It did slow the temperature change as expected, but appears to have had little other effect (I didn't wait long enough for stabilization on some settings).

test_waterload

With a water load the chamber had similar performance, but was slower in getting to temperature as expected.

It looks like at temperatures above ambient the chamber has a stability of +/- 1 degree. Below ambient it becomes a couple of degrees. The absolute reading drifts a bit too. Setting the chamber to a given reading always resulted in stabilization within about a degree of the setting though.

I think this will be a nice addition to my home lab. While the unit isn't incredibly accurate, I will be recording the device temperature anyway, so that works for me. It'd be nice to cool down more quickly though, so I may facilitate that with some dry ice. Stay tuned as I'll be testing instruments in there sometime in the next month or so.

P.S. - The LED light still flickers in a way that indicates unstable power/connection. Not a deal breaker for me since I don't really need the light, but something to remember.

PSA About ABS - A Surprising Tale in 3D Printing

A little over a year ago I got a 3D printer. I've had a great experience with it! I had printed a lot of lab hardware and some fun things, but then let it sit around for a few months while things were very busy in other parts of work. This past week was maker week in State College, so there were lots of 3D printing demonstrations around town and other maker projects. I decided I should get things fired up again. I've got a couple of new projects that will need custom enclosures built. Without being able to have a spot-welder in my apartment, I'm pretty much limited to plastics or paying for the manufacturing.

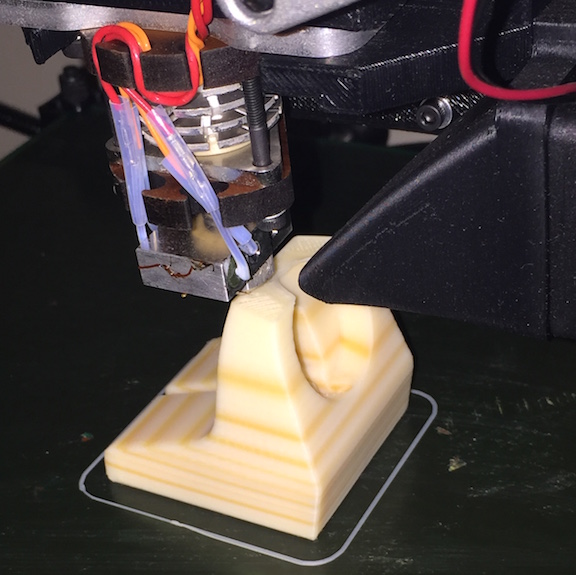
I re-leveled and calibrated the bed and z-axis mechanism. I carefully re-checked the extruder calibration to be sure that I got the appropriate amount of plastic extruded. Everything looked great, so I downloaded a simple, but utilitarian part for my Apple Watch off thingiverse. Using Slic3r, I created the GCode and sent it off to print. Everything started off like normal, so I left the printer running to deal with other tasks. I came back later and too many surprise the part had stripes!

2015-08-29 19.52.56

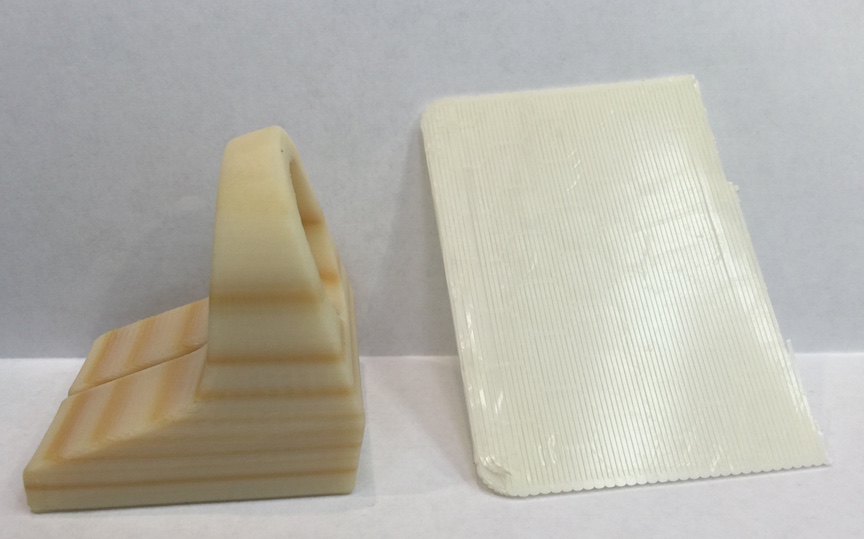
I've always printed with ABS plastic. It's not that I don't want to use PLA, it's just what I've always had on hand and what I know how to work with. I happened to have left the white roll of plastic on the printer after my last print. Since my printer sits next to the window, it gets some sunlight, especially in the morning hours. Not the best location, but it's the only location I can place it for the moment. It looks like the UV radiation has damaged my filament! Every time the part of the roll that was exposed heavily comes around, I get a band. For a simple charging stand, I'm not too upset. I could even try some of the ABS bleaching brews used by antique computer collectors. I may just paint the whole thing with paint that matches my wooden night stand. Maybe this will give me a false wood grain look?

I wanted to confirm that the stripes corresponded to a revolution of the spool. The whole part is darker than parts printed from the same roll months ago, but I'd guess the darker bits were on the top of the roll. By analyzing the GCode that produced the part, I calculated that the printed used about 5.1 meters of filament (<$2). The roll has been used down to a coiling diameter of about 150 mm. That means I expect about 10-11 turns of the reel for the print. I see 7-10 layers depending on what I count, so I'll call that close enough.

2015-08-29 20.34.26

Well that's the story for now. Don't leave your ABS in the sunlight, even on your machine. I've been meaning to get a dust cover for the machine and this is even more reason to do so and make sure it's opaque.

Open Science Pt. 2 - Open Data

For the second installment in our summer open science series, I’d like to talk about open data. This could very well be one of the more debated topics; I certainly know it always gets my colleagues opinions exposed very quickly in one direction or the other. I’d like to think about why we would do this, methods and challenges of open data, and close with my personal viewpoint on the topic.

What is Open Data?

Open data simply means putting data that supports your scientific arguments in a publicly available location for anyone to download, replicate your analysis, or try new kinds of analysis. This is now easier than ever for us to do with a vast array of services that offer hosting of data, code, etc. The fact that every researcher will likely have a fast internet connection makes most arguments about file size invalid, with the exception of very large (100’s of gigabytes) files. The quote below is a good starting place for our discussion:

Numerous scientists have pointed out the irony that right at the historical moment when we have the technologies to permit worldwide availability and distributed process of scientific data, broadening collaboration and accelerating the pace and depth of discovery…..we are busy locking up that data and preventing the use of correspondingly advanced technologies on knowledge.

- John Wilbanks, VP Science, Creative Commons

Why/Why-Not Open Data?

When I say that I put my data “out-there” for mass consumption, I often get strange looks from others in the field. Sometimes it is due to not being familiar with the concept, but other times it comes with the line “are you crazy?”  Let’s take a look at why and why-not to set data free.

First, let’s state the facts about why open data is good. I don’t think there is much argument on these points, then we’ll go on to address more two-sided facets of the idea. It is clear that open data has the potential to increase the friendliness of a group of knowledge workers and the ability to increase our collaboration potential. Sharing our data enables us to pull from data that has been collected by others, and gain new insights from other’s analysis and comments on our data. This can reduce the reproduction of work and hopefully increase the numbers of checks done on a particular analysis. It also gives our supporters (tax payers for most of us) the best “bang for their buck.” The more places that the same data is used, the cost per bit of knowledge extracted from it is reduced. Finally, open data prevents researchers from taking their body of knowledge “to the grave” either literally or metaphorically. Too often a grad student leaves a lab group to go on in their career and all of their data, notes, results, etc that are not published go with them. Later students have to reproduce some of the work for comparison using scant clues in papers, or email the original student and ask for the data. After some rummaging, they are likely emailed a few scattered, poorly formatted spreadsheets with some random sampling of the data that is worse than no data at all. Open data means that quality data is posted and available for anyone, including future students and future versions of yourself!

Like every coin, there is another side to open data. This side is full of “challenges.” Some of these challenges even pass the polite term and are really just full-blown problems. The biggest criticism is wondering why someone would make the data that they worked very hard to collect out in the open, for free, to be utilized by anyone and for any purpose. Maybe you plan on mining the data more yourself and are afraid that someone else will do that first. Maybe the data is very costly to collect and there is great competition to have the “best set” of data. Whatever the motivation, this complaint is not going to go away. Generally my reply to these criticisms goes along the lines of data citation. Data is becoming a commodity in any field (marketing, biology, music, geology, etc). The best way to be sure that your data is properly obtained is to make it open with citation. This means that people will use your data, because they can find it, but provide proper credit. There are a number of ways to get your data assigned a digital object identifier (DOI), including services like datacite. If anything, this protects the data collector by providing a time-stamp of doing data collection of phenomena X at a certain time with a time-stamped data entry. I’m also very hopeful that future tenure committees will begin to recognize data as a useful output, not just papers. I’ve seen too many papers that were published as a “data dump.” I believe that we are technologically past that now, if we can get past "publish or perish," we can stop these publications and just let the data speak for itself.

Another common statement is “my data is too complicated/specialized to be used by anyone else, and I don’t want it getting mis-used.” I understand the sentiment behind this statement, but often hear it as “I don’t want to dedicate time to cleaning up my data, I’ll never look at it after I publish this paper anyway.” Taking the time to clean up data for it to be made publicly available is when you have a second chance to find problems, make notes about procedures and observations, and make it clear exactly what happened during your experiment (physical or computational). I cannot even count the number of times I’ve looked back at old data and found notes to myself in the comments that helped guide me through re-analysis. These notes saved hours of time and possibly a few mistakes along the way.

Data Licensing

Like everything from software to intellectual property, open-data requires a license to work. No license on data is almost worse that no data at all because the hands of whoever finds it are legally bound to do nothing with it. There is even a PLOS article about licensing scientific software that is a good read and largely applies to data.

What data licensing options are available to you are largely a function of the country you work in and you should talk with your funding agency. The country or funding agency may limit the options you have. For example, any US publicly funded research must be available after a presidential mandate that data be open where possible “as a public good to advance government efficiency, improve accountability, and fuel private sector innovation, scientific discovery, and economic growth.” You can read all about it in the White House U.S. Open Data Action Plan. So, depending on your funding source you may be violating policy by hoarding your data.

There is one exception to this: Some data are export controlled, meaning that the government restricts what can be put out in the open for national security purposes. Generally this pertains to projects that have applications in areas such as nuclear weapons, missile guidance, sonar, and other defense department topics. Even in these cases, it is often that certain parts of the data may still be released (and should be), but it is possible that some bits of data or code may be confidential. Releasing these is a good way to end up in trouble with your government, so be sure to check. This generally applies to nuclear and mechanical engineering projects and some astrophysical projects.

File Formats

A large challenge to open data is the file formats we use to store our data. Often times the scientist will use an instrument to collect their data that stores information in a manufacturer specific, proprietary format. It is analyzed with proprietary software and a screen-shot of the results included in the publication. Posting that raw data from the instrument does no good since others must have the licensed and closed-source software to even open it. In many cases, the users pay many thousands of dollars a year for a software “seat” that allows them to use the software. If they stop paying, the software stops working… they never really own it. This is a technique that the instrument companies use to ensure continued revenue. I understand the strategy from a business perspective and understand that development is expensive, but this is the wrong business model for a research company. Especially considering that the software is generally difficult to use and poorly written.

Why do we still deal in proprietary formats? Often it is because that is what the software we use has, as mentioned above. Other times it is because legacy formats die hard. Research groups that have a large base of data in an outdated format are hesitant to update the format because it involves a lot of data maintenance. That kind of work is slow, boring, and unfunded. It’s no wonder nobody wants to do it! This is partially the fault of the funding structure, and unmaintained data is useless data and does not fulfill the “open” idea. I’m not sure what the best way to change this idea in the community is, but it must change. Recent competitions to “rescue” data from older publications are a promising start. Another, darker, reason is that some researches want to make their data obscure. Sure, it is posted online, so they claim it is “open”, but the format is poorly explained or there is no meta-data. This is a rare case, but in competitive fields can be found. This is data hoarding in the ugliest form under the guise of being open.

There are several open formats that are available for almost any kind of data including plain text, markdown, netCDF, HDF5, and TDMS. I was at a meeting a few years ago where someone argued that all data should be archived as Excel files because “you’ll always be able to open those.” My jaw dropped. Excel is a closed, XML based, format that you must have a closed-source program to open. Yes, Open Office can open those files, but compatibility can be sketchy. Stick to a format that can handle large files (unlike Excel), supports complex multi-dimensional data (unlike Excel), and has many tools in many languages to read/write it (unlike Excel).

The final format/data maintenance task is a physical format concern. Storage media changes with time. We have transitioned from tapes, floppy disks, CDs, and ZIP disks to solid state storage and large external hard-drives. I’m sure some folks have their data on large floppy disks, but haven’t had a computer to read them in years. That data is lost as well. Keeping formats updated is another thankless and unfunded task. Even modern hard-drives must be backed up and replaced after a finite shelf life to ensure data continuity. Until the funding agencies realize this, the best we can do is write in a small budget line-item to update our storage and maintain a safe and useful archive of our data.

Meta-Data

The last item I want to talk about in this already long article is meta-data. Meta-data, as the name implies, are data about the data. Without the meta-data, most data are useless. Data must be accompanied by the experimental description, relevant parameters (who, when, where, why, how, etc), and information about what each data item means. Often this data lives in the pages of the laboratory notebooks of experimenters or on scraps of paper or whiteboards for modelers. Scanners with optical character recognition (OCR) can help solve that problem in many cases.

The other problems with meta-data are human problems. We think we’ll remember something, or we don’t have time to collect it. Anytime that I’ve thought I didn’t have time to write good notes, I payed by spending much more time after the fact figuring out what happened. Collecting meta-data is something we can’t ever do enough of and need to train ourselves to do. Again, it is a thankless and unfunded job… but just do it. I’ve even just turned on a video or audio recorder before and dictated what I’m doing. If you are running a complex analysis procedure, flip on a screen capture program and make a video of doing it to explain it to your future self and anyone else who is interested.

Meta-data is also a tricky beast because we never know what to record. Generally, record everything you think is relevant, then record everything else. In rock mechanics we generally record stress conditions, but never think to write down things like temperature and humidity in the lab. Well, we never think to until someone proves that humidity makes a difference in the results. Now all of our old data could be mined to verify/refute that hypothesis, except we don’t have the meta-data of humidity. While recording everything is impossible, it is wise to record everything that you can within a reasonable budget and time commitment. Consistency is key. Recording all of the parameters every time is necessary to be useful!

Final Thoughts

Whew! That is a lot of content. I think each item has a lot unsaid still, but this is where my thinking currently sits on the topic. I think my view is rather clear, but I want to know how we can make it better. How can we share in fair and useful ways? Everyone is imperfect at this, but that shouldn’t stop us from striving for the best results we can achieve! Next time we’ll briefly mention an unplanned segment on open-notebooks, then get on to open-source software. Until then, keep collecting, documenting, and sharing. Please comment with your thoughts/opinions!
Sensors, Sensors Everywhere!

This year at the fall meeting of the American Geophysical Union, I presented an education abstract in addition to my normal science content. In this talk, I wanted to raise the awareness of how easy it is to work with electronics and collect geoscience relevant data. This post is here to provide anyone that was at the talk, or anyone interested, with the content, links, and resources!

Sensors and microcontrollers and coming down in price thanks to mass production and advances in process technology. This means that it is now incredibly cheap to collect both education and research grade data. Combine this with the emergence of the "Internet of Things" (IoT), and it makes an ideal setup for educators and scientists. To demonstrate this, we setup a small three-axis magnetometer to measure the Earth's magnetic field and connected it to the internet through data.sparkfun.com. I really think that involving students in the data collection process is important. Not only do they realize that instruments aren't black boxes, that errors are real, and that data is messy, but they become attached to the data. When a student collects the data themselves, they are much more likely to explore and be involved with it than if the instructor hands them a "pre-built" data set.

For more information, watch the 5-minute talk (screencast below) and checkout the links is the resources section. As always, email, comments, etc are welcome and encouraged!

Resources

Talk Relevant Links

- Slides from the talk
- This blog! I post lots of electronics/data/science projects throughout the year.
- Raspberry Pi In The Sky
- Kicksat Project
- Weather Underground PWS Network
- uRADMonitor
- Our IoT magnetometer data stream
- Python Notebooks
- GitHub repository for the 3D Compass demo
- AGU Pop-Up Session Blog

Parts Suppliers

- Adafruit
- Sparkfun
- Digikey
- Element14

Assorted Microcontrollers/Computers

- Beagle Bone
- Raspberry Pi
- Arduino
- Propeller
- MBed
- Edison
- MSP430
- Light Blue Bean

General

- Thingiverse 3D printing repository
- Maker blogs from places like Hackaday, MAKE, Adafruit, Sparkfun, etc

Getting Up and Running with a 3D Printer

I recently received some money to purchase a 3D printer to aid my laboratory experiments. I thought that it would be good to share how I decided on the printer that I did and how hard/easy it was to setup. Currently I've only run a few simple test prints, but will be printing some mounting equipment for laboratory experiments within a few weeks.

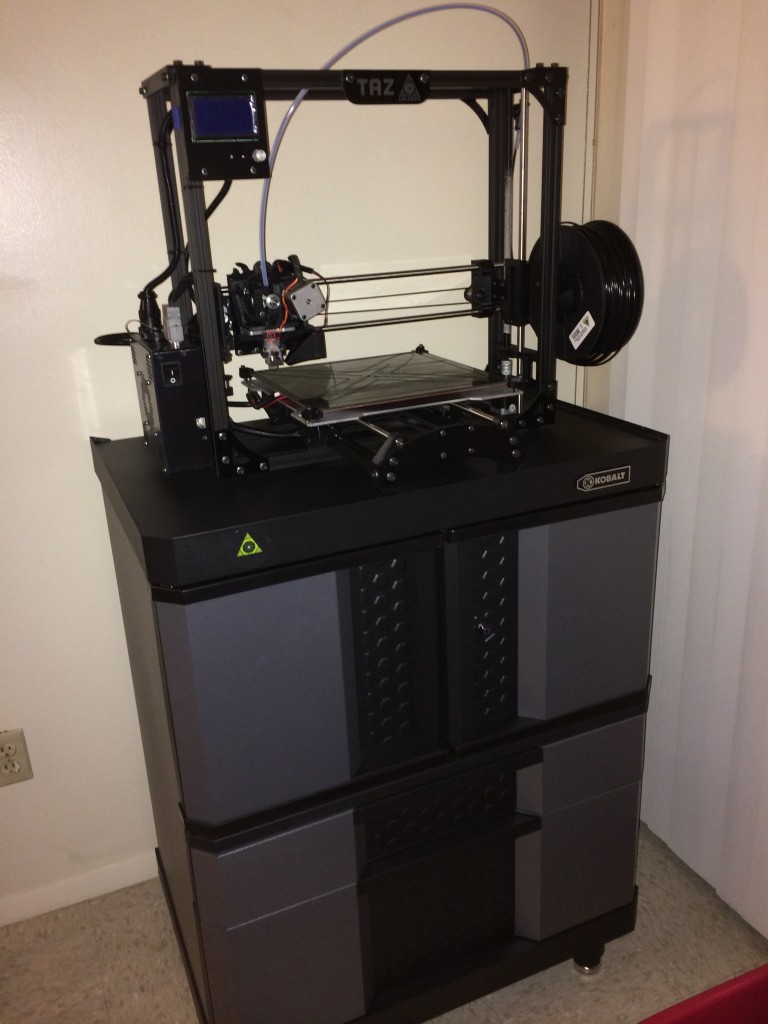
2014-08-16 05.08.30

Choosing a Printer

When choosing a printer, there are many factors to consider. The consumer 3D printer movement is still very young, so there are many different designs available that require different amounts of tinkering to work and have vastly different capabilities. To help decide, I made a few requirements and decision points :

1. I must be able to print something that is at least 8"x8"x8". Print area is an important consideration and is one of the biggest influences on cost. With this print size I can make most prototypes, brackets, etc that we need. Larger parts can always be printed in sections and joined, but it's not the strongest or easiest thing to do.
2. Print material and method. There are printers that can print in many types of plastic and even in wood. Some printers fuse plastic in layers in an "addictive manufacturing" process. Others can fuse a liquid into a plastic with a process referred to as stereo lithography. Most consumer level machines with a large print area are the type that extrude plastic. There is a large matrix of advantages and disadvantages, but we will just leave it at this for now.
3. The final factor I considered is the development of the machine. Informally this is the "tinker factor." How much are you willing to modify and experiment with the machine to get increased versatility vs. how much do you want a machine that is a push button that just works? I've always been the tinkering type but there is a balance. Some more experimental and low cost machines are not as reliable as I would prefer, but something that is fully developed like the MakerBot line doesn't leave as much versatility. The other portion is the licensing of the software and hardware. I've always been a proponent of the free and open source movement. It's how we are going to advance science and technology. Companies like MakerBot are not fully open source and that just doesn't sit well as it prevents the community from fixing problems in a piece of equipment that was rather expensive.

With all of those considerations and lots of research, I decided on the Taz 4 printer by Lulzbot. You can purchase the printer from Amazon, but I decided to purchase through Sparkfun Electronics since they are a small(ish) business that really supports education and the maker movement. I ordered the printer within a few hours of passing my comprehensive exams and it was on the way!

Setting up the printer

I received the printer and followed all of the setup instructions. This involved assembling the axes and removing the packing protection. I've never done this before, but overall it was very straightforward and took about 45 minutes. The next steps were what made me nervous.

To get quality prints the printer surface must be level with relation to the print head track. There are various end stops and leveling screws to adjust. Using a piece of printer paper as a gap gauge, I just followed the instructions and had the print bed leveled in about 20 minutes. There is also a test print pattern that prints two layers of plastic around the base plate to let you make sure the level is right on. Everything must be kept clean and adjusted as with any precision bit of gear, but overall I was impressed with the design.

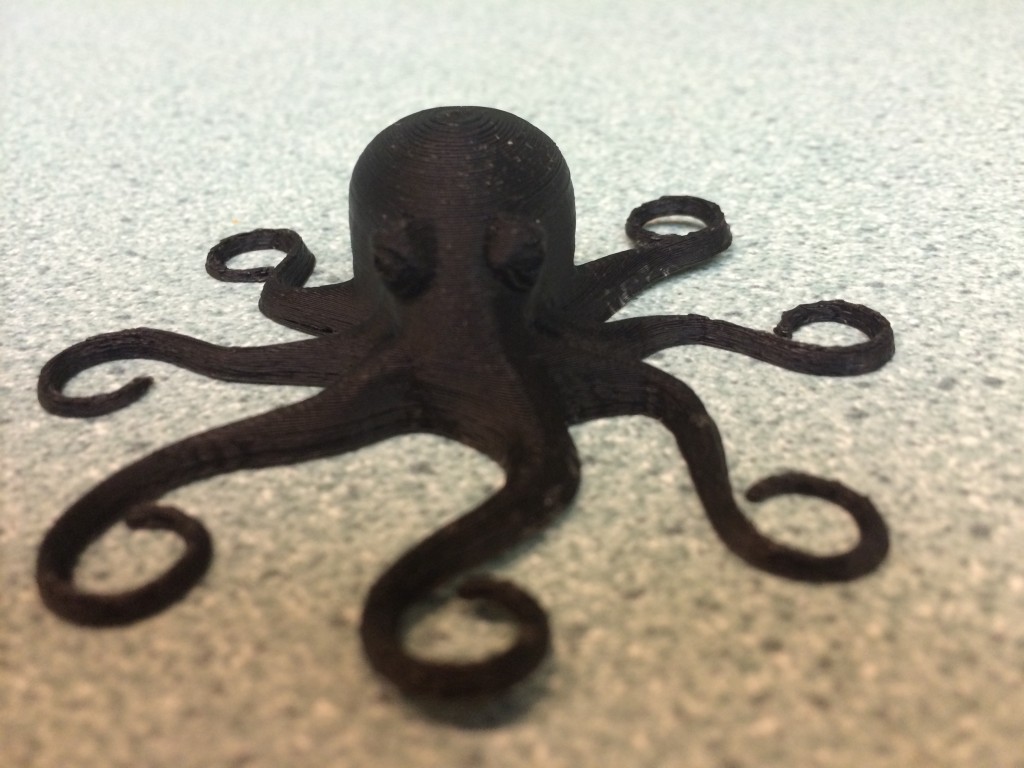
The printer ships with an octopus test print that was my first object. I loaded up the file and hit print. The printer ran for about an hour and at the end I had the print shown below!

2014-08-14 22.01.49

What's Next

I've got some plans for what to print next. Currently I'm designing some new brackets to hold sensors in place during experiments and a few new parts like shields and pulleys to improve the quality of some of our demonstration apparatuses in the lab. I'm sure some of the results will end up as their own blog posts, but you can always see what's new by following me on Twitter (@geo_leeman). I also would like to thank Hess energy and Shell energy for their support of various aspects of these projects and of course the National Science Foundation for supporting me and many aspects of my lab research. Everything I've said is of course my own opinion and does not reflect the views of any of those funding organizations. Next post we will likely return to more general topics like seeing trends in data or go back and look at more Doppler radar experiments.

Update!

I was able to print my first laboratory parts, a set of brackets to make a magnetic holder for a displacement transducer.  I will be posting the cad files to my github account under an open license.

10347538_10152638131370731_7763062347780746327_n

Mythbusting: Cooling a Drink with a Wet Paper Towel

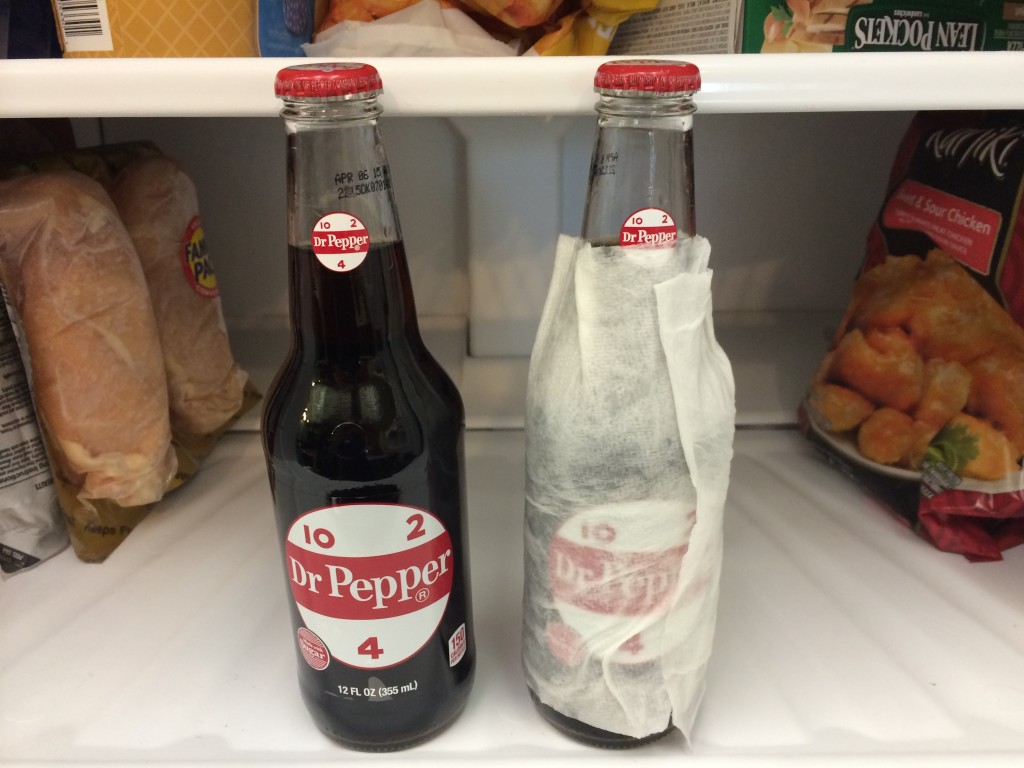
While reading one of the many pages claiming to have "15 Amazing Life Hacks" or something similar, I found a claim about quickly cooling a drink that deserved some investigation.  The post claimed that to quickly cool your favorite drink you should wrap the bottle/can in a wet paper towel and put it in the freezer.  Supposedly this would quickly cool the drink, faster than just the freezer.  My guess is that the thought process says evaporative cooling is the culprit.  This is why we sweat, evaporating water does indeed cool the surface.  Would water evaporate into the cold, but dry freezer air? Below we'll look at a couple of experiments and decide if this idea works!

We will attack this problem with two approaches.  First I'll use two identical pint glasses filled with water and some temperature sensors, then we'll actually put glass bottles in and measure just the end result.  While the myth concerns bottles, I want to be able to monitor the temperature during the cooling cycle without opening the bottles.  For that we'll use the pint glasses.  

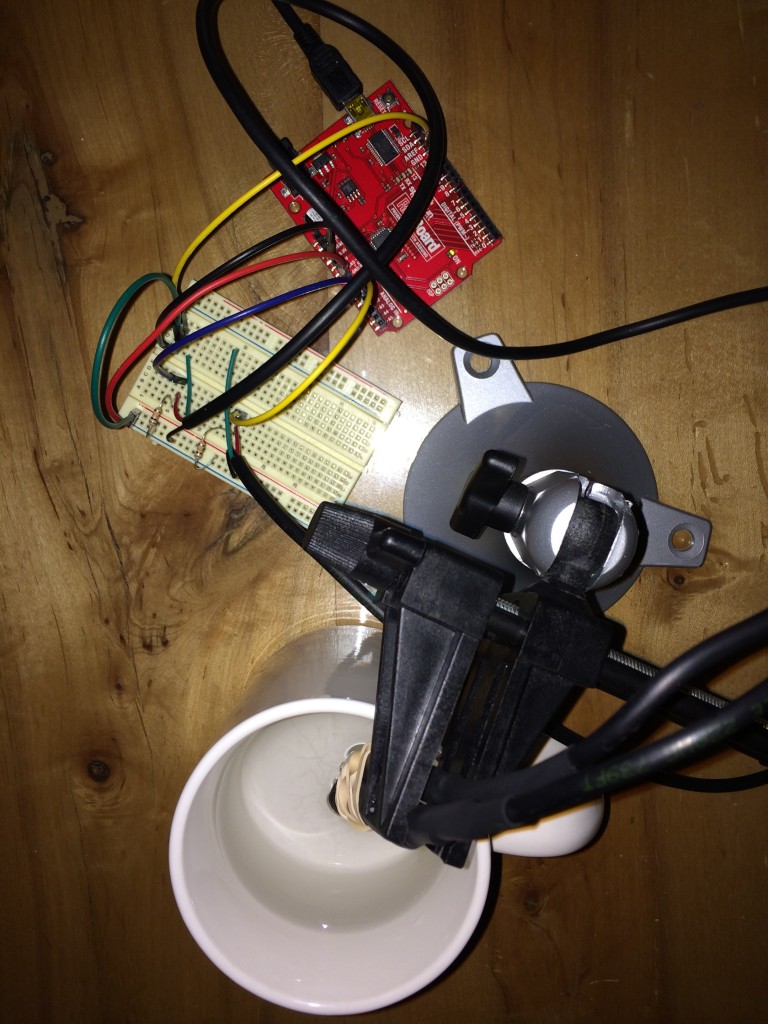
First I had to build the temperature sensors.  The sensors are thermistors from DigiKey since they are cheap and relatively accurate as well.  To make them fluid safe, I attached some three-lead wire and encapsulated the connections with hot-glue.  The entire assembly was then sealed up with heat-shrink tubing.  I modified code from an Adafruit tutorial on thermistors and calibrated the setup.  

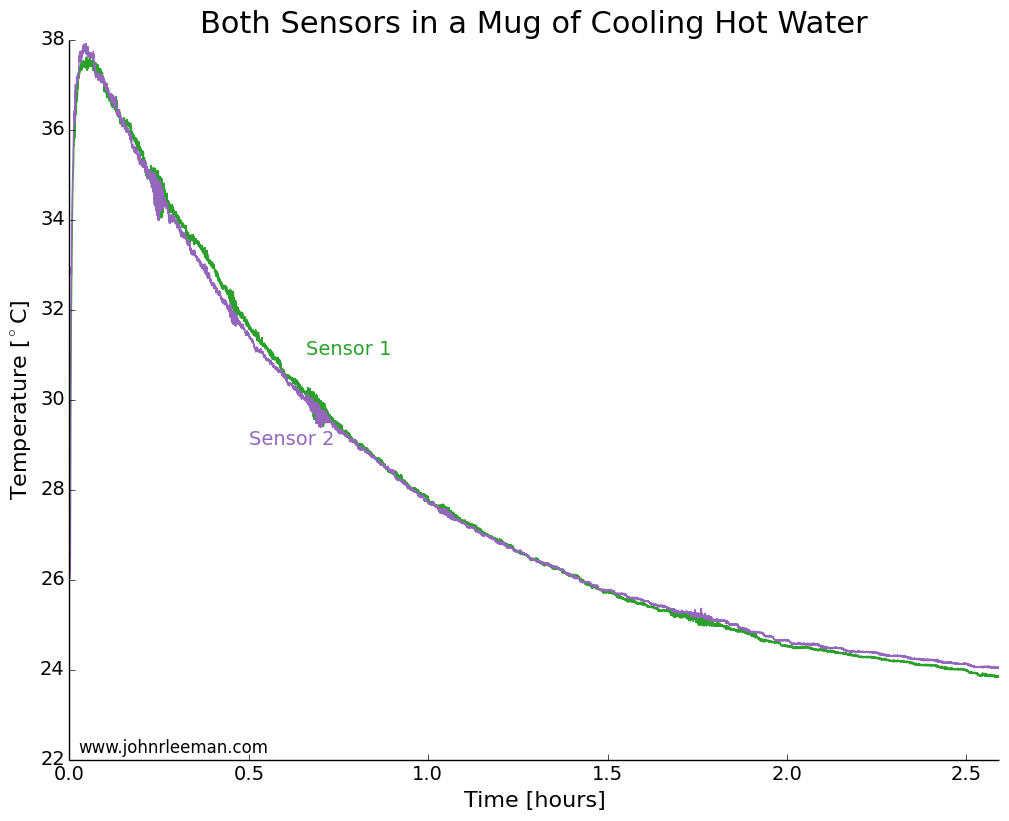
To make sure that both sensors had a similar response time, we need to do a simple control test.  I placed both probes in a mug of hot water right beside each other.  We would expect to see the same cooling at points so close together, so any offset between the two should be constant.  We also expect the cooling to follow a logarithmic pattern.  This is because the rate of heat transfer is proportion to the temperature difference between the water and the environment (totally ignoring the mug and any radiative/convective transfer).  So when the water is much hotter than the air, it will cool quickly, but when it's only slightly hotter than the air it will take much longer to cool the same amount.  

Mug Cooling Photo

Plotting the data, we see exactly the expected result.  Both sensors quickly rise to the water temperature, then the water cools over a couple of hours.  The noisy segments of data about 0.25 hrs, 0.75 hrs, and 1.75 hrs in are likely interference from the building air conditioning system.  

CoolingWater_AbsoluteTemps

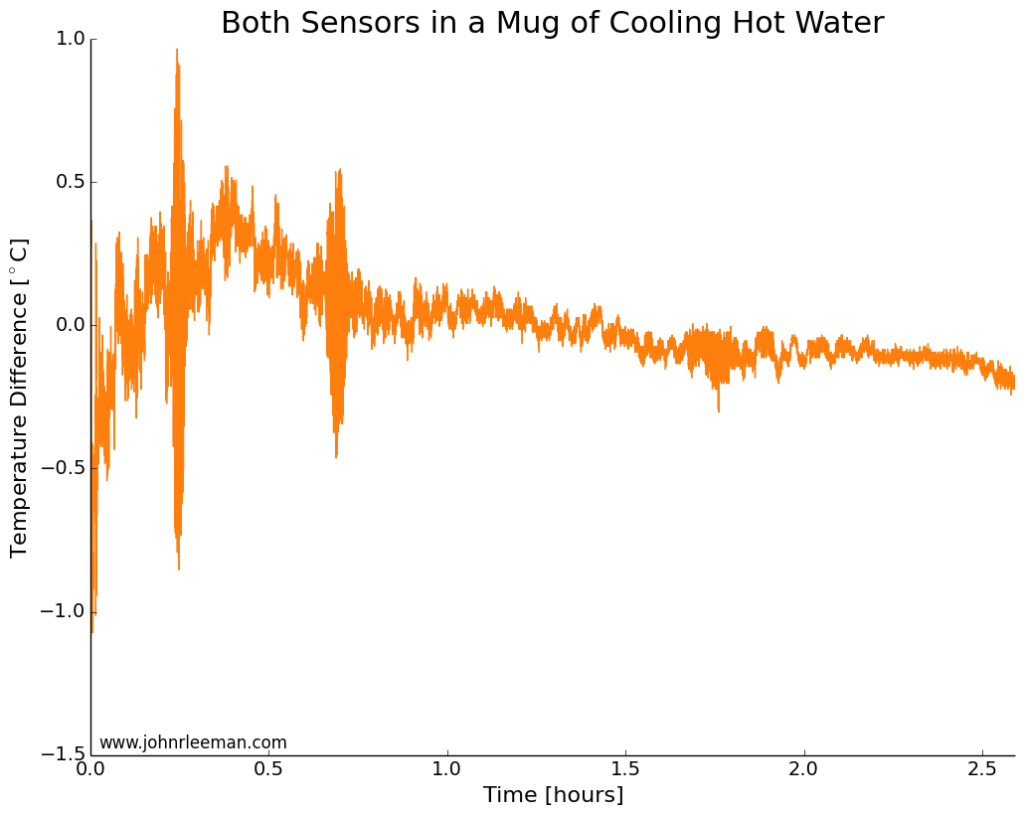
If we plot the temperature difference between the sensors it should be constant since they are sensing the same thing.  These probes look to be about dead on after calibration.  Other than the noisy segment of data, they are always within 0.5 degrees of each other.  Now we can move on to the freezer test.

CoolingWater_TempDifference

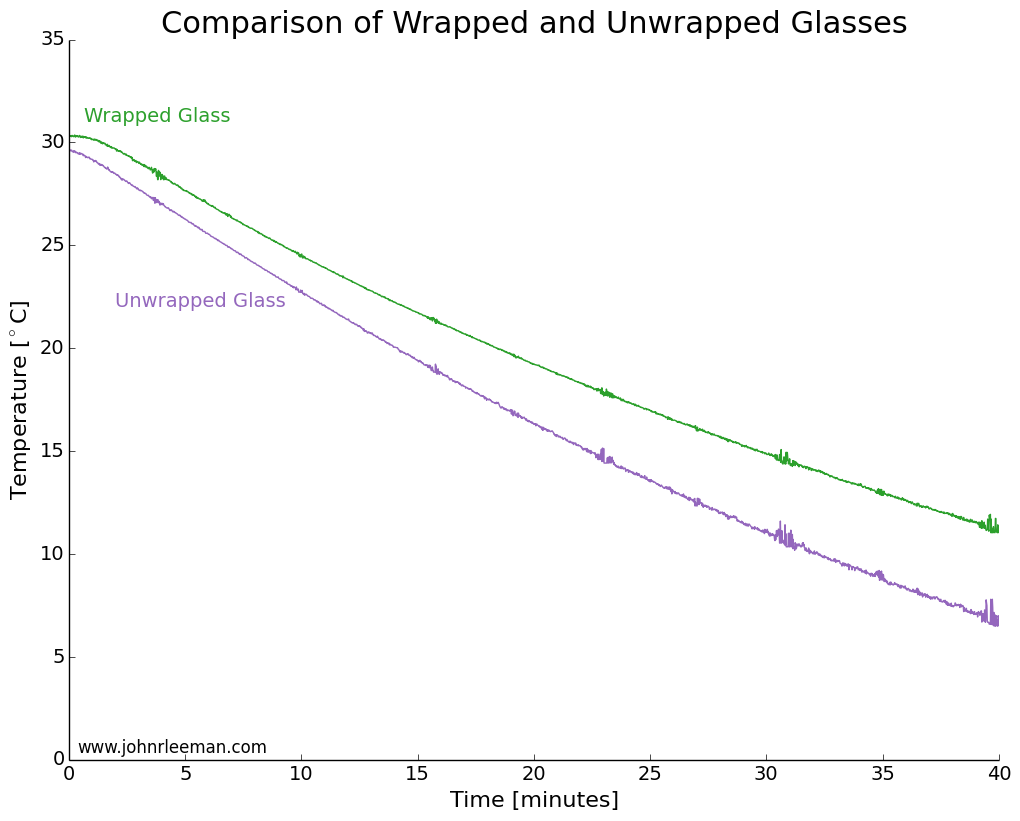
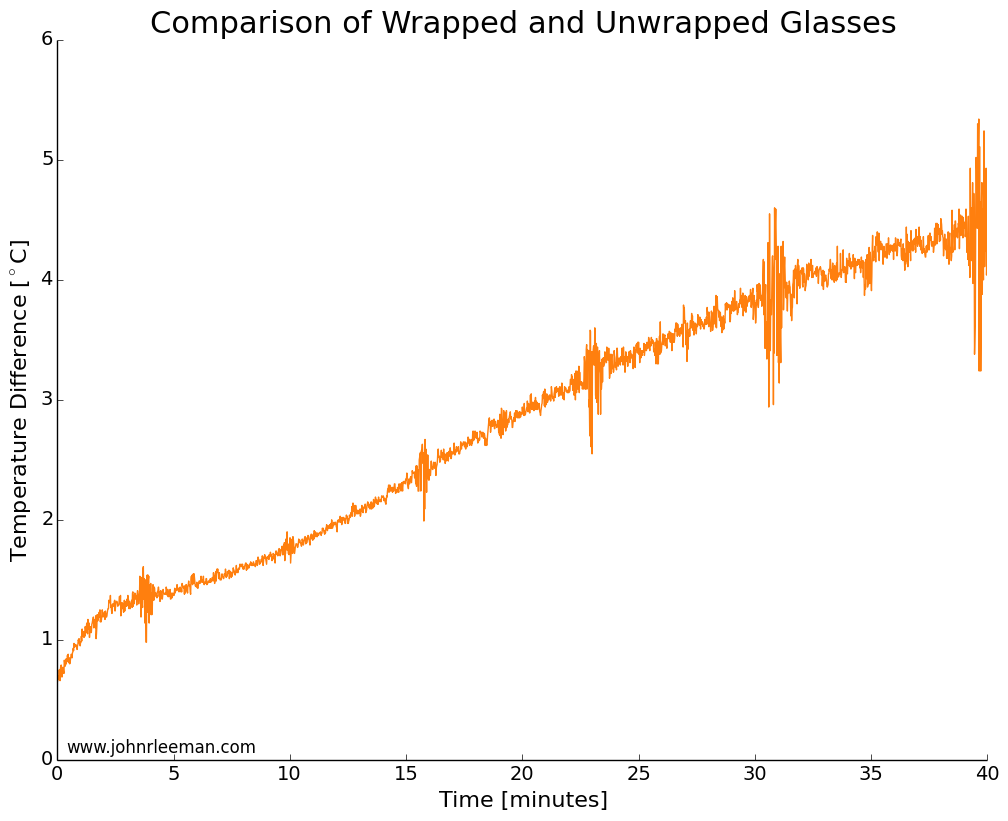
I used two identical pint glasses and made thermocouple supports with cardboard.  One glass was wrapped in tap water damped paper towel, the other left as a control.  Both were inserted into the freezer at the same time and the temperature monitored.  The water was initially the same temperature, but the readings quickly diverged.  The noisy data segments reappear at fixed intervals suggesting that the freezer was turning on and off.  The temperature difference between the sensors grew very quickly, meaning that the wrapped glass was cooling more slowly than the unwrapped glass.  This is the opposite of the myth! 

FreezingWater_AbsoluteTemps


FreezingWater_TempDifference

Next I placed two identical, room temperature bottles of soda in the freezer, again with one wrapped and one as a control.  After 30 minutes in the freezer, the results showed that the bottles and their contents were practically identical in temperature.  The wrapped bottle was slightly warmer, but it was within the resolution of the instruments (thermocouple and IR sensor).  I did this test multiple times and always got temperatures within 1 degree of each other, but not consistently favoring one bottle.

So what's happening here? Well, I think that the damp paper towel is actually acting as a jacket for the beverage.  Much like covering yourself when it's cold outside, the damp paper towel must be cooled, then the beverage can cool.  Adding that extra thermal mass and extra layer for the heat to diffuse through.  To provide another test of that hypothesis I again tested bottles with a control and a foam drink cooler around the base.  The foam cooler did indeed slow the cooling, the bottle being several degrees warmer than the control.

2014-08-13 17.56.28

The last question is why did the test with the glasses show such a pronounced difference, but the bottle test show no difference? My best guess is that the pint glass was totally wrapped vertically and that bottle had the neck exposed still.  Another difference could be the thickness of the towel layer and the water content of the towels.  

The Conclusion: BUSTED! Depending on how you wrap the paper towel it will either have no effect or slow down the cooling of your favorite drink.  

Let me know any other myths I should test! You can also keep up to date with projects and future posts by following me on twitter (@geo_leeman).

Arduino Code:

// which analog pin to connect
#define THERMISTOR1PIN A0
#define THERMISTOR2PIN A1
// resistance at 25 degrees C
#define THERMISTORNOMINAL 10000
// temp. for nominal resistance (almost always 25 C)
#define TEMPERATURENOMINAL 25
// how many samples to take and average, more takes longer
// but is more 'smooth'
#define NUMSAMPLES 15
// The beta coefficient of the thermistor (usually 3000-4000)
#define BCOEFFICIENT 3950
// the value of the 'other' resistor
#define SERIESRESISTOR1 9760
#define SERIESRESISTOR2 9790

int samples1[NUMSAMPLES];
int samples2[NUMSAMPLES];

void setup(void) {
Serial.begin(9600);
analogReference(EXTERNAL);
}

void loop(void) {
uint8_t i;
float average1;
float average2;

// take N samples in a row, with a slight delay
for (i=0; i< NUMSAMPLES; i++) {
samples1[i] = analogRead(THERMISTOR1PIN);
samples2[i] = analogRead(THERMISTOR2PIN);
delay(10);
}

// average all the samples out
average1 = 0;
average2 = 0;
for (i=0; i< NUMSAMPLES; i++) {
average1 += samples1[i];
average2 += samples2[i];
}
average1 /= NUMSAMPLES;
average2 /= NUMSAMPLES;

//Serial.print("Average analog reading ");
//Serial.println(average);

// convert the value to resistance
average1 = 1023 / average1 - 1;
average1 = SERIESRESISTOR1 / average1;

average2 = 1023 / average2 - 1;
average2 = SERIESRESISTOR2 / average2;
//Serial.print("Thermistor resistance ");
Serial.print(average1);
Serial.print(',');
Serial.print(average2);
Serial.print(',');

float steinhart;
steinhart = average1 / THERMISTORNOMINAL; // (R/Ro)
steinhart = log(steinhart); // ln(R/Ro)
steinhart /= BCOEFFICIENT; // 1/B * ln(R/Ro)
steinhart += 1.0 / (TEMPERATURENOMINAL + 273.15); // + (1/To)
steinhart = 1.0 / steinhart; // Invert
steinhart -= 273.15; // convert to C

Serial.print(steinhart);
Serial.print(',');

steinhart = average2 / THERMISTORNOMINAL; // (R/Ro)
steinhart = log(steinhart); // ln(R/Ro)
steinhart /= BCOEFFICIENT; // 1/B * ln(R/Ro)
steinhart += 1.0 / (TEMPERATURENOMINAL + 273.15); // + (1/To)
steinhart = 1.0 / steinhart; // Invert
steinhart -= 273.15; // convert to C(steinhart);

Serial.println(steinhart);
//Serial.println(" *C");

delay(1000);
}

Exploring Scientific Computing at SciPy 2014

Texas Campus

This past week I've been in Austin, TX attending SciPy 2014, the scientific Python conference.  I came in 2010 for the first time, but hadn't been able to make it back again until this year.  I love this conference because it gives me the chance to step away from work on my PhD and distractions of hobby projections to focus on keeping up with the world of scientific computing with Python.  I try to walk the fine line between being a researcher, engineer, and programmer everyday.  That means that it is easy to fall behind the state of the art in any one of those, and conferences like this are my way to getting a chance to learn from the best.

SciPy consists of tutorials, the conference, and sprints:

The first two days were tutorials in which I got to learn about using interactive widgets in iPython notebooks, reproducible science, image processing, and Bayesian analysis.  I see lots of things that I can apply in my research and teaching workflows!  Interactive notebooks are one of the last things that I was wishing for from the Mathematica notebooks.

The next three days were talks in which we got to see the newest software developments and creative applications of Python to scientific problems.  I, of course, gravitated to the geophysics oriented talks and even ran into some people with common connections.  It was during the conference that I gave my poster presentation.  I knew that the poster focused more on the application of Python to earthquake science than any earth-shaking (pun-intended) software development.  There were a few on the software side that wondered why I was there (as expected), but the poster was generally very well received.  Again I had several chance encounters with people from Google and other companies that had similar backgrounds or were just very interested in earthquakes!

The final two days (I'm writing this on the last day) were sprints.  These are large pushes to further develop the software while a critical mass of experts are in one location.  I'm still new enough to these massive open-source projections (on the development side at least) that I wasn't incredibly useful, but the reception of the developers was great!  Everyone was excited if you wanted to help and would spend as much time as needed to get you up and running.  During the sprints I've been following a fix for an issue that has recently caused problems in my plotting.  I also fixed a tiny issue (with help) and had my first pull request accepted.  For software people these are tiny steps, but for someone coming from just developing in-house purpose-designed tools.... it was an hit of the open-source collaboration drug.

Lastly, I worked on a project of my own during the evenings.  During the 2010 conference I worked with a friend to make a filter remove the annoying vuvuzela sound from the World Cup audio.  This year I've been making a fun earthquake visualization tool.  You'll be seeing it here on the blog, and may have already seen it if you follow me on twitter.  I learned a lot during this year's SciPy 2014, got to spend time with other alums of OU Meteorology, and meet some new folks.  Next on the blog we'll be back to some radar or maybe a quick earthquake discussion!