I've been working on developing some geophysical instruments that will need some significant temperature compensation. Often times when you buy a sensor there is some temperature dependance (if not humidity, pressure, and a slew of other variables). The manufacturer will generally quote a compensation figure. Say we are measuring voltage with an analog-to-digital converter (ADC); the temperature dependance may be quoted as some number of volts per degree of temperature change over a certain range of voltages and temperatures. Generally this is a linear correction. Most of the time that is good enough, but for scientific applications we sometimes need to squeeze out every error we can and compare instruments. Maybe one sensor is sightly more temperature dependent than another; comparing the sensors could then lead us to some false conclusions. This means that sometimes we need to calibrate every sensor we are going to use. In the lab I work in, we calibrate all of our transducers every 6 months by using transfer standards. (Standards, transfer of standards, and calibration theory are a whole series of posts in themselves.)
To do thermal calibrations it is common to put the instruments into a thermal chamber in which we can vary the temperature over a wide range of conditions while keeping the physical variable we are measuring (voltage, pressure, load, etc) constant. Then we know any change in the reading is due to thermal effects on the system. If we are measuring something like tilt or displacement, we have to be sure that we are calibrating the electronics, not signals from thermal expansion of metals and materials that make up our testing jig.
I scoured EBay and the surplus store at our University, but only found very large and expensive units. I remembered that several years ago Dave Jones over at the EEVBlog had mentioned a cheap alternative made from a peltier device wine cooler. I dug up his video (below) and went to the web again in search of the device.
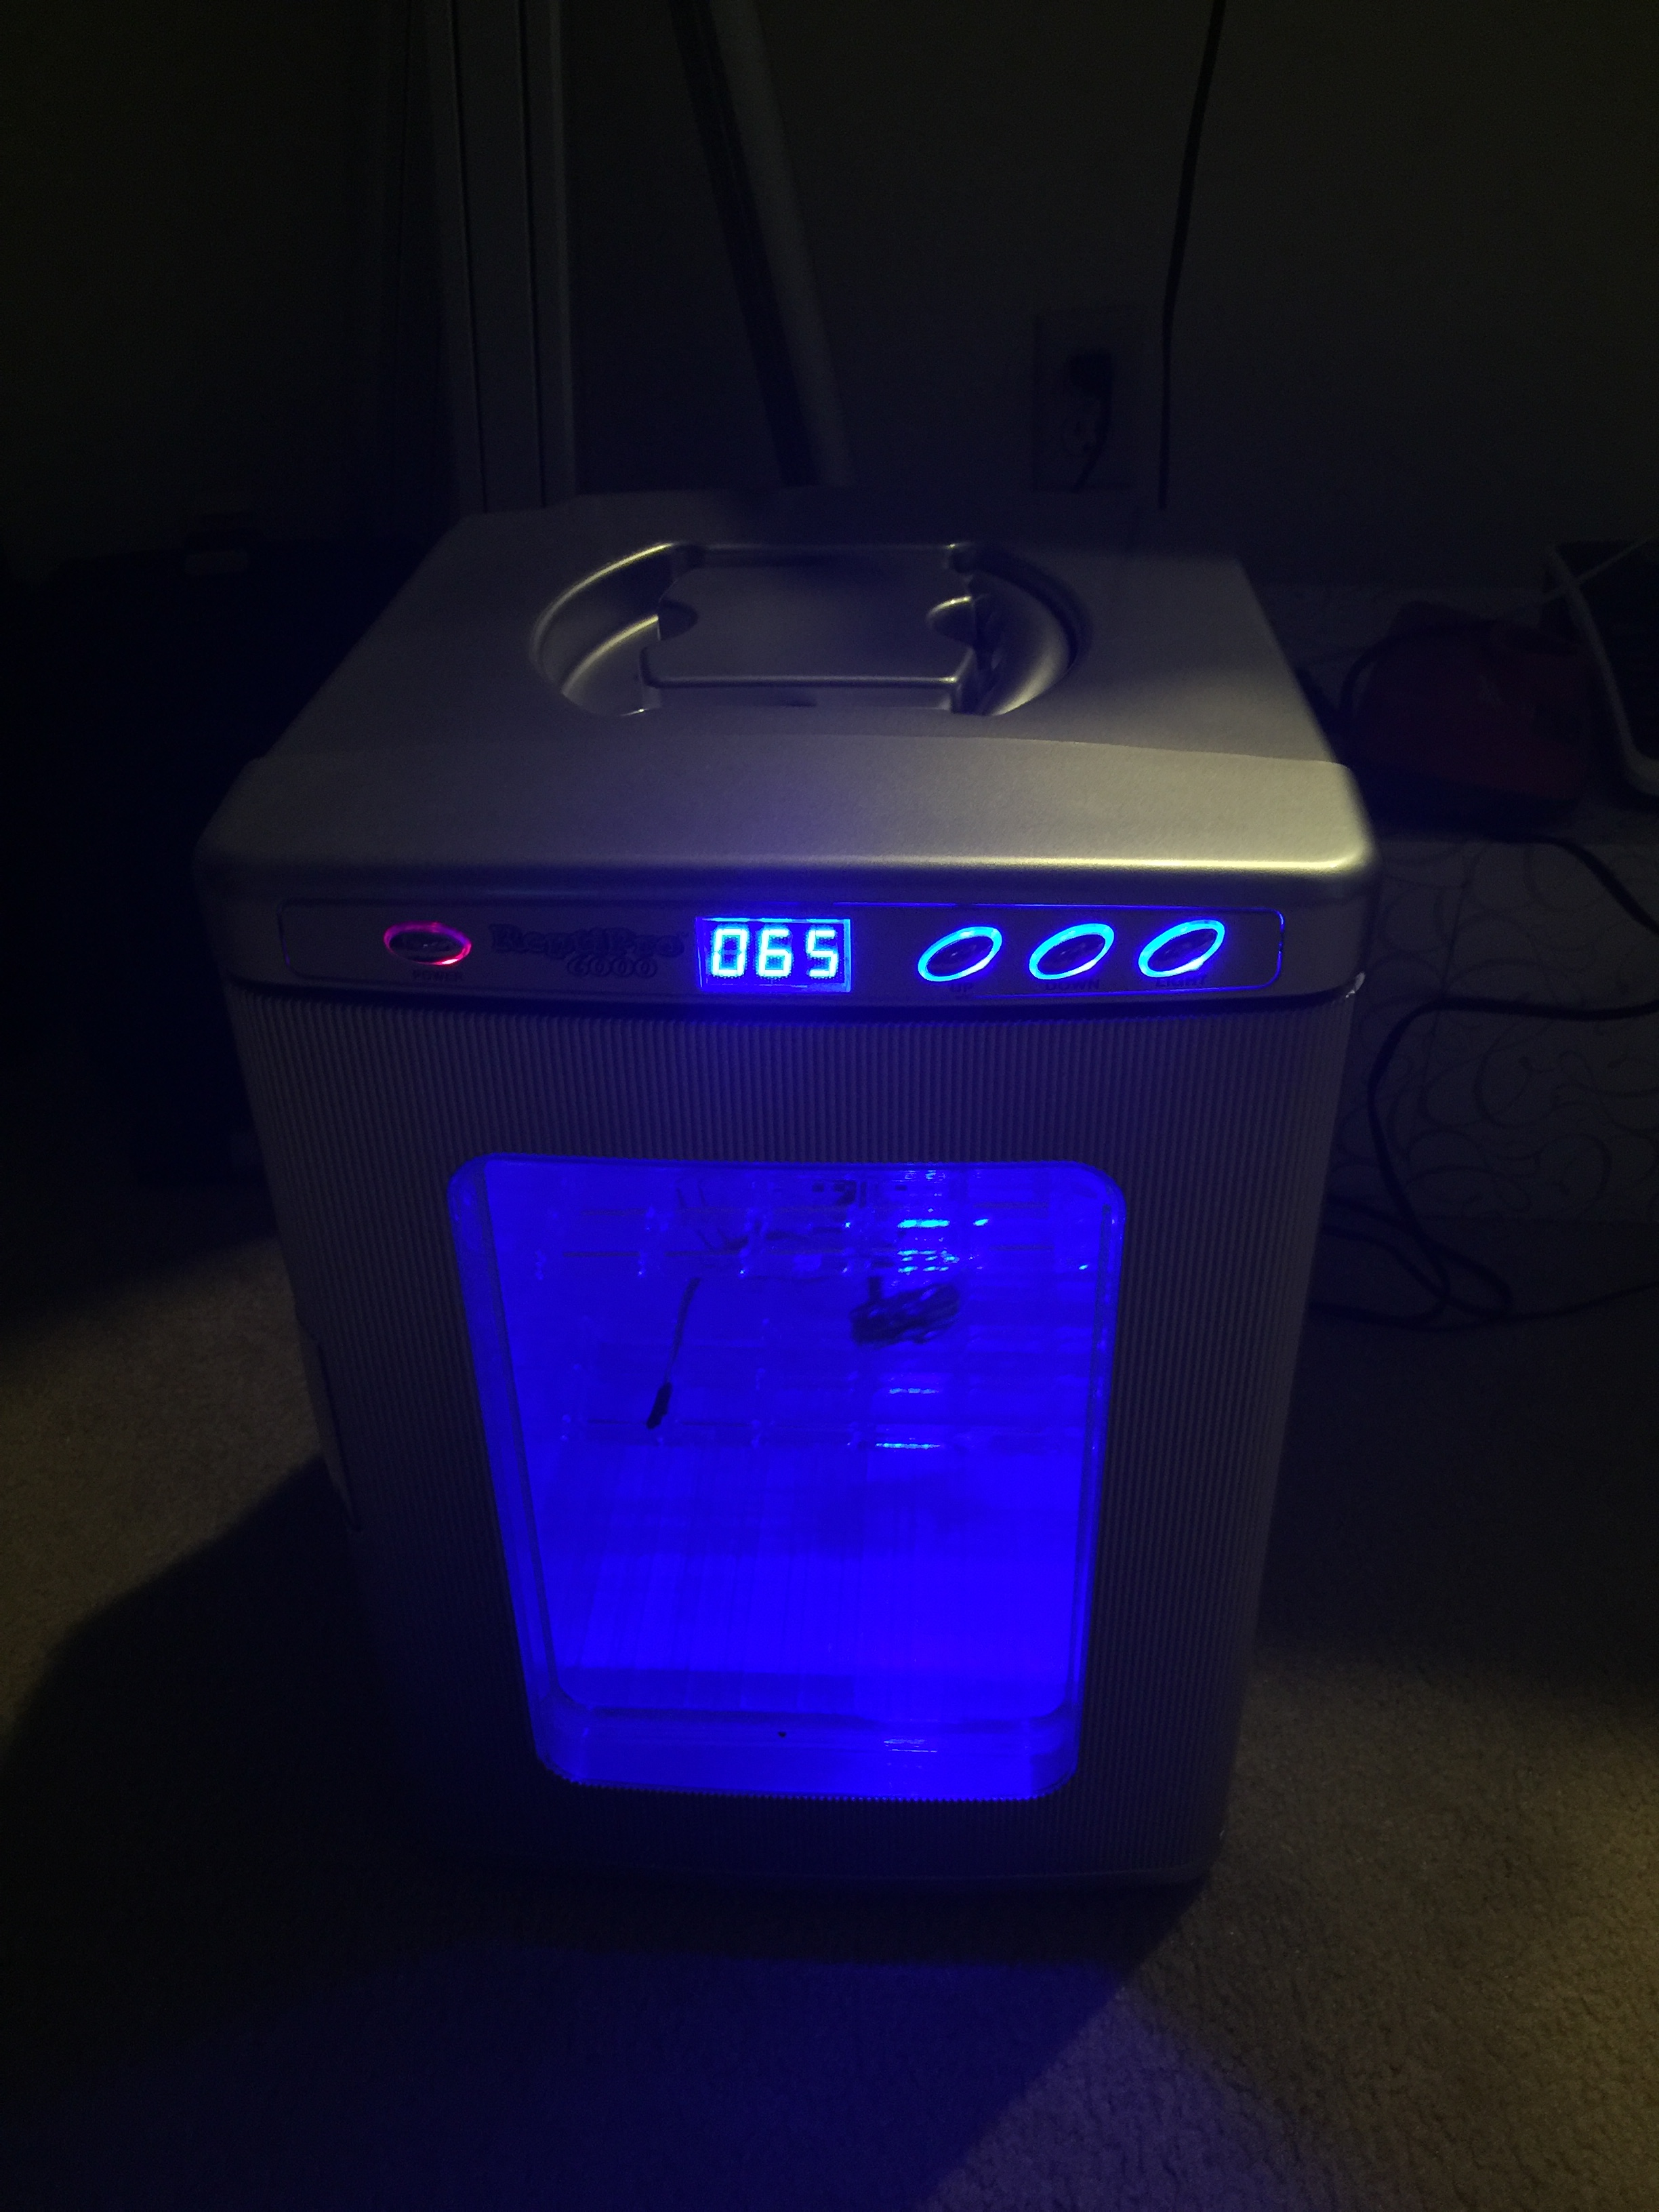
I found the chamber marketed as a reptile egg incubator on Amazon. The reviews were not great, some saying the unit was off by several degrees or did not maintain the +/- 1 degree temperature as marketed. I decided to give it a shot since it was the only affordable alternative and if it didn't work, maybe I could hack it with a new control system and use the box/peltier element with my own system. In this post I'm going to show you the stock performance of the chamber and some initial tests to figure out if it will do the job.
As soon as it arrived I setup the unit and put an environmental sensor in (my WxBackpack for the Light Blue Bean used back in the drone post) inside. I wanted to see if it was even close to the temperature displayed on the front and how good the control was with no thermal load inside. There was a small data drop-out causing a kink early in the record (around 30 C). It looks like the temperature is right on what I had set it to with the quoted +/- 1 degree range. There is some stabilization time and the mean isn't the same as the set point, but that makes sense to me, you don't want to overheat eggs! This looks encouraging overall. I also noticed that the LED light inside the chamber flickered wildly when the peltier device was drawing a lot of power heating/cooling the system. I then opened the door and set the unit to cool. After reaching room temperature, I closed the door and went to bed. It certainly isn't fast, but I was able to get down to about 2C with no thermal load. That was good enough for me. Time to add a cable port, checkout the LED issue, and test with some water jars for more thermal mass.
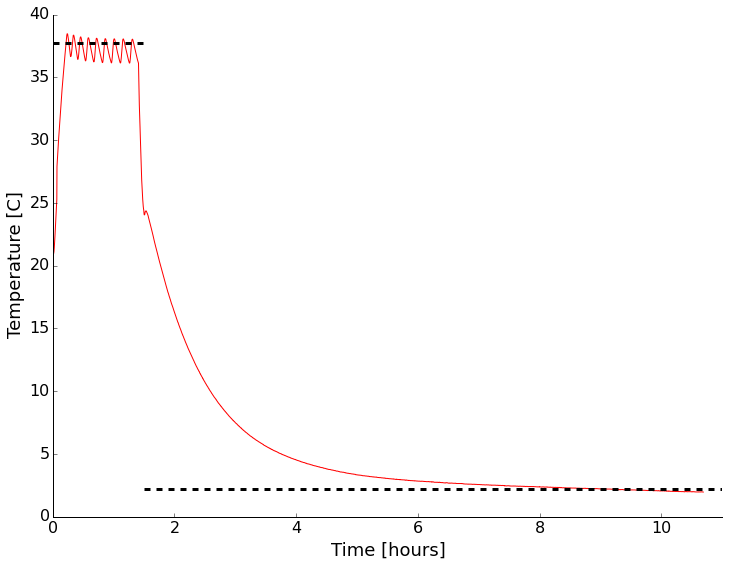
Initial test of the thermal chamber with nothing inside except a temperature logger. Set point shown by dashed line.
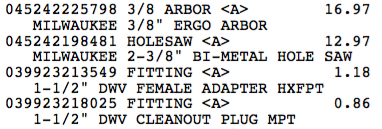
The next step was to add a cable port to be able to get test cables in and out. I decided to follow what Dave did and add a 1.5" test port with a PVC fitting, a hole saw, and some silicone sealant. Below are a few pictures of drilling and inserting the fitting. I used Home Depot parts (listing below). I didn't have the correct size hole-saw. That's happened a lot lately, so I invested in the Milwaukee interchangeable system. I got a threaded fitting so I can put a plug in if needed. the time honored tradition is to put your cables through the port and stuff a rag in though. This works as well as a plug generally, but it's nice to have the option.
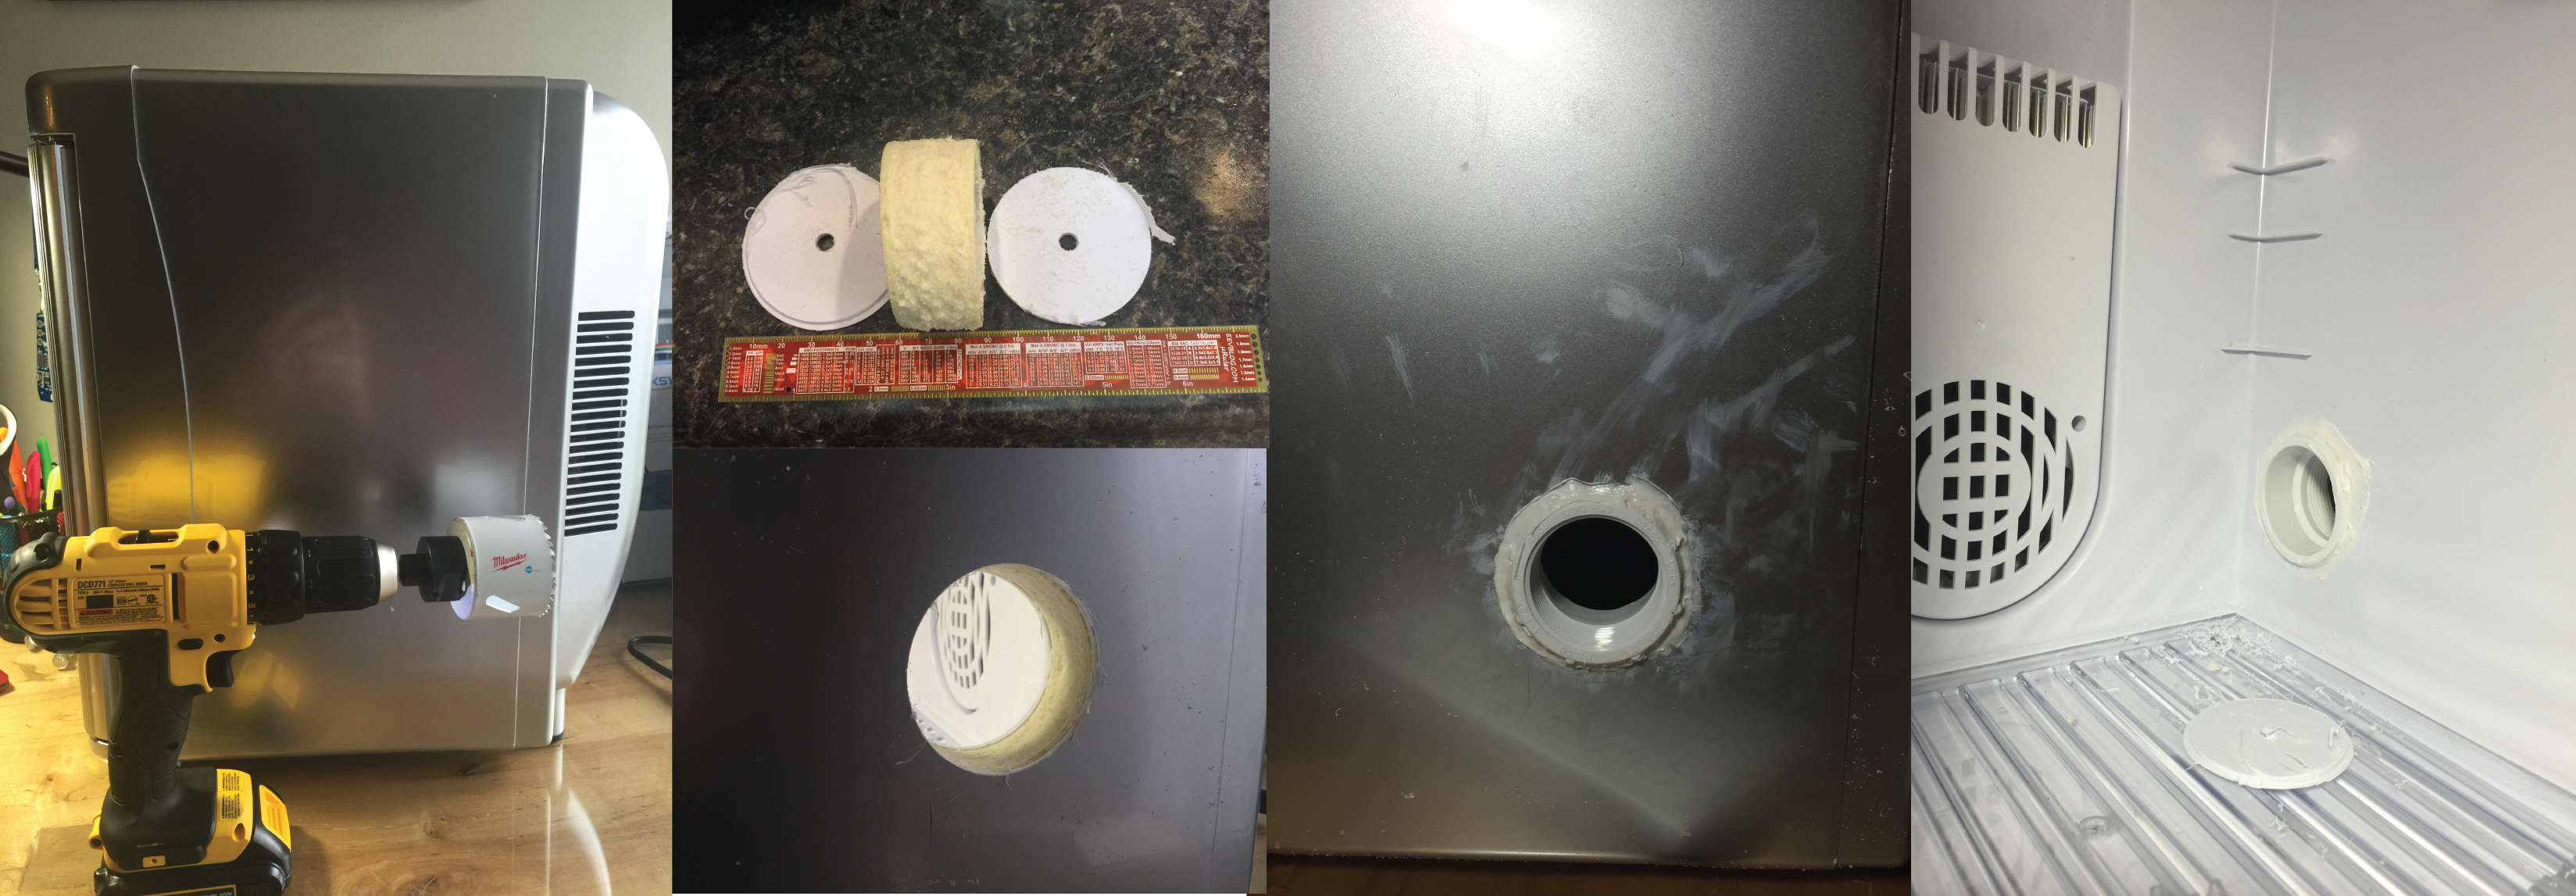
Before, during, and after cable port placement. The center of the hole is 7 3/8" back from the front door seal, and 5 1/8" up from table top level. I used gel super glue to quickly fix the fitting to the plastic layers and foam. After that dried, I used silicone bath adhesive/sealant to seal the inside and outside. The edge of a junk-mail credit card offer made smoothing the silicone easier.
While working inside the chamber I pulled out the LED board and noticed a dodgy looking solder joint. I reflowed it. I also pulled the back off the unit to make sure there were no dangerous connections or anything that looked poor quality. Nothing jumped out.
I put the whole thing back together and put a sensor in to monitor the environment and tested again. This time I tried a few different set points with and without containers of water inside the chamber. First with nothing but the sensor setup inside:
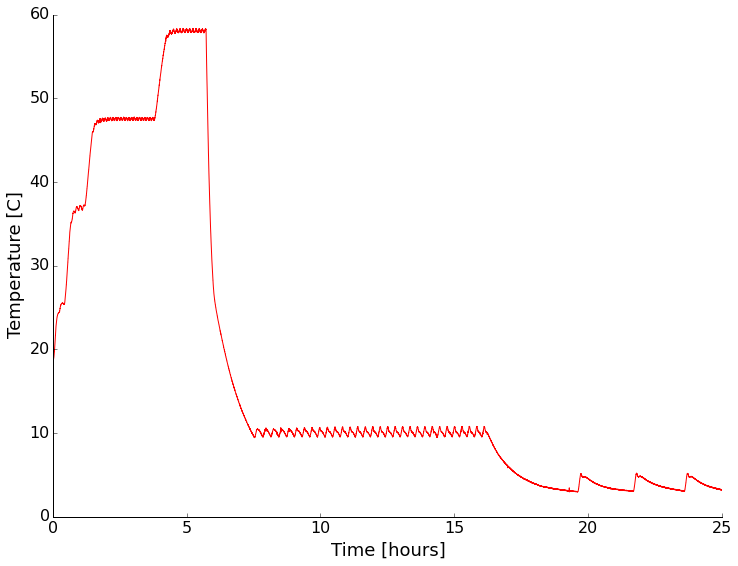
For both heating and cooling the performance under no thermal load (other than the sensor electronics) was pretty good. Cooling is rather slow and more poorly controlled than heating though.
Next I put sealed containers of water on the shelves of the chamber to add some thermal mass and see if that changed the characteristics of the chamber any. It did slow the temperature change as expected, but appears to have had little other effect (I didn't wait long enough for stabilization on some settings).
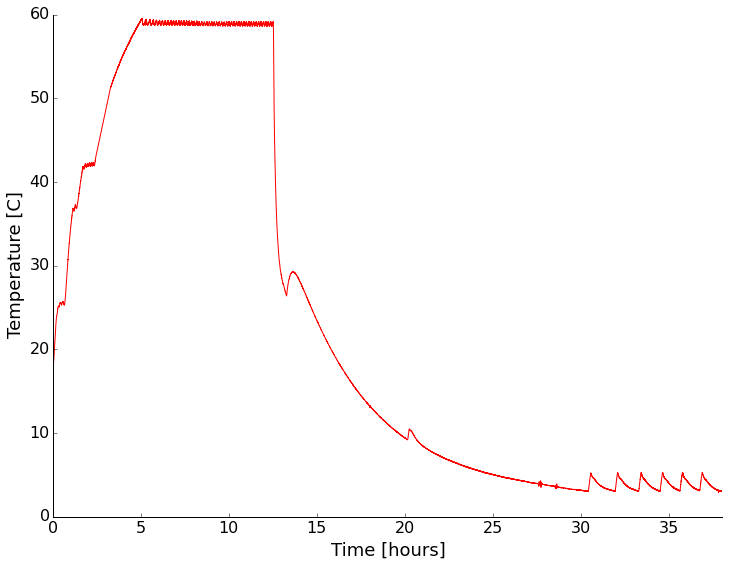
With a water load the chamber had similar performance, but was slower in getting to temperature as expected.
It looks like at temperatures above ambient the chamber has a stability of +/- 1 degree. Below ambient it becomes a couple of degrees. The absolute reading drifts a bit too. Setting the chamber to a given reading always resulted in stabilization within about a degree of the setting though.
I think this will be a nice addition to my home lab. While the unit isn't incredibly accurate, I will be recording the device temperature anyway, so that works for me. It'd be nice to cool down more quickly though, so I may facilitate that with some dry ice. Stay tuned as I'll be testing instruments in there sometime in the next month or so.
P.S. - The LED light still flickers in a way that indicates unstable power/connection. Not a deal breaker for me since I don't really need the light, but something to remember.