Awhile back I was listening to Episode 101 of The Productivity Show in which Paul Akers of FastCap was being interviewed about lean. Lean is one of those buzz words that gets thrown around without much thought, but he explained it in a simple way that the marketers would never approve of and some would argue is just common sense. Paul said lean means that you should "fix what bugs you". While many of us do that already, I've tried to keep that mantra going as I've been working on projects or just going through daily life. That coffee container that I hated dealing with every morning because it was slow? Gone and replaced with a fast open/close sealed container. That one annoying error message on my laptop I've been closing out every time I boot up for the last year? 15 minutes with google and I'll never click it again. These are all little examples of realizing that something was, and had been, annoying me and stopping what I was doing to fix it. Paul talks about this idea some in a video (below), but I wanted to share an example of a recent thing that bugged me and I fixed with about an hour's worth of effort.
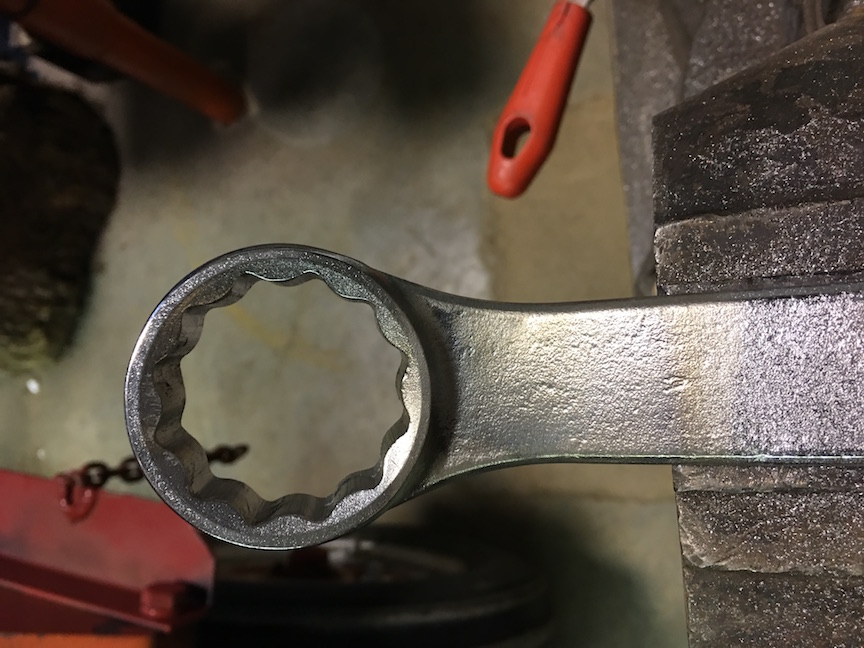
When I'm using tools, I want to be efficient. I want to have the right tool for the right job and do the job well. Recently I was using a lathe to make some parts and noticed that they had been using a large crescent wrench to adjust the tool post on the machine. The wrench was about 2 feet long and was heavy. Not only that, it encouraged over tightening of the nut with its excess mechanical advantage. Every time I changed the tool post, I pulled out the big wrench and carefully adjusted things. This got old very quickly.
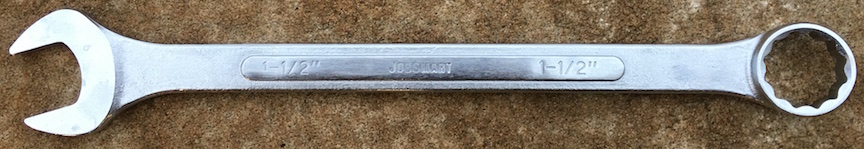
I stopped into Tractor Supply Company and bought a 1.5" combination wrench for $15. I took the wrench back to the shop and put it on the adjustment nut. It was still a bit long and interfered with the lever on the tool post lock, so I still wasn't very happy. For $15, I decided it was time to fix this problem once and for all.
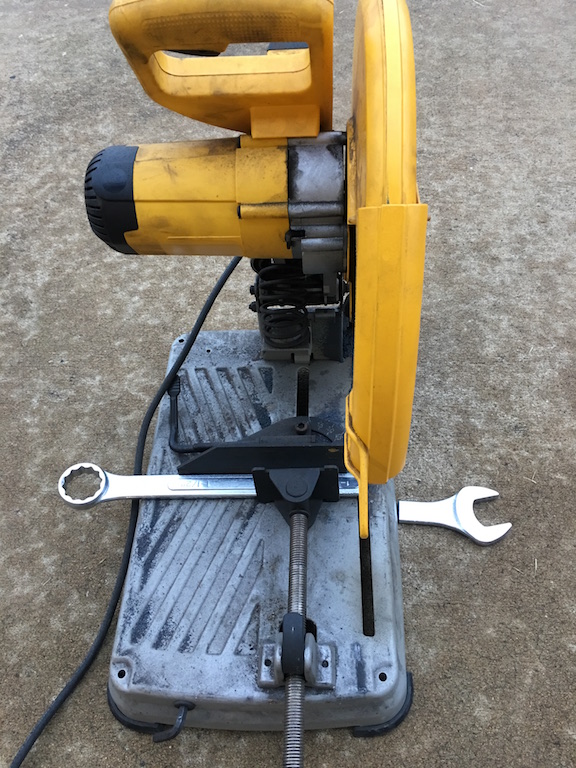
First I got out the chop saw and sawed off the open end that I didn't need. This took just a few seconds and already had the handle at a more suitable length.
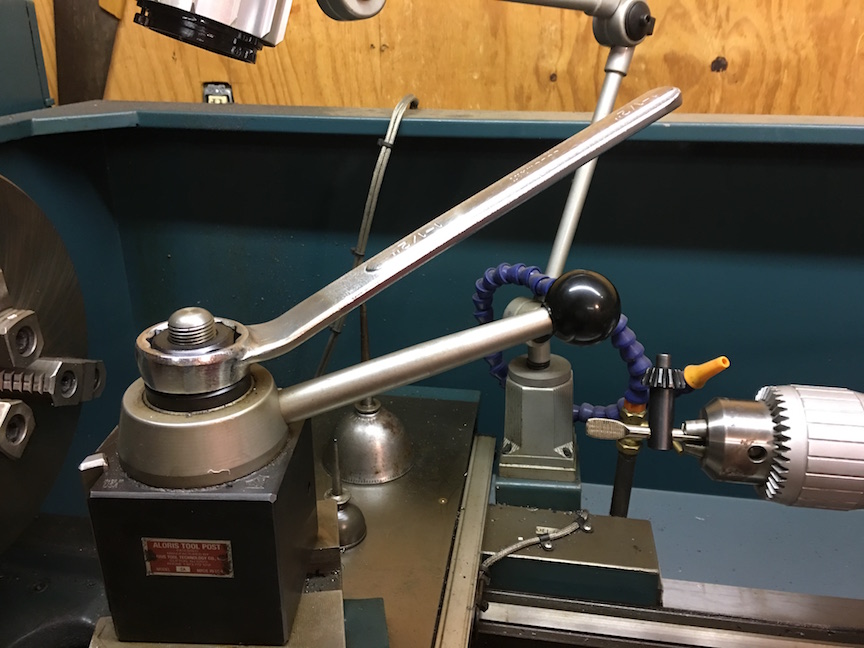
Next, I grabbed the torch and heated the tool until I could bend the wrench so that the handle was at an angle. It took a few trips across the shop, trying the wrench on the machine, to get the angle just right.
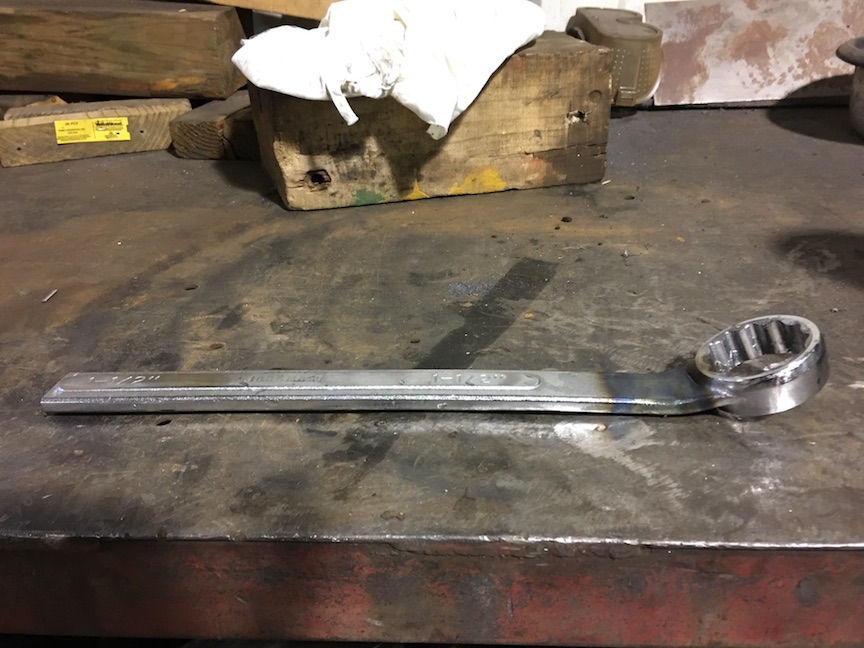
I could have stopped, but I wanted to have a nice rounded handle end that was smooth to slide your hand off and wouldn't scratch the back of your hand if you brushed against it. After some grinding, filing, and emery paper work I had a really nice smoothed surface. A bit of time on the wire wheel cleaned up discoloration where I had heated the tool.
And with less than an hour's worth of time, I had a nice little tool to set the tool post. Now I'm less resistant to readjusting and therefore can make better parts faster. Lazy? Maybe, but it sure is nice to not dislike the tool and I've made it harder to make a goof like over tightening.
Is this rocket science? No. In fact, Keith Fenner has done this as well (video below). The point is, look around and find a few things this week that bug you and take 5-60 minutes and fix them. The time and frustration saved will be worth it!
This month I was lucky enough to have a cover feature on adding a camera and googles/screen to your drone setup. Adding this "First Person View" (FPV) capability really makes flying a lot different as its like you are setting in the cockpit!
Several years ago, I rode in the copilot’s seat of a small Cessna circling over northwest Arkansas. The view was great and the experience of sitting right behind the propeller with a view of where we were headed was fantastic. It made riding in economy of commercial airliners seem even more boring and cramped than it already did. As multirotor pilots, we can now have that experience with first person view (FPV) equipment that literally puts us in the pilot’s seat and immerses us in the experience of flying.
Be sure to checkout the column and let me know of other topics you'd be interested in seeing in future articles! Right now I've got a photogrammetry series coming up after a quick CX-10 hack.
Folks that follow my various projects have probably noticed that I've recently formed an instrumentation and consulting company. I've had great fun doing several jobs for folks ranging from CAD design of brackets to writing numerical models for projects to designing custom measurement solutions. I've also been very busy designing some exciting new hardware that I hope will be available soon. In this post I wanted to share a time saving trick I used in KiCad while designing my printed circuit boards for one of these projects.
When designing things to be made in any quantity by an assembler or manufacturer (and for financial reasons) you need to keep a really good bill of materials or "BOM". Doing this often involves linked Excel sheets, binders of parts lists, and general gnashing of teeth. When working on the BOM for my circuit boards I found an excellent post by Dan over at Rheingold Heavy on designing for manufacture with KiCad. In this post he outlines a really nice workflow on how to keep track of part numbers and other meta-data for each component. Ideally this would happen at the beginning of a project. You would assign a part (say a resistor) a manufacturer's part number, distributor's part number, etc. Then, you can copy that component (and it's metadata) as many times as you need by simply hovering over it and hitting "C". Well, I already had my entire schematic and board layout completed. I had a lot of components that were used many times (think 10 k resistors, 0.1uF caps, and jumpers). I didn't want to keep copying and pasting the information over and over from the websites of the manufactures and distributors and I didn't want to delete the components and copy in components with metadata for fear of destroying my completed project, footprint associations, and who knows what else. My solution? TextExpander.
TextExpander is a program that stores snippets of text and lets you type a few trigger keys to place all of that text in a fraction of a second. I've used it for years and it has easily saved me tens of hours on my laptop. I've got snippets for date and time stamps, outlines for our podcast, form replies about common technical issues in our lab, chunks of code that I use a lot, and really just about anything else you can imagine. (I forgot to add LaTeX equations/tables in there, but that alone saves me a lot of time on every paper I write.) The pricing model for TextExpander has changed recently, and I'm not a huge fan of the new scheme, but that's beside the point.
My idea was simple. I made a set of snippets that would expand into web addresses and part numbers. I would copy information in for a certain part, then using TextExpander add that information to add parts of that kind. After that, I'd change the snippets to the next part and repeat. Yes, this took awhile, but nowhere near as long as if I'd done all of the population by "hand". I've made a quick demo video below to show you how it's done. I hope this ends up being useful to others, let me know of any tricks you've come across to speed your DFM process.
As frequent readers of the blog or listeners of the podcast will know, I really like doing outreach activities. It's one thing to do meaningful science, but another entirely to be able to share that science with the people that paid for it (taxpayers generally) and show them why what we do matters. Outreach is also a great way to get young people interested in STEAM (Science, Technology, Engineering, Art, Math). When anyone you are talking to, adult or child, gets a concept that they never understood before, the lightbulb going on is obvious and very rewarding.
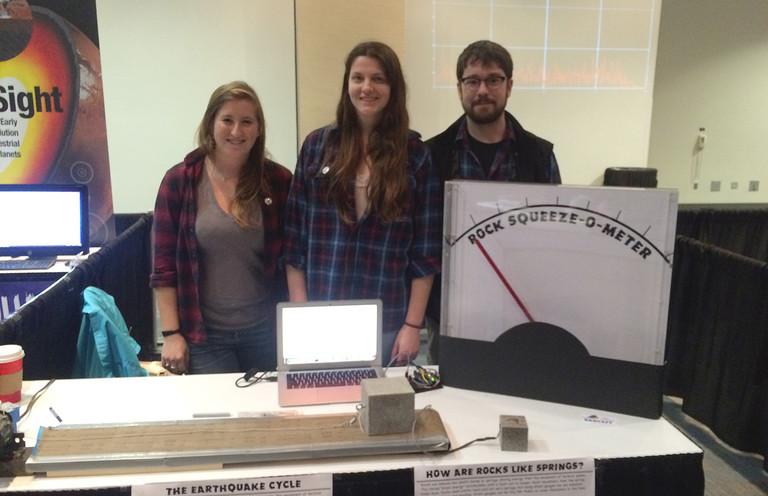
Our lab group recently participated in two outreach events. I've shared about the demonstrations we commonly use before when talking about a local science fair. There are a few that probably deserve their own videos or posts, but I wanted to share one in particular that I improved upon greatly this year: Squeezing Rocks.
Awhile back I shared a video that explained how rocks are like springs. The normal demonstration we used was a granite block with strain gauges on it and a strip chart recorder... yes... with paper and pen. I thought showing lab visitors such an old piece of technology was a bit ironic after they had just heard about our lab being one of the most advanced in the world. Indeed when I started the paper feed, a few parents would chuckle at recognizing the equipment from decades ago. For the video I made an on-screen chart recorder with an Arduino. That was better, but I felt there had to be a better way yet. Young children didn't really understand graphs or time series yet. Other than making the line wiggle, they didn't really get the idea that it represented the rock deforming as they stepped on it or squeezed it.
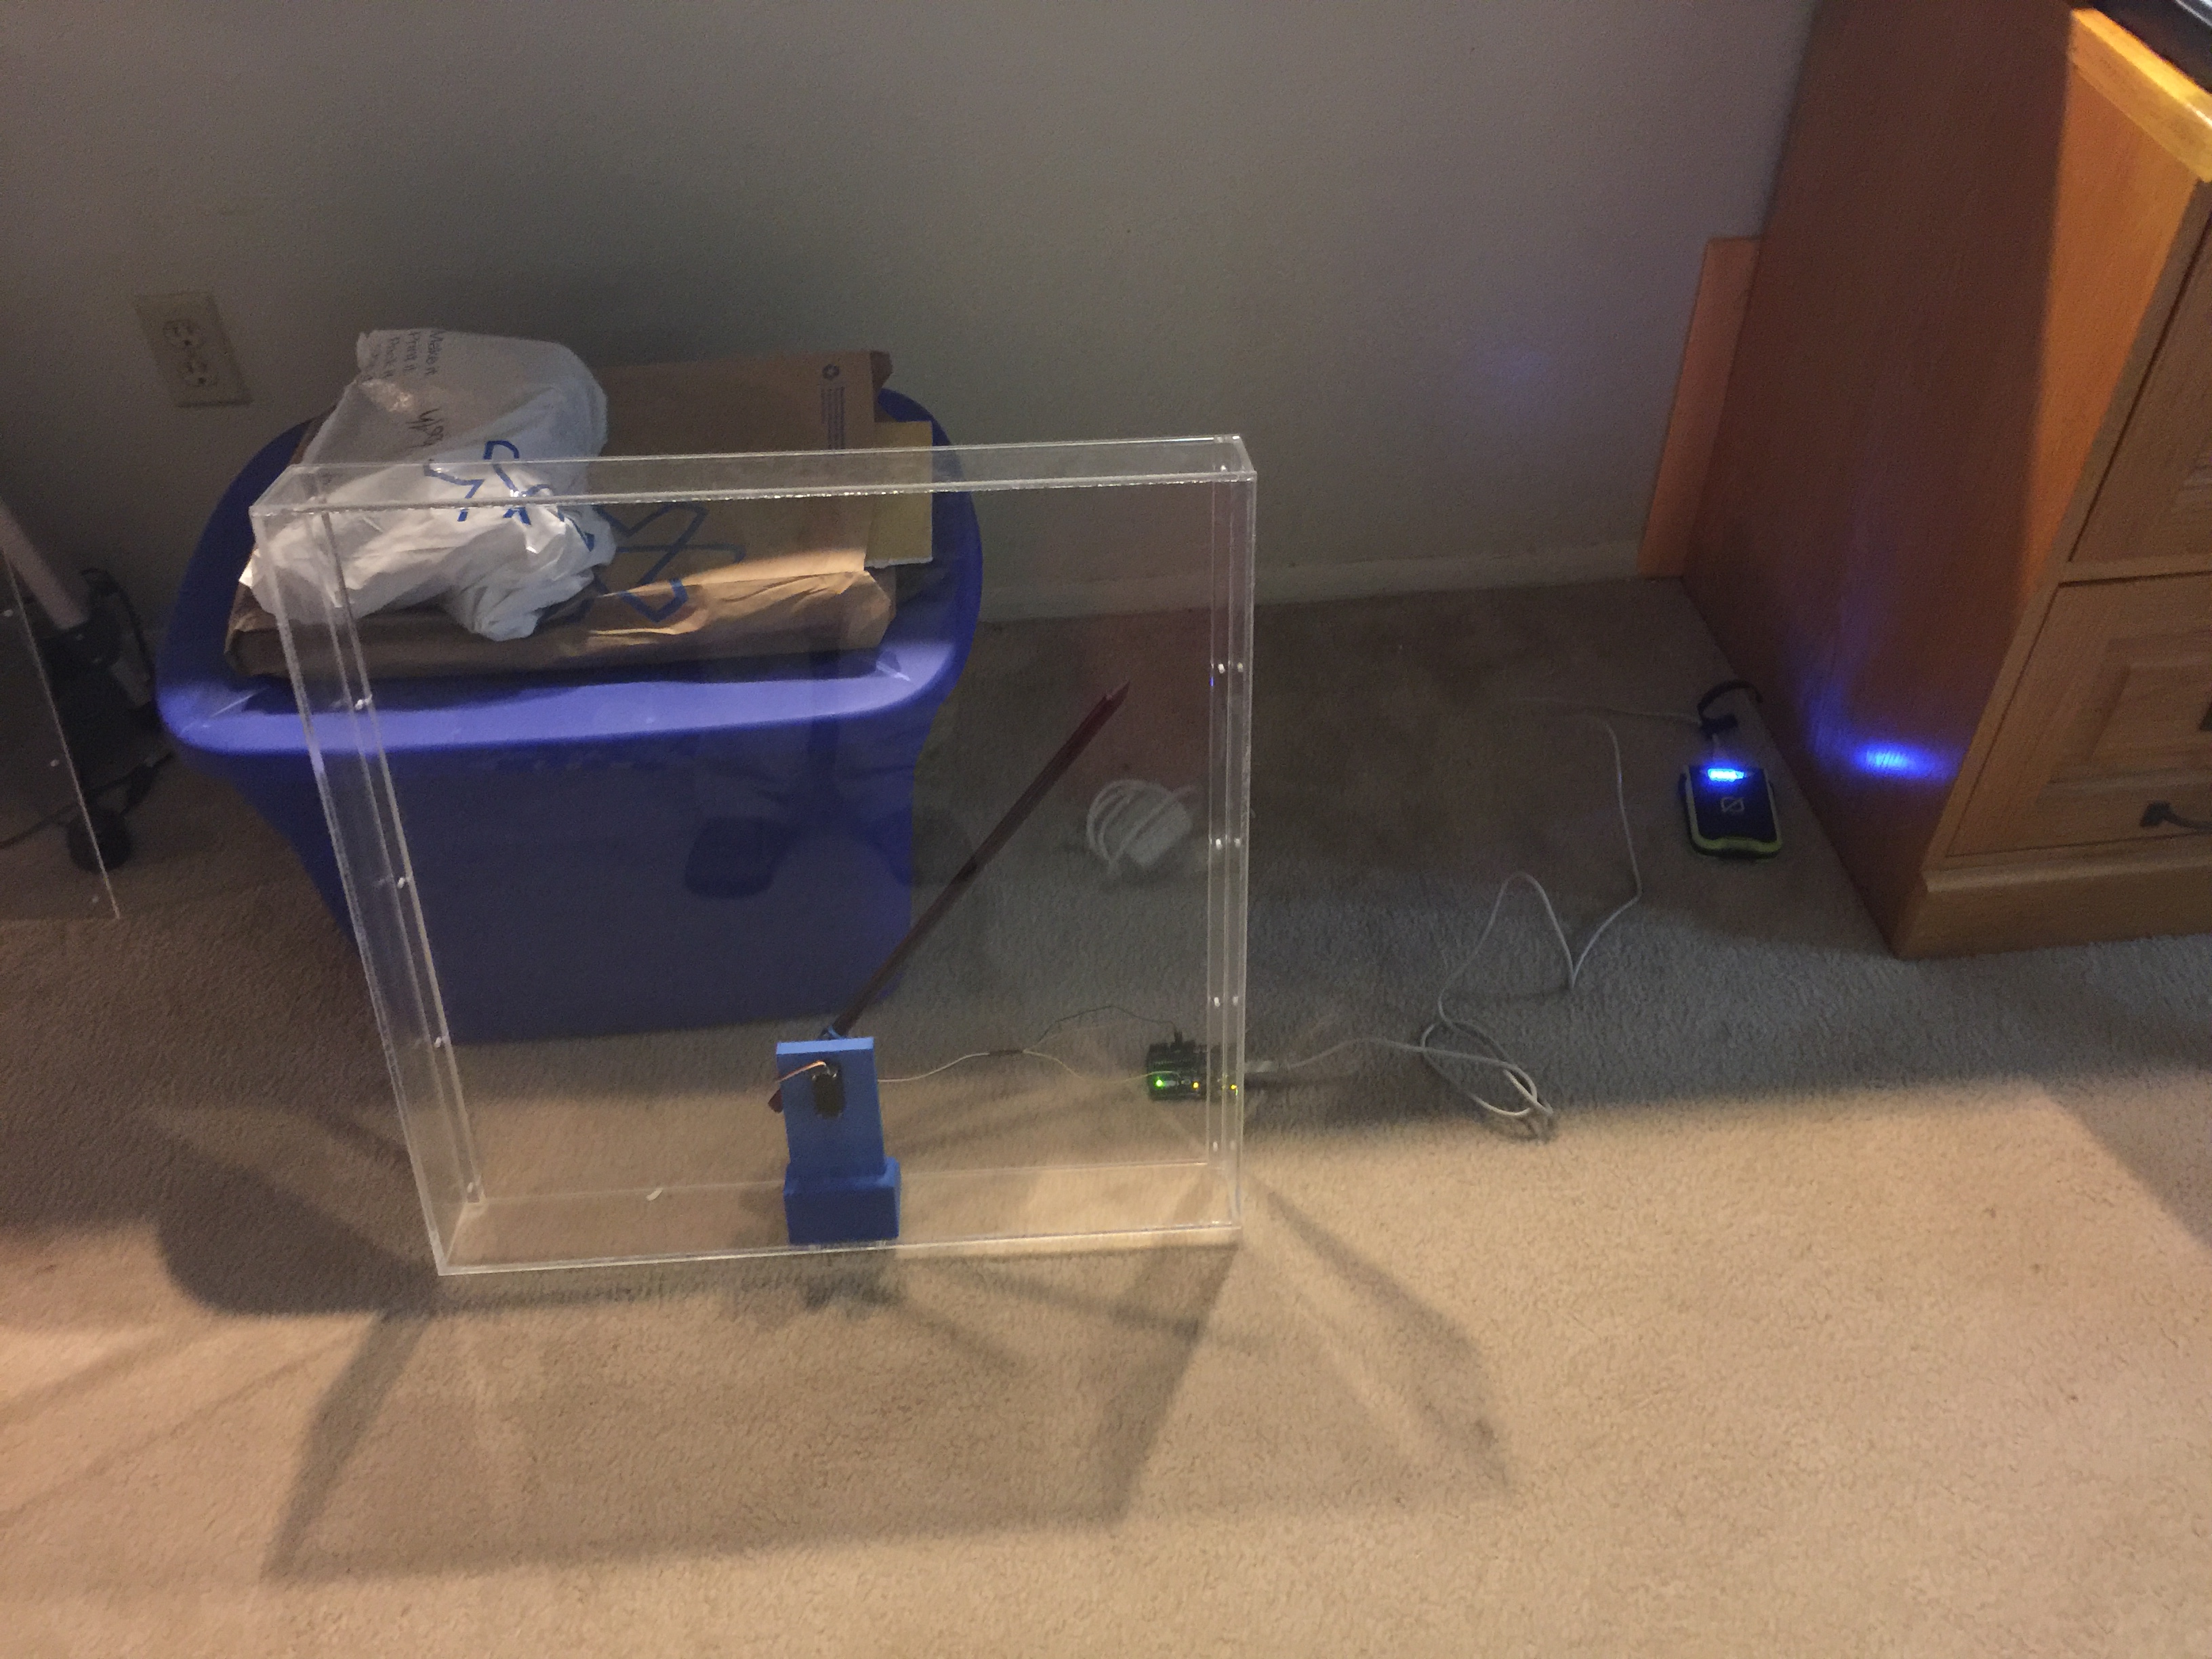
I decided to go semi old-school with a giant analog meter to show how much the rock was deformed. I wanted to avoid a lot of analog electronics as they always get finicky to setup, so I elected to go with the solution on a chip route with a micro-controller and the HX711 load cell amplifier/digitizer. For the giant meter, I didn't think building an actual meter movement was very practical, but a servo and plexiglass setup should work.
A very early test of the meters shows it's 3D printed servo holder inside and the electronics trailing behind.
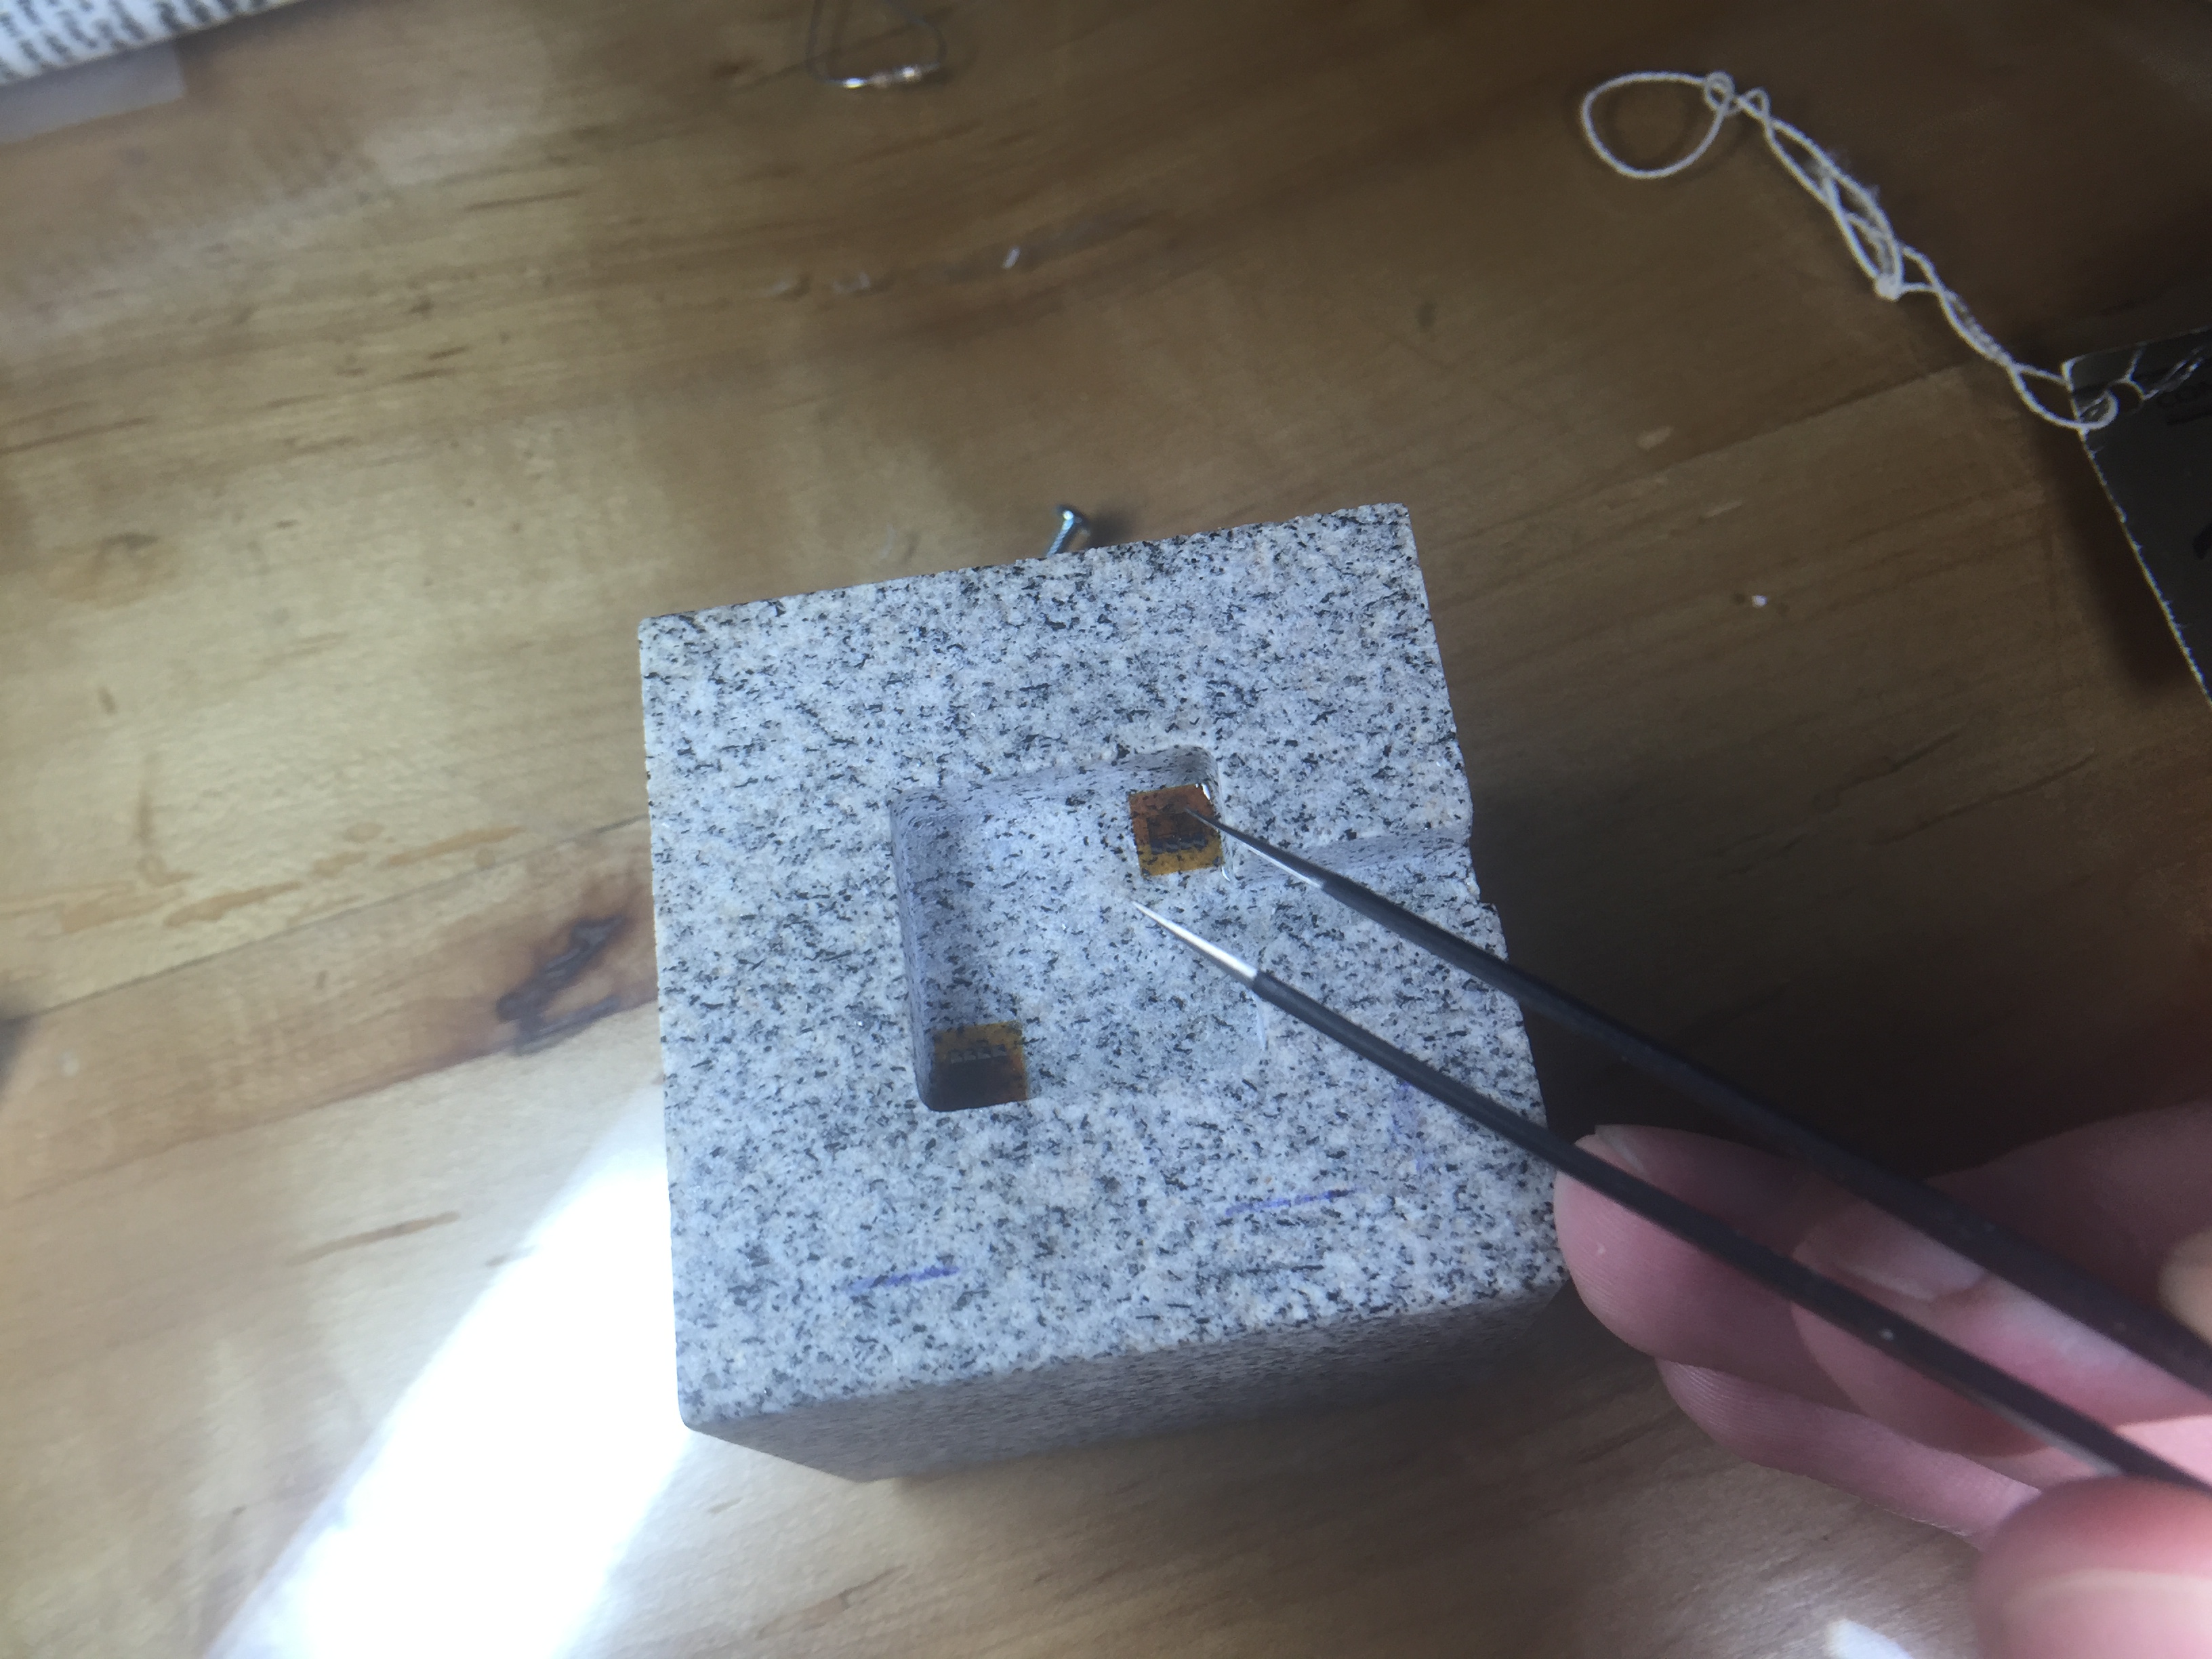
Another thing I wanted to change was the rock we use for the demo. The large granite bar you stepped on was bulky and hard to transport. I also though squeezing with your hands would add to the effect. We had a small cube of granite about 2" on a side cut with a water jet, then ground smooth. The machine shop milled out a 1/4" deep recess where I could epoxy the strain gauges.
Placing strain gauges under a magnifier with tweezers and epoxy.
Going into step-by-step build instructions is something I'm working on over at the project's Hack-a-Day page. I'm also getting the code and drawings together in a GitHub repository (slowly since it is job application time). Currently the instructions are lacking somewhat, but stay tuned. Checkout the video of the final product working below:
The demo was a great success. We debuted it at the AGU Exploration Station event. Penn State even wrote up a nice little article about our group. Parents and kids were amazed that they could deform the rock, and even more amazed when I told them that full scale on the meter was about 0.5µm of deformation. In other words they had compressed the rock about 1/40 the width of a single human hair.
A few lessons came out of this. Shipping an acrylic box is a bad idea. The meter was cracked on the side in return shipping. The damage is reparable, but I'm going to build a smaller (~12-18") unit with a wood frame and back and acrylic for the front panel. I also had a problem with parts breaking off the PCB in shipment. I wanted the electronics exposed for people to see, but maybe a clear case is best instead of open. I may try open one more time with a better case on it for transport. The final lesson was just how hard on equipment young kids can be. We had some enthusiastic rock squeezers, and by the end of the day the insulation on the wires to the rock was starting to crack. I'm still not sure what the best way to deal with this is, but I'm going to try a jacketed cable for starters.
Keep an eye on the project page for updates and if any big changes are made, you'll see them here on the blog as well. I'm still thinking of ways to improve this demo and a few others, but this was a giant step forward. Kids seeing a big "Rock Squeeze O Meter" was a real attention getter.
Hmm... As I'm writing this I'm thinking about a giant LED bar graph. It's easy to transport and kind of like those test your strength games at the fair... I think I better go parts shopping.
While home for the holidays, I decided to make a little calibration stand that I need for a tilt meter project I'm working on. Back in the 2006 time frame I had worked to learn basic machining skills on the mill and lathe. I never was amazing at it, but managed to get a basic skill set down. I ended up back over at my mentor's shop this week to make a simple part, but thought you may enjoy seeing some photos of a simple milling setup.
The first step is to have a part design that is exactly what you want to make. Problems always arise when you have a rough sketch and make it up as you go. For some hobby projects that can work, but as our systems become more and more complex, it generally just leads to wasted time, material, and lots of frustration. This particular part is exceedingly simple, but I went ahead and made a full 3D CAD model anyway, just to illustrate the process.
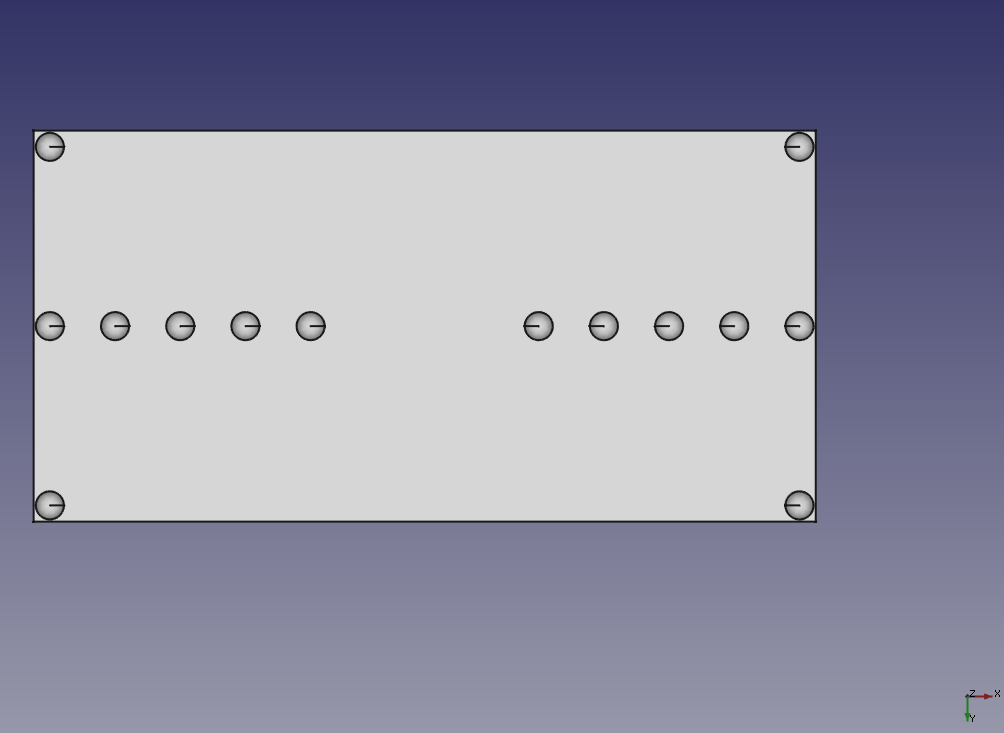
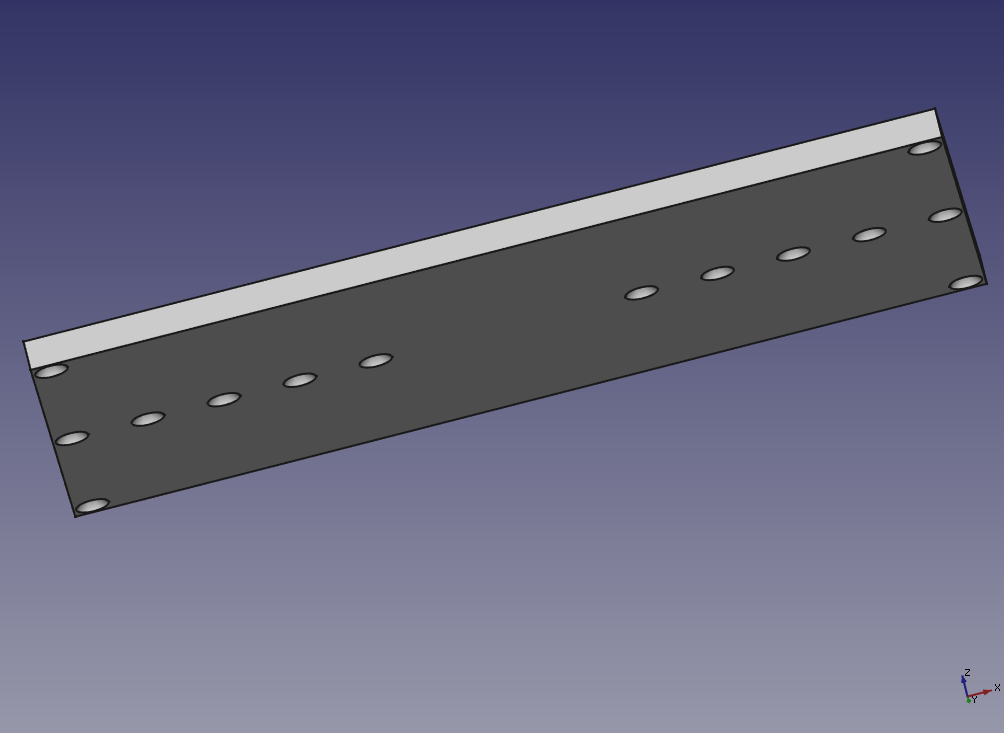
Our goal is to make a flat plate for a tilt meter to set on. We will then elevate one end of the plate a known amount with precision thickness pieces of metal called gauge blocks. Knowing the distance between the ends of the plate and the amount we elevate one end, we can very accurately calculate the angle. That lets me calibrate the readings from the tilt meter to real physical units of degrees or radians. All good designs start with a specification, my specification was I wanted at least 5 different tilts ranging from 0 - 0.5 degrees, the more combinations possible the better. I also wanted a compact and rigid device that wouldn't bend, warp, or otherwise become less accurate when tilted.
Time to fire up a Jupyter notebook and do some calculations! I mainly wanted to be able to play with the tradeoffs of baseline length, height of gauge block (they come in standard sizes), etc. After playing with the numbers some, I came with up a design that used multiple baseline lengths with available gauge blocks. I decided to use ball bearings under the plate to give nice point contacts with the surface of the table as well. This meant I needed a plate about 6" x 12" with hemispherical divots to retain the bearings.
Next, I fired up FreeCAD and made the design by taking a 6" x 6" plate and using 0.5" spheres as the cutting shape to make the divots. The divots are only 1/8" deep, so setting them in 1/4" from the edges is enough. Then I just mirrored that 6" x 6" part to make the full part. This lets me tilt both directions the same amount without turning or moving the instrument under test. The drawing I produced is shown in both bottom and oblique view.
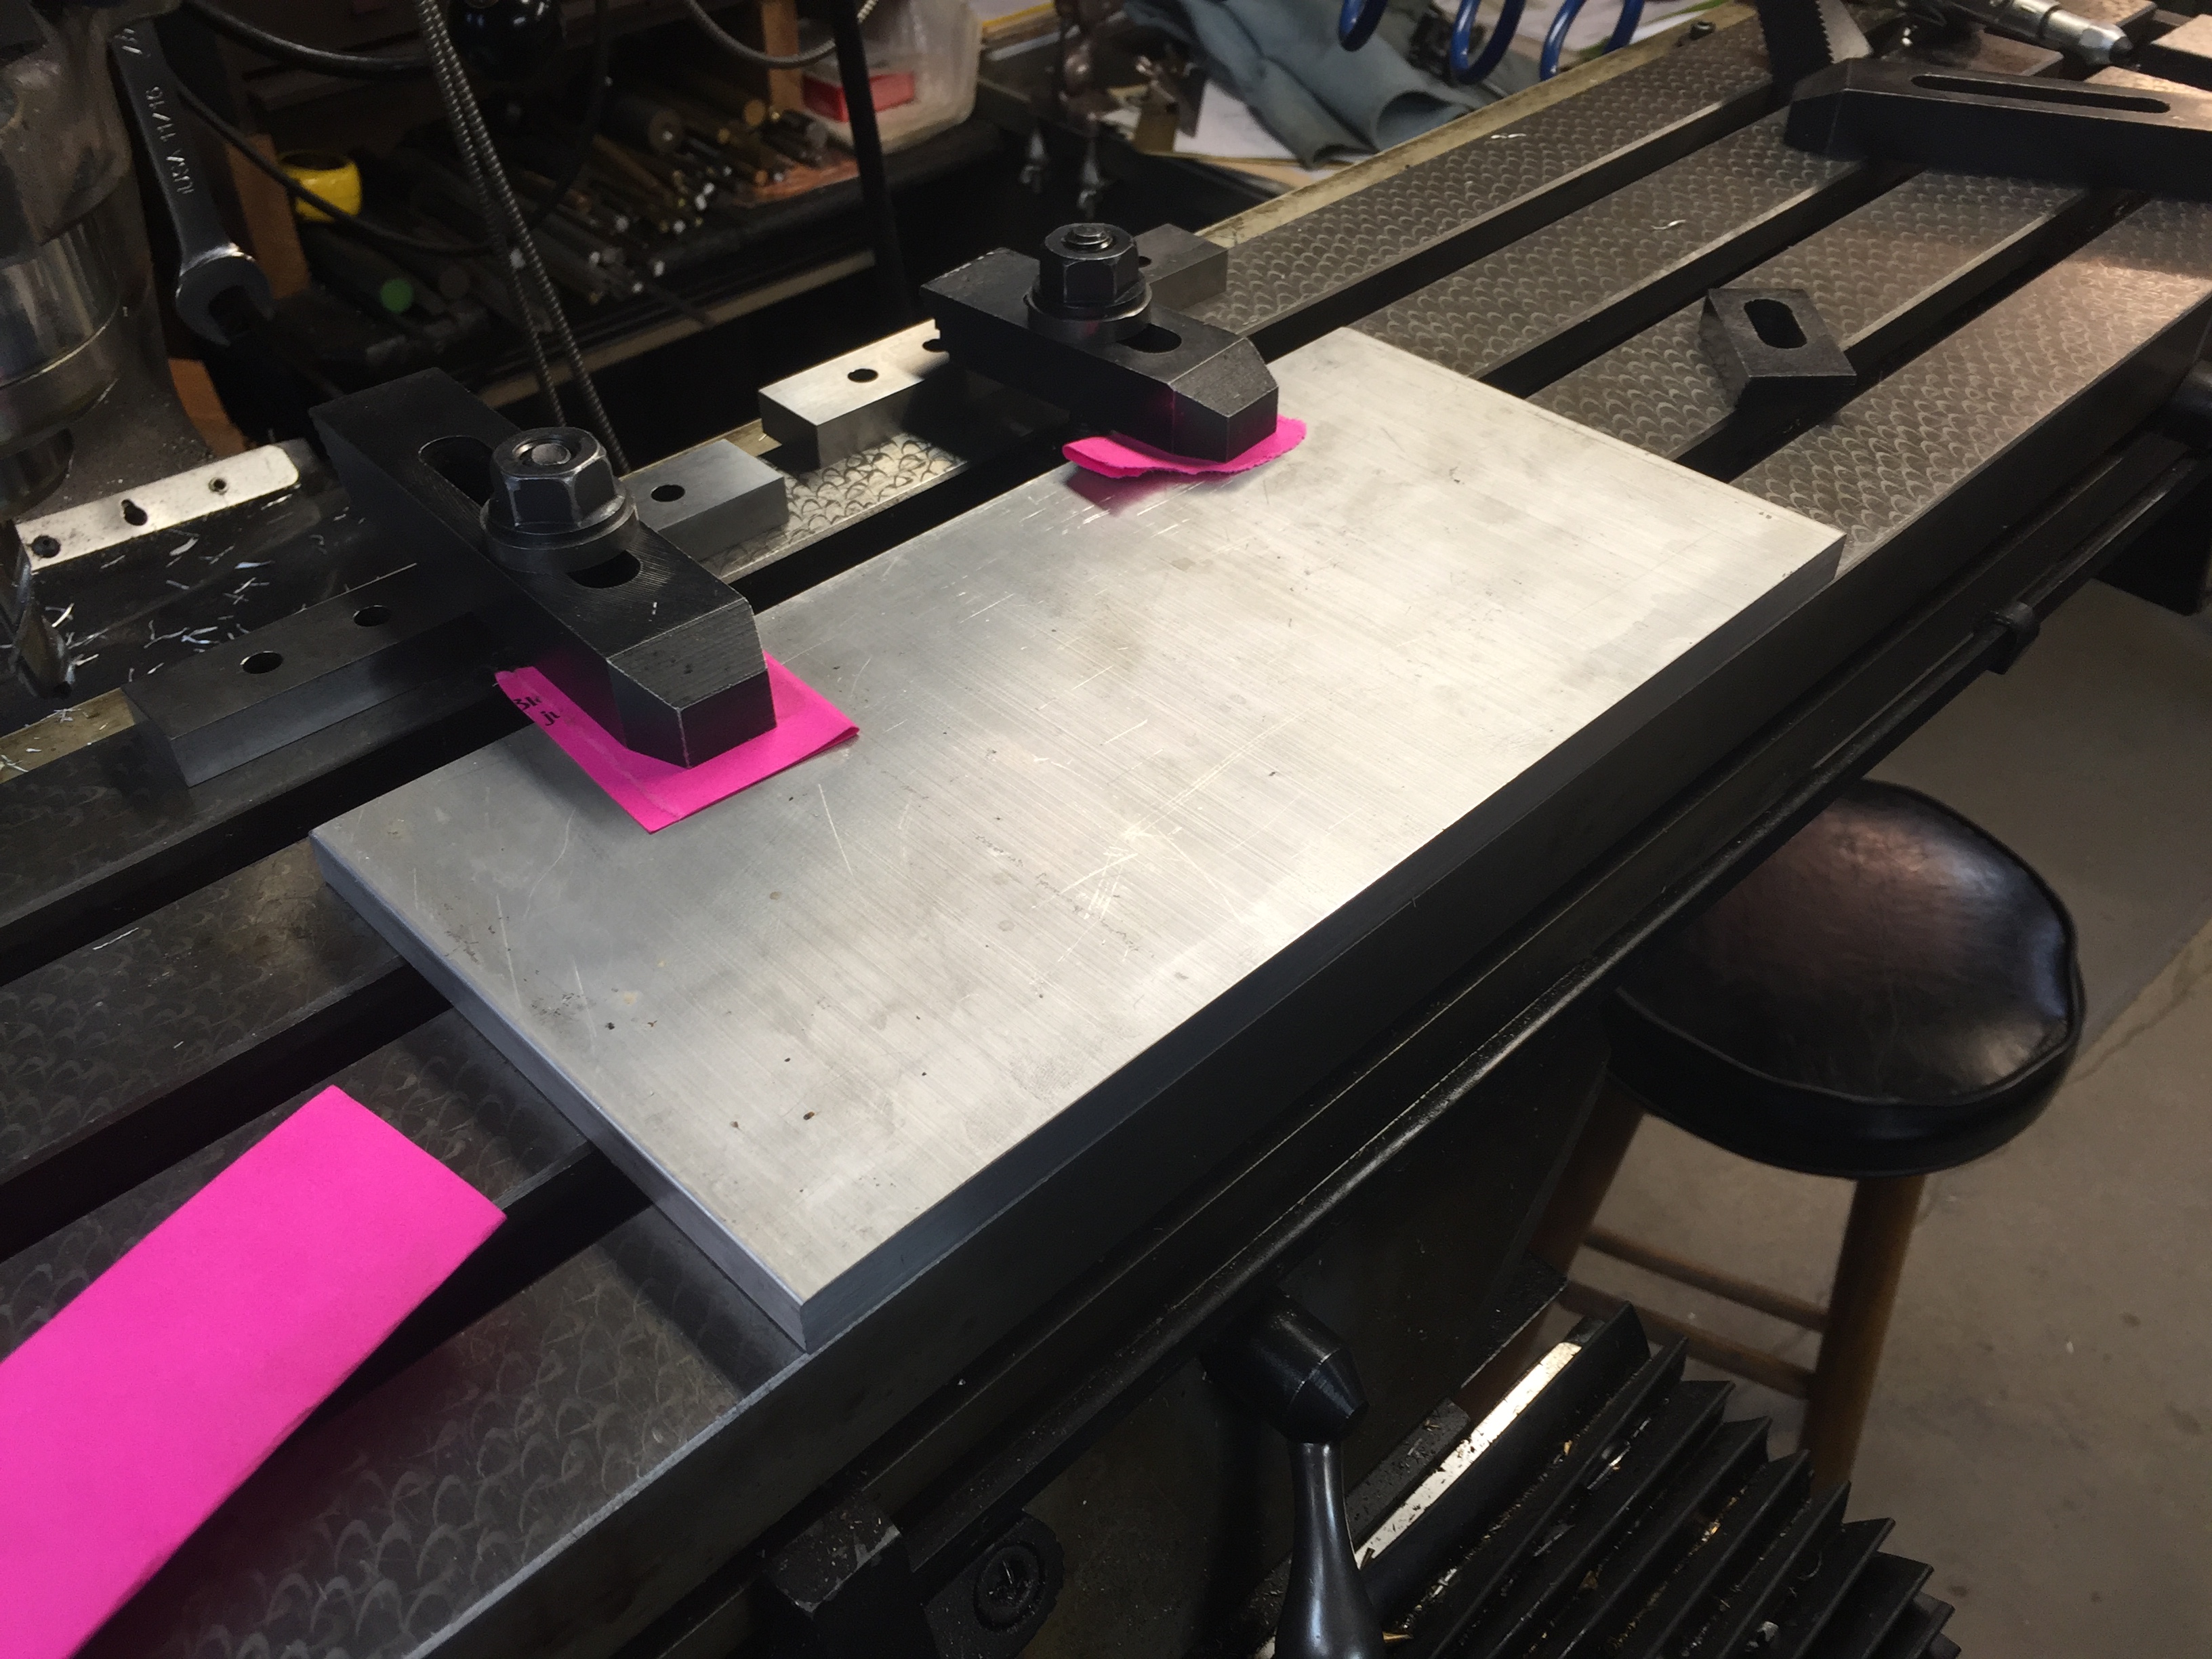
Next it was time to make the plate. I ended up with a piece of 0.5" thick 6061 Aluminum plate. We first cut it to roughly the size we wanted (slightly oversized) with a bandsaw. Then the plate was clamped down to the milling machine table to take off the extra material with a milling bit and give the sides a nice and clean finish. We ended up re-clamping during the work (almost always a bad idea) and had a slight taper on the width, but that isn't a concern for the usefulness. (By slight taper I mean about 20 thou along the length.)
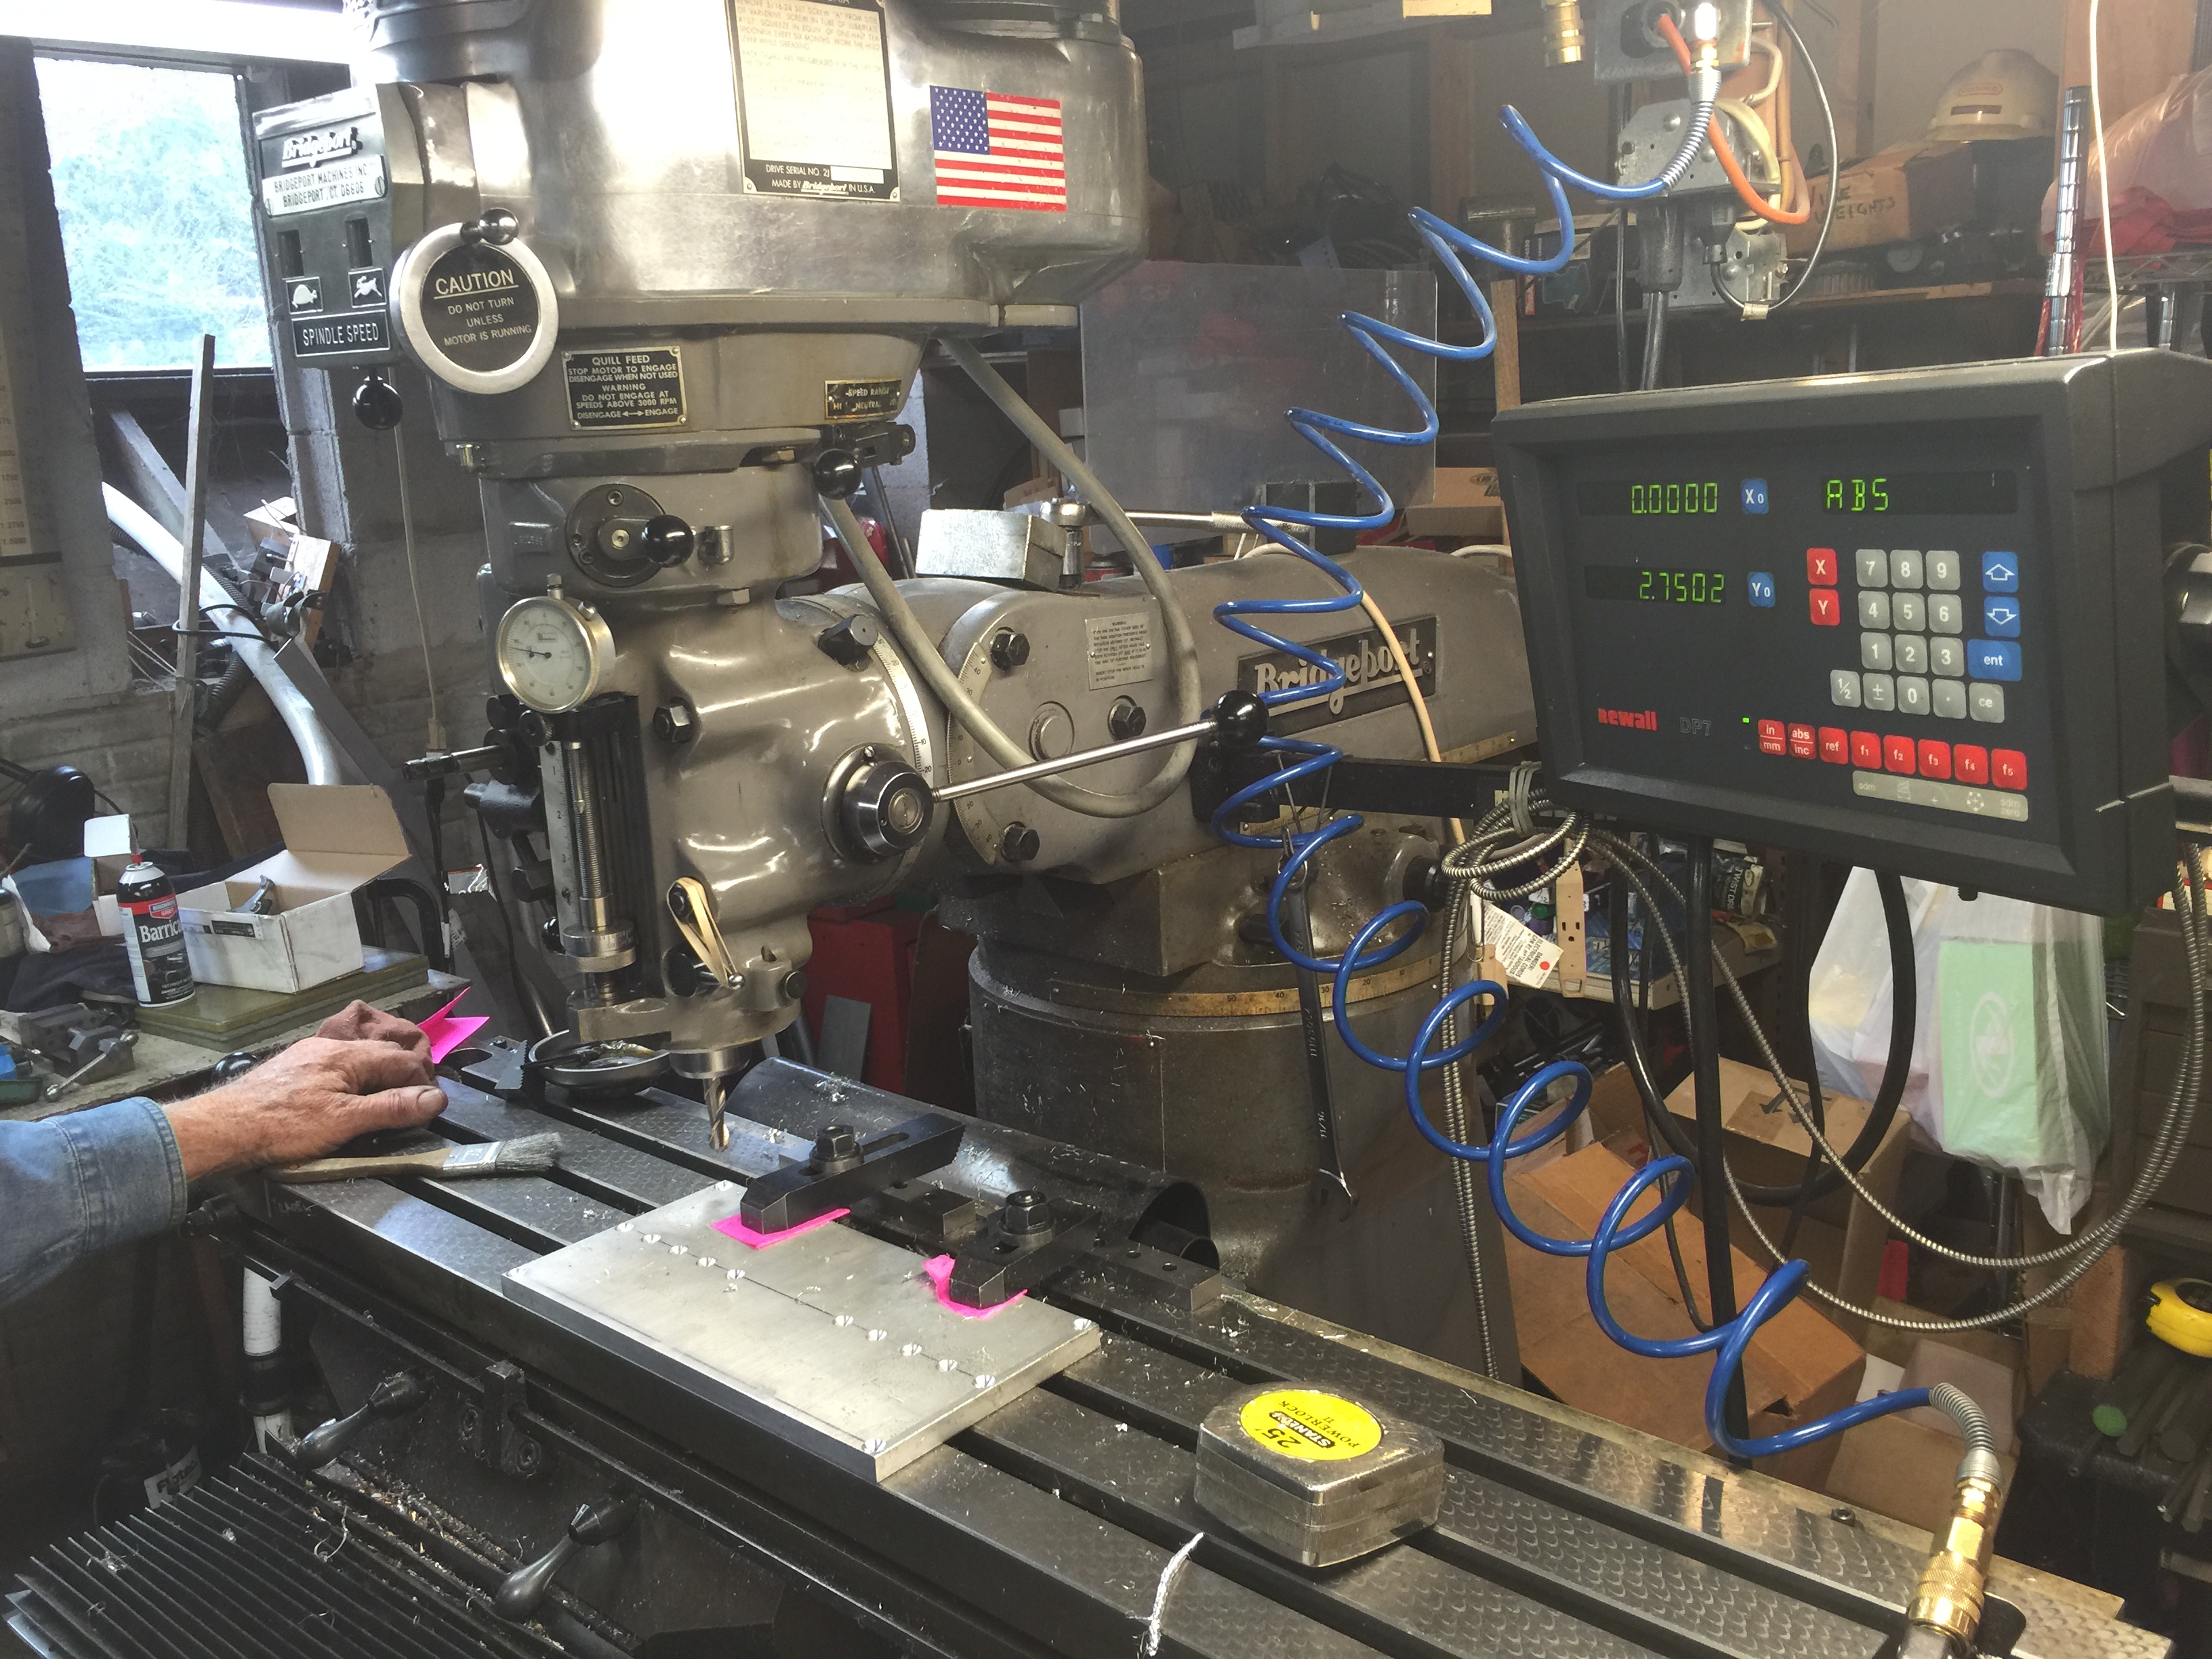
We then were ready to make the divots. To do this we used a ball end mill that makes nice hemispheres. This is a very simple part, so just finding the edge, setting the readout, and doing the cuts took about 20 minutes. I've included some photos incase you haven't seen a milling setup before. It's really great fun to be able to control these cutters and tools to a thousandth of an inch and sculpt metal into what you need. As I said, this isn't a complex part, but that's good because I was a little rusty!
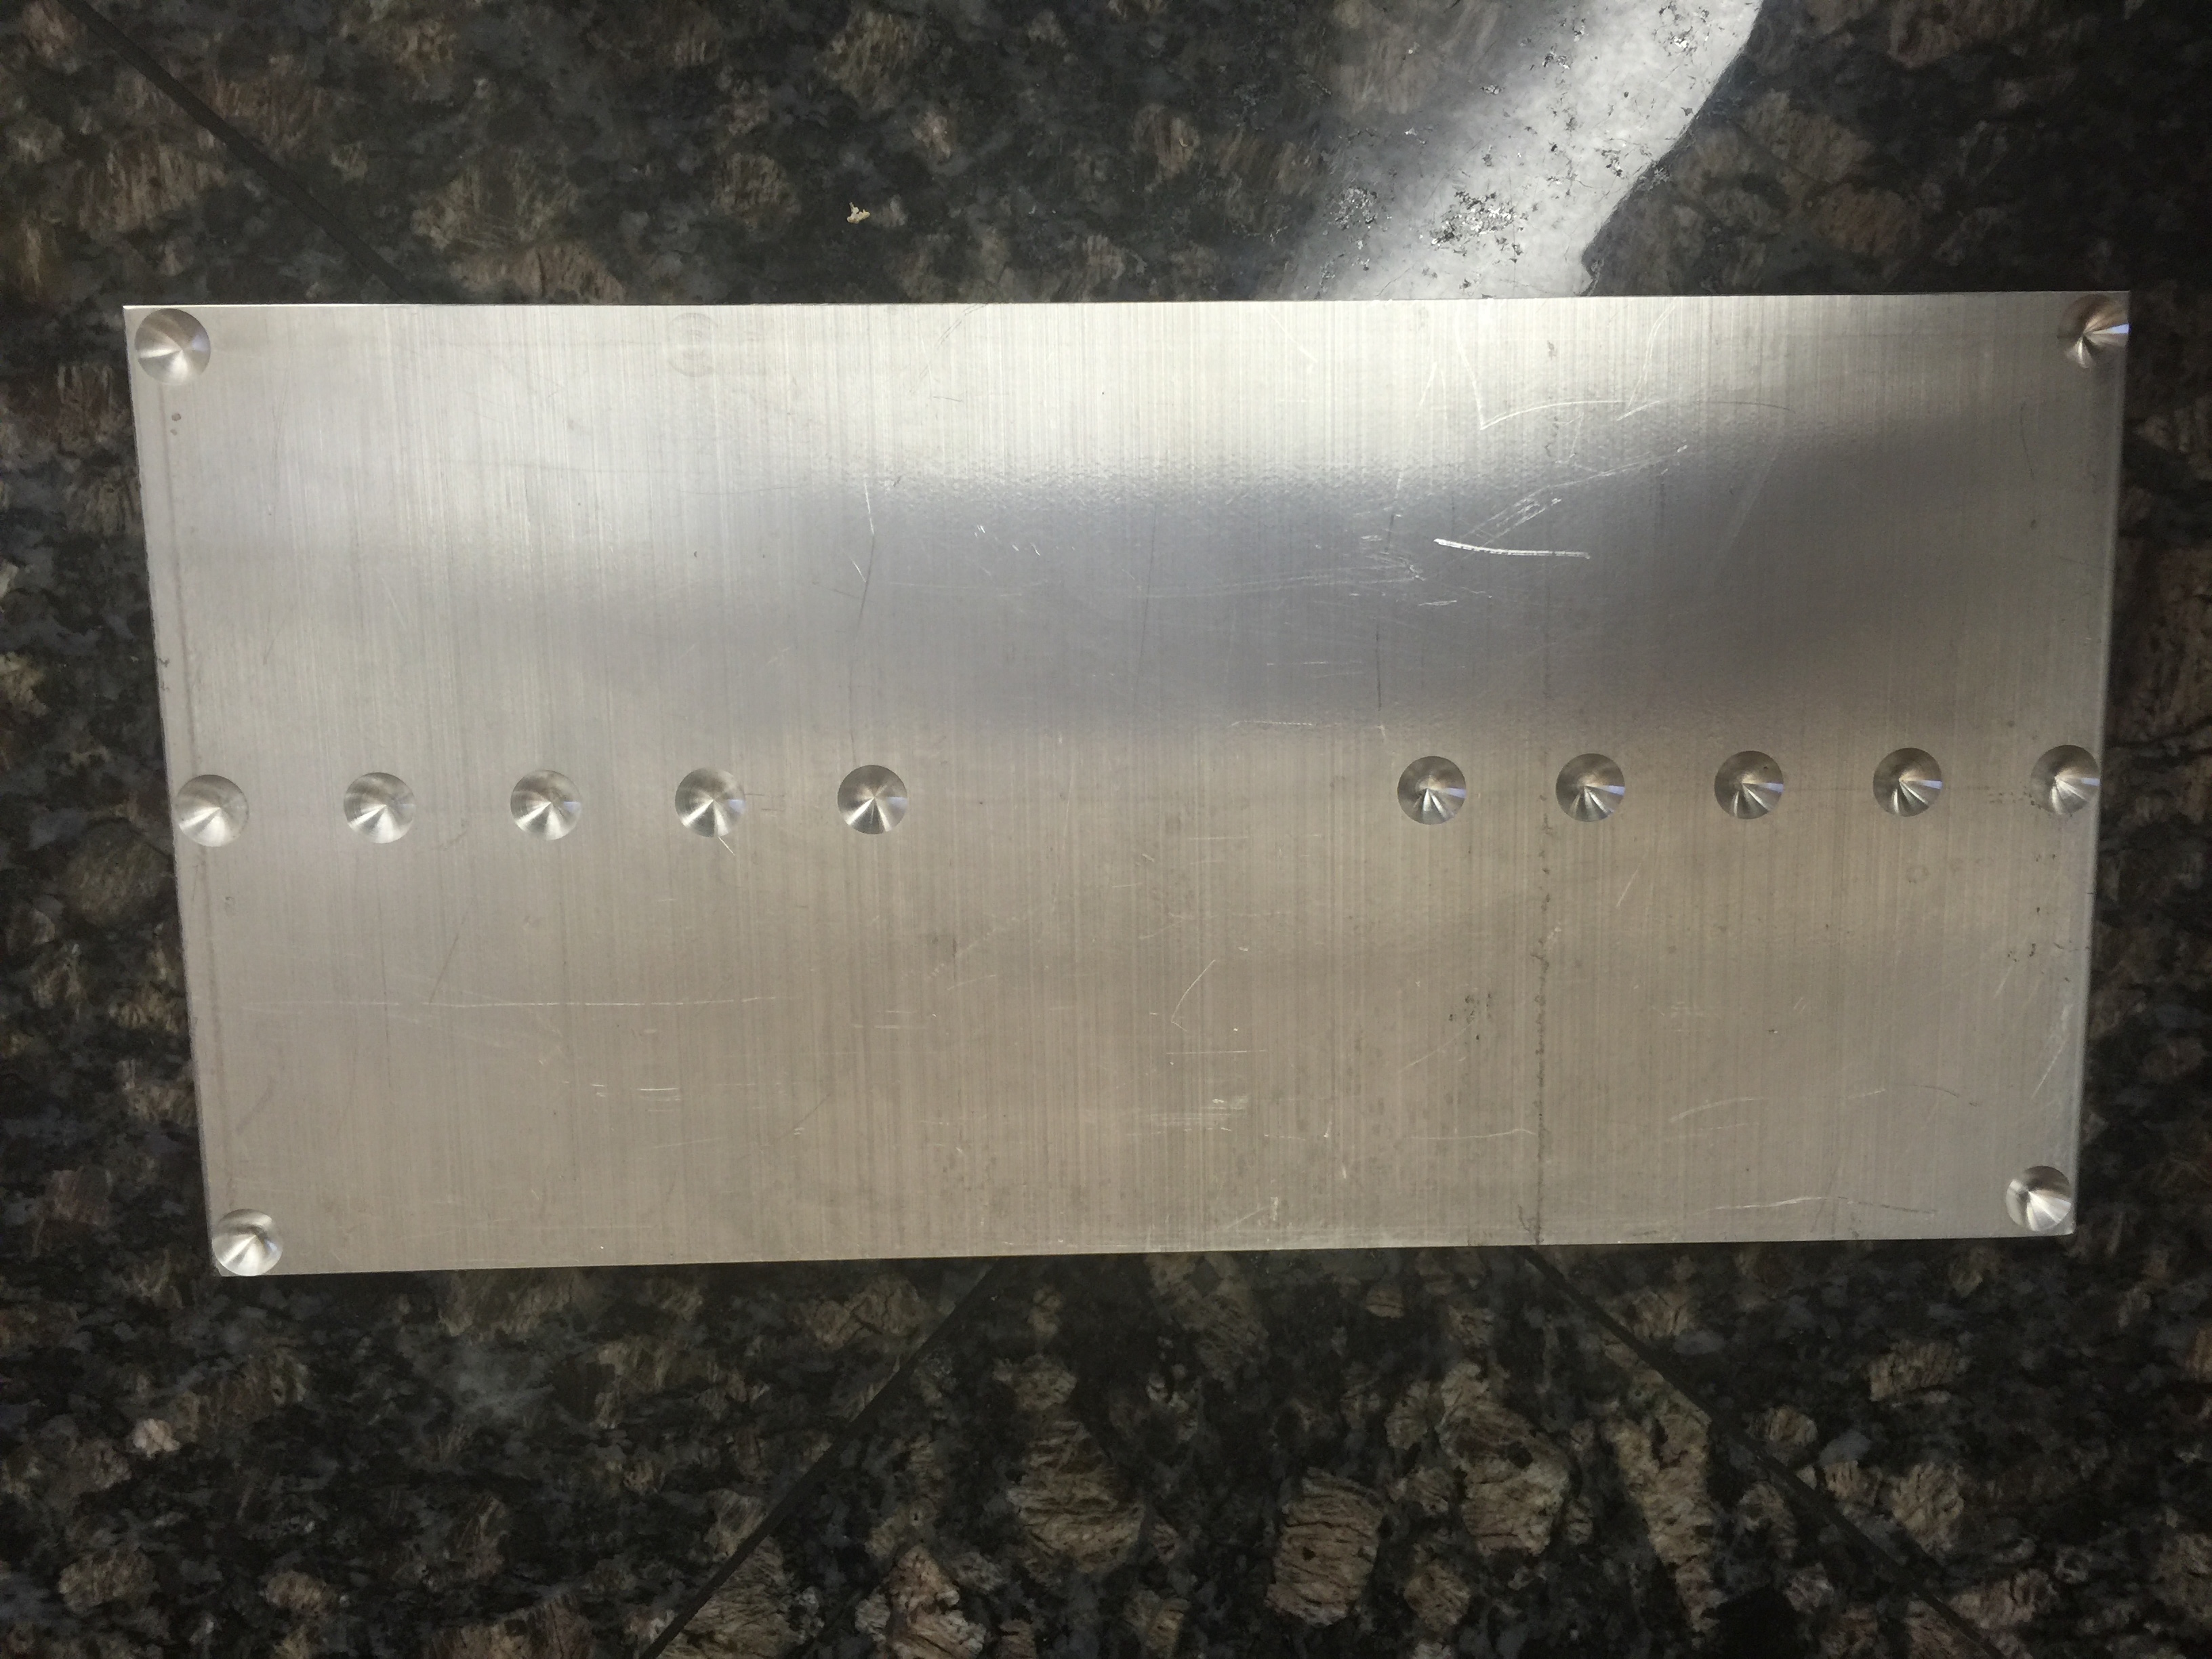
In the end we got a nice plate and I think it will perform its duty very well. I'll most likely write a future post showing it in use and explaining instrument calibration. I've included some pictures of the finished plate and how it will work sitting on the ball bearings.
I've been working on developing some geophysical instruments that will need some significant temperature compensation. Often times when you buy a sensor there is some temperature dependance (if not humidity, pressure, and a slew of other variables). The manufacturer will generally quote a compensation figure. Say we are measuring voltage with an analog-to-digital converter (ADC); the temperature dependance may be quoted as some number of volts per degree of temperature change over a certain range of voltages and temperatures. Generally this is a linear correction. Most of the time that is good enough, but for scientific applications we sometimes need to squeeze out every error we can and compare instruments. Maybe one sensor is sightly more temperature dependent than another; comparing the sensors could then lead us to some false conclusions. This means that sometimes we need to calibrate every sensor we are going to use. In the lab I work in, we calibrate all of our transducers every 6 months by using transfer standards. (Standards, transfer of standards, and calibration theory are a whole series of posts in themselves.)
To do thermal calibrations it is common to put the instruments into a thermal chamber in which we can vary the temperature over a wide range of conditions while keeping the physical variable we are measuring (voltage, pressure, load, etc) constant. Then we know any change in the reading is due to thermal effects on the system. If we are measuring something like tilt or displacement, we have to be sure that we are calibrating the electronics, not signals from thermal expansion of metals and materials that make up our testing jig.
I scoured EBay and the surplus store at our University, but only found very large and expensive units. I remembered that several years ago Dave Jones over at the EEVBlog had mentioned a cheap alternative made from a peltier device wine cooler. I dug up his video (below) and went to the web again in search of the device.
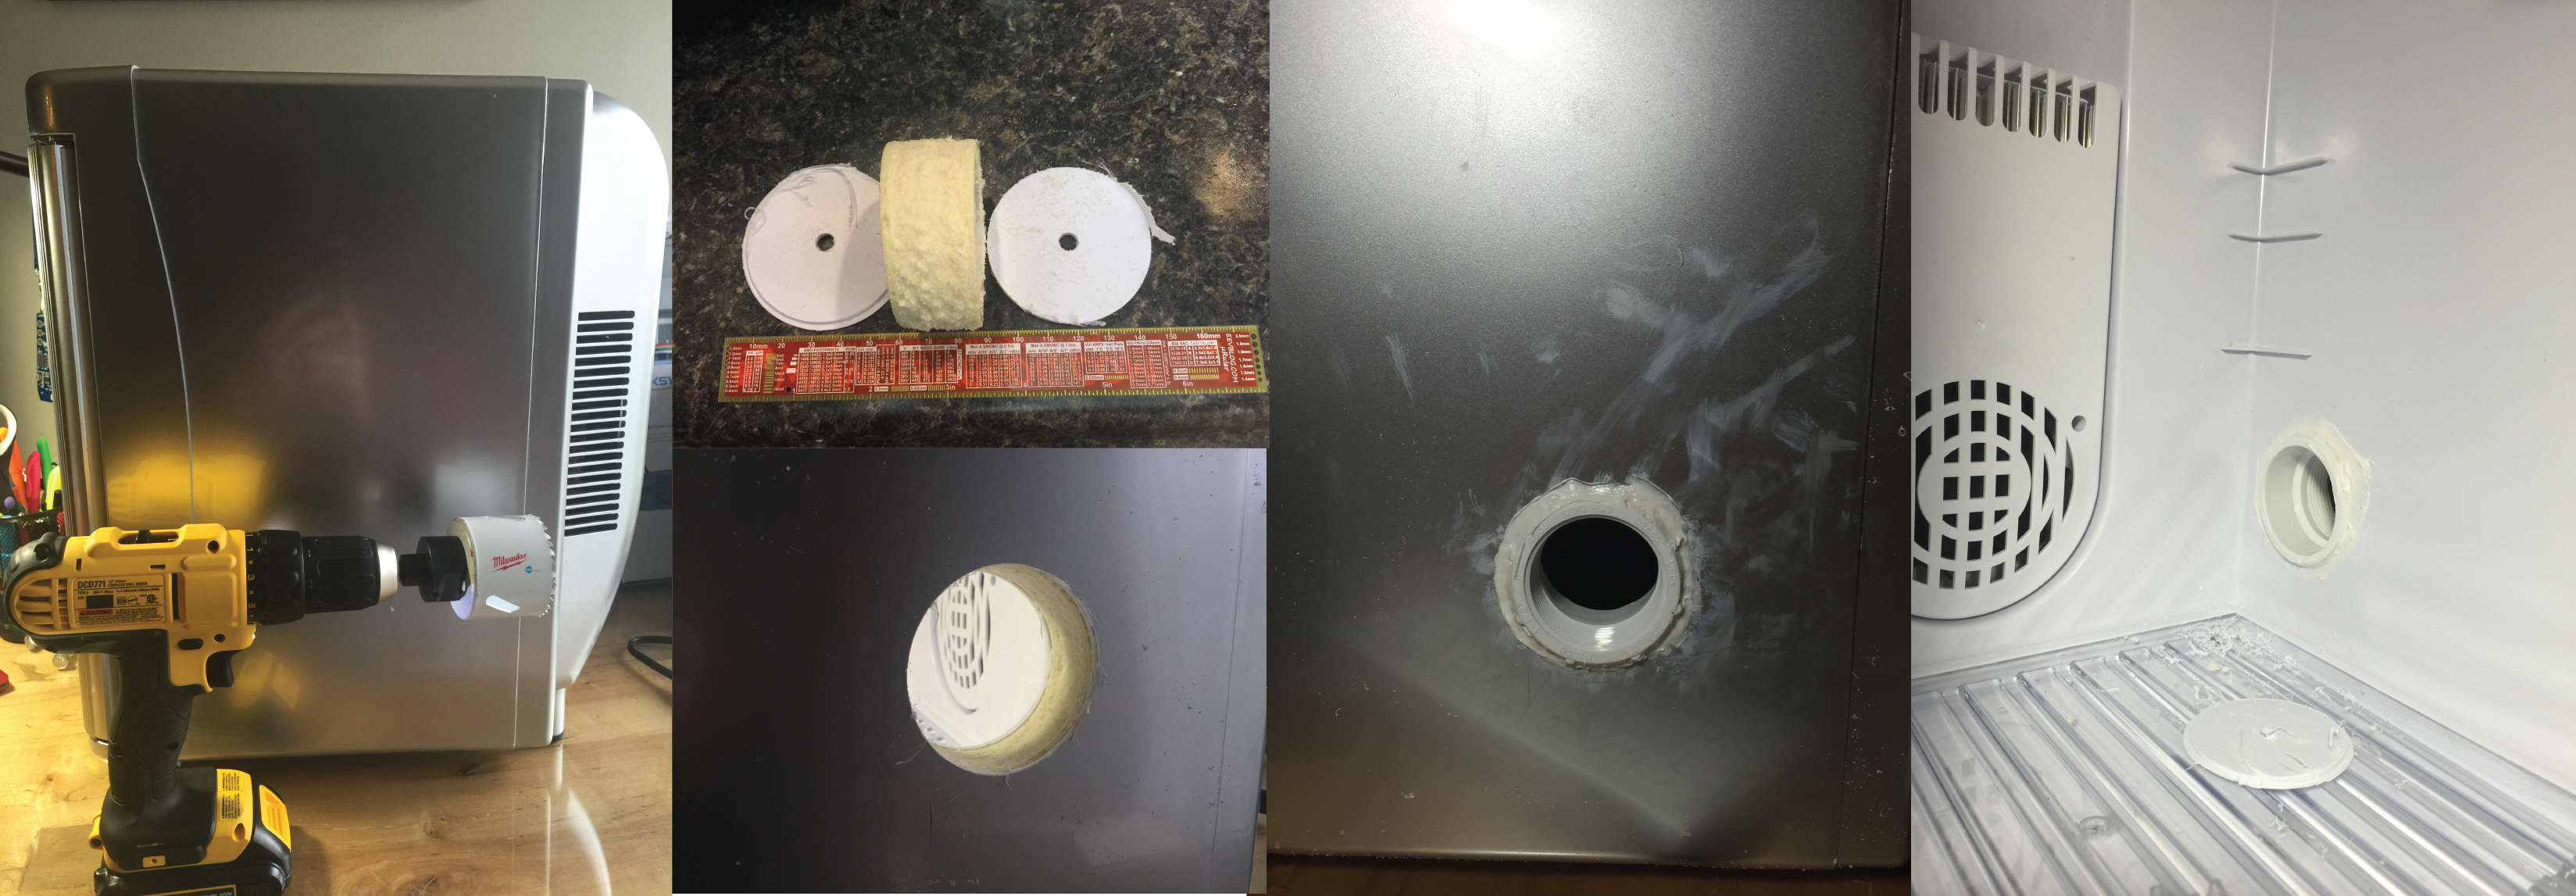
I found the chamber marketed as a reptile egg incubator on Amazon. The reviews were not great, some saying the unit was off by several degrees or did not maintain the +/- 1 degree temperature as marketed. I decided to give it a shot since it was the only affordable alternative and if it didn't work, maybe I could hack it with a new control system and use the box/peltier element with my own system. In this post I'm going to show you the stock performance of the chamber and some initial tests to figure out if it will do the job.
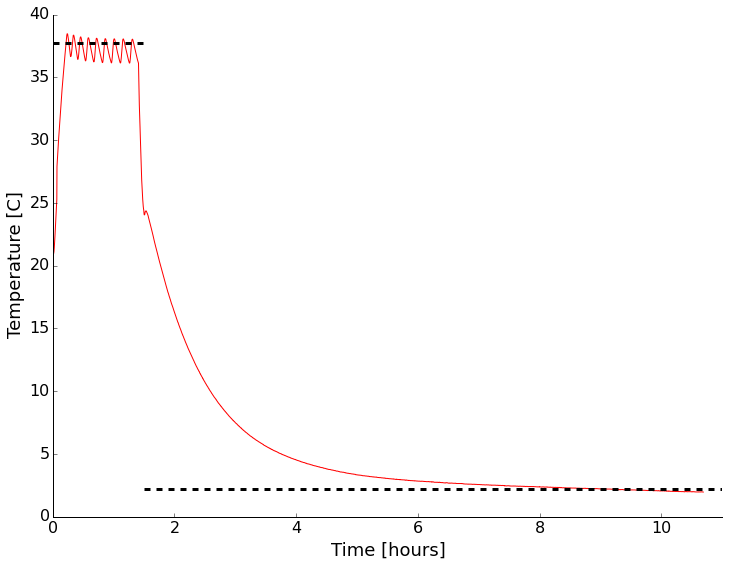
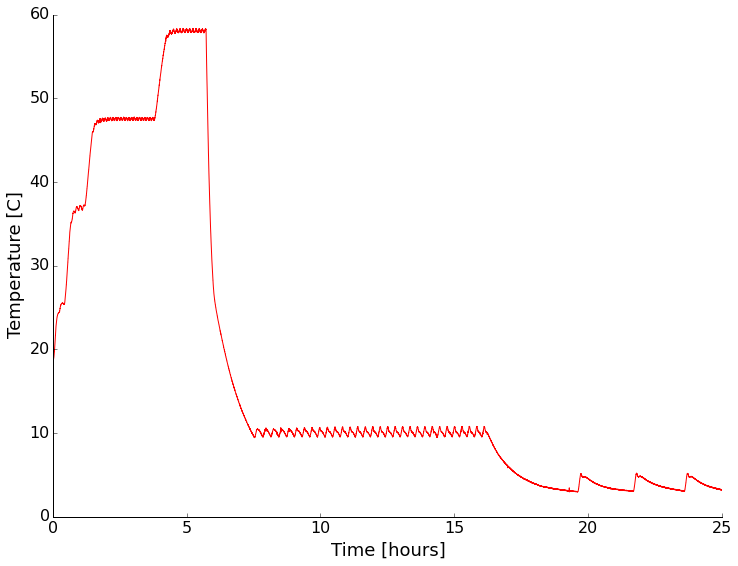
As soon as it arrived I setup the unit and put an environmental sensor in (my WxBackpack for the Light Blue Bean used back in the drone post) inside. I wanted to see if it was even close to the temperature displayed on the front and how good the control was with no thermal load inside. There was a small data drop-out causing a kink early in the record (around 30 C). It looks like the temperature is right on what I had set it to with the quoted +/- 1 degree range. There is some stabilization time and the mean isn't the same as the set point, but that makes sense to me, you don't want to overheat eggs! This looks encouraging overall. I also noticed that the LED light inside the chamber flickered wildly when the peltier device was drawing a lot of power heating/cooling the system. I then opened the door and set the unit to cool. After reaching room temperature, I closed the door and went to bed. It certainly isn't fast, but I was able to get down to about 2C with no thermal load. That was good enough for me. Time to add a cable port, checkout the LED issue, and test with some water jars for more thermal mass.
Initial test of the thermal chamber with nothing inside except a temperature logger. Set point shown by dashed line.
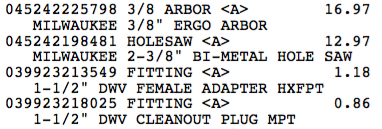
The next step was to add a cable port to be able to get test cables in and out. I decided to follow what Dave did and add a 1.5" test port with a PVC fitting, a hole saw, and some silicone sealant. Below are a few pictures of drilling and inserting the fitting. I used Home Depot parts (listing below). I didn't have the correct size hole-saw. That's happened a lot lately, so I invested in the Milwaukee interchangeable system. I got a threaded fitting so I can put a plug in if needed. the time honored tradition is to put your cables through the port and stuff a rag in though. This works as well as a plug generally, but it's nice to have the option.
Before, during, and after cable port placement. The center of the hole is 7 3/8" back from the front door seal, and 5 1/8" up from table top level. I used gel super glue to quickly fix the fitting to the plastic layers and foam. After that dried, I used silicone bath adhesive/sealant to seal the inside and outside. The edge of a junk-mail credit card offer made smoothing the silicone easier.
While working inside the chamber I pulled out the LED board and noticed a dodgy looking solder joint. I reflowed it. I also pulled the back off the unit to make sure there were no dangerous connections or anything that looked poor quality. Nothing jumped out.
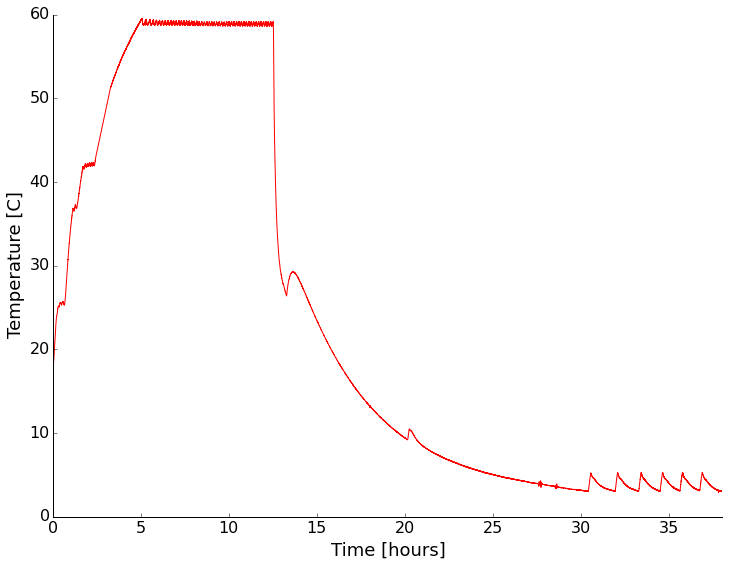
I put the whole thing back together and put a sensor in to monitor the environment and tested again. This time I tried a few different set points with and without containers of water inside the chamber. First with nothing but the sensor setup inside:
For both heating and cooling the performance under no thermal load (other than the sensor electronics) was pretty good. Cooling is rather slow and more poorly controlled than heating though.
Next I put sealed containers of water on the shelves of the chamber to add some thermal mass and see if that changed the characteristics of the chamber any. It did slow the temperature change as expected, but appears to have had little other effect (I didn't wait long enough for stabilization on some settings).
With a water load the chamber had similar performance, but was slower in getting to temperature as expected.
It looks like at temperatures above ambient the chamber has a stability of +/- 1 degree. Below ambient it becomes a couple of degrees. The absolute reading drifts a bit too. Setting the chamber to a given reading always resulted in stabilization within about a degree of the setting though.
I think this will be a nice addition to my home lab. While the unit isn't incredibly accurate, I will be recording the device temperature anyway, so that works for me. It'd be nice to cool down more quickly though, so I may facilitate that with some dry ice. Stay tuned as I'll be testing instruments in there sometime in the next month or so.
P.S. - The LED light still flickers in a way that indicates unstable power/connection. Not a deal breaker for me since I don't really need the light, but something to remember.
I recently received some money to purchase a 3D printer to aid my laboratory experiments. I thought that it would be good to share how I decided on the printer that I did and how hard/easy it was to setup. Currently I've only run a few simple test prints, but will be printing some mounting equipment for laboratory experiments within a few weeks.
Choosing a Printer
When choosing a printer, there are many factors to consider. The consumer 3D printer movement is still very young, so there are many different designs available that require different amounts of tinkering to work and have vastly different capabilities. To help decide, I made a few requirements and decision points :
1. I must be able to print something that is at least 8"x8"x8". Print area is an important consideration and is one of the biggest influences on cost. With this print size I can make most prototypes, brackets, etc that we need. Larger parts can always be printed in sections and joined, but it's not the strongest or easiest thing to do. 2. Print material and method. There are printers that can print in many types of plastic and even in wood. Some printers fuse plastic in layers in an "addictive manufacturing" process. Others can fuse a liquid into a plastic with a process referred to as stereo lithography. Most consumer level machines with a large print area are the type that extrude plastic. There is a large matrix of advantages and disadvantages, but we will just leave it at this for now. 3. The final factor I considered is the development of the machine. Informally this is the "tinker factor." How much are you willing to modify and experiment with the machine to get increased versatility vs. how much do you want a machine that is a push button that just works? I've always been the tinkering type but there is a balance. Some more experimental and low cost machines are not as reliable as I would prefer, but something that is fully developed like the MakerBot line doesn't leave as much versatility. The other portion is the licensing of the software and hardware. I've always been a proponent of the free and open source movement. It's how we are going to advance science and technology. Companies like MakerBot are not fully open source and that just doesn't sit well as it prevents the community from fixing problems in a piece of equipment that was rather expensive.
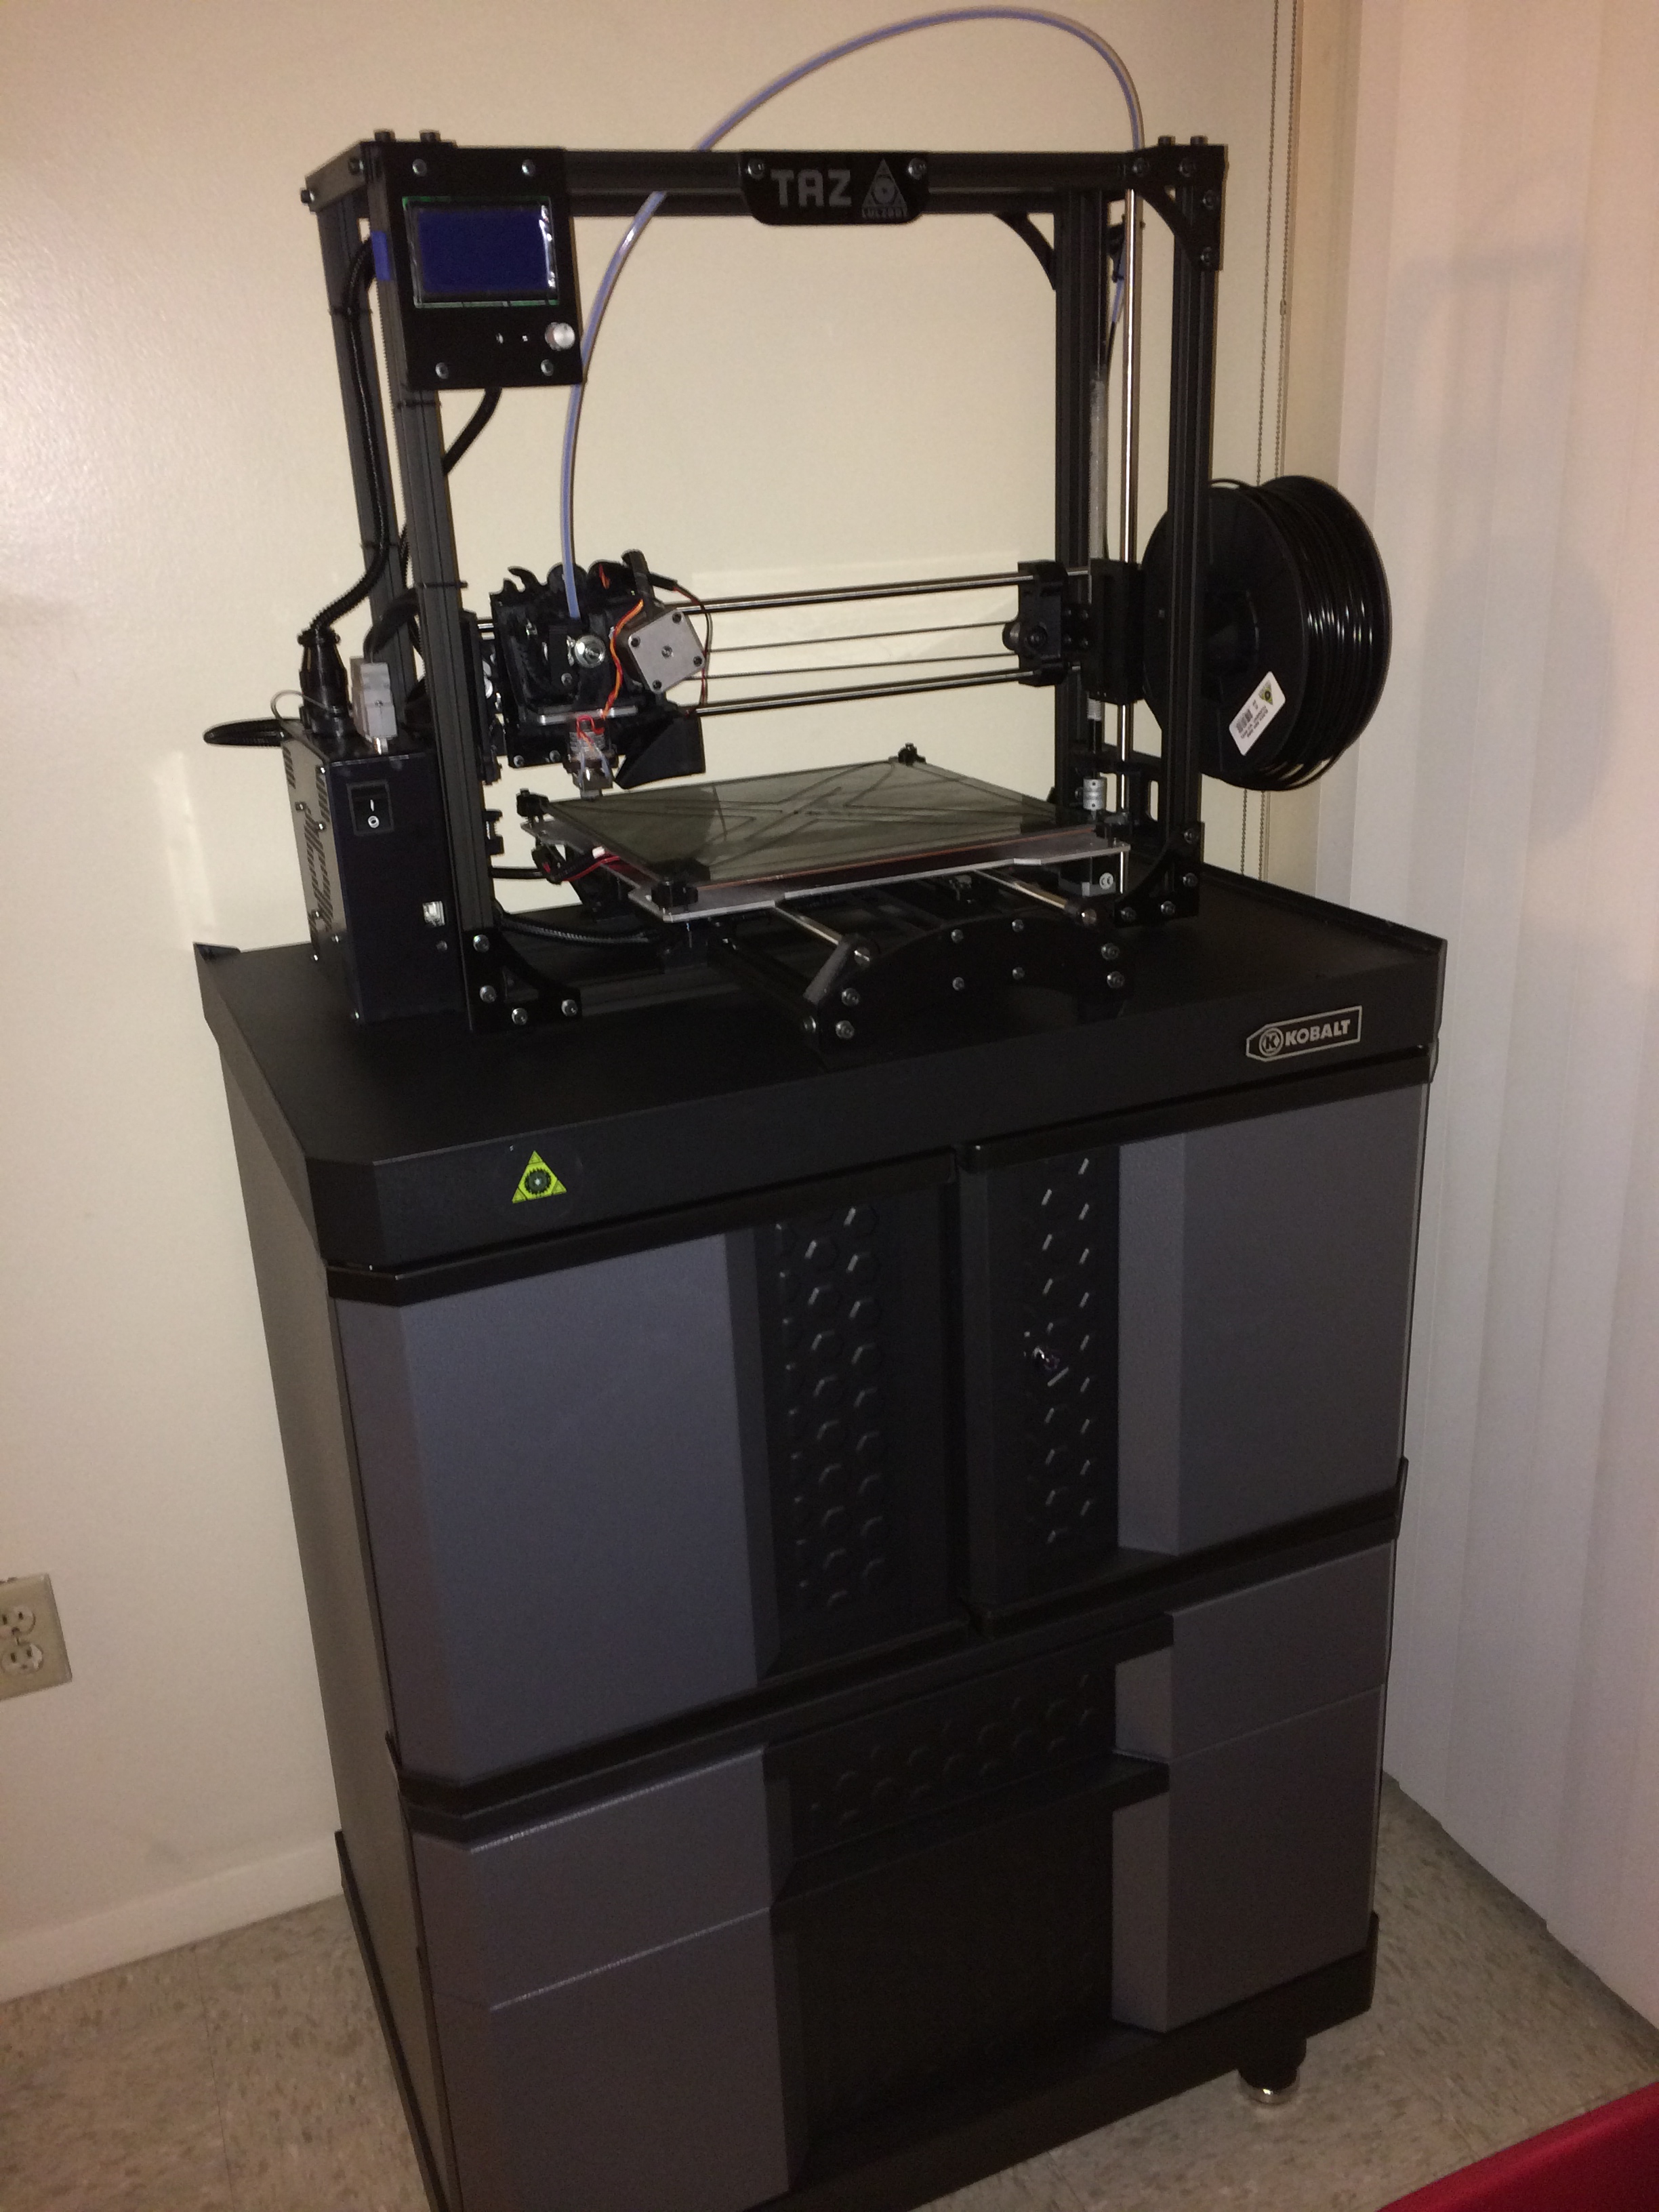
With all of those considerations and lots of research, I decided on the Taz 4 printer by Lulzbot. You can purchase the printer from Amazon, but I decided to purchase through Sparkfun Electronics since they are a small(ish) business that really supports education and the maker movement. I ordered the printer within a few hours of passing my comprehensive exams and it was on the way!
Setting up the printer
I received the printer and followed all of the setup instructions. This involved assembling the axes and removing the packing protection. I've never done this before, but overall it was very straightforward and took about 45 minutes. The next steps were what made me nervous.
To get quality prints the printer surface must be level with relation to the print head track. There are various end stops and leveling screws to adjust. Using a piece of printer paper as a gap gauge, I just followed the instructions and had the print bed leveled in about 20 minutes. There is also a test print pattern that prints two layers of plastic around the base plate to let you make sure the level is right on. Everything must be kept clean and adjusted as with any precision bit of gear, but overall I was impressed with the design.
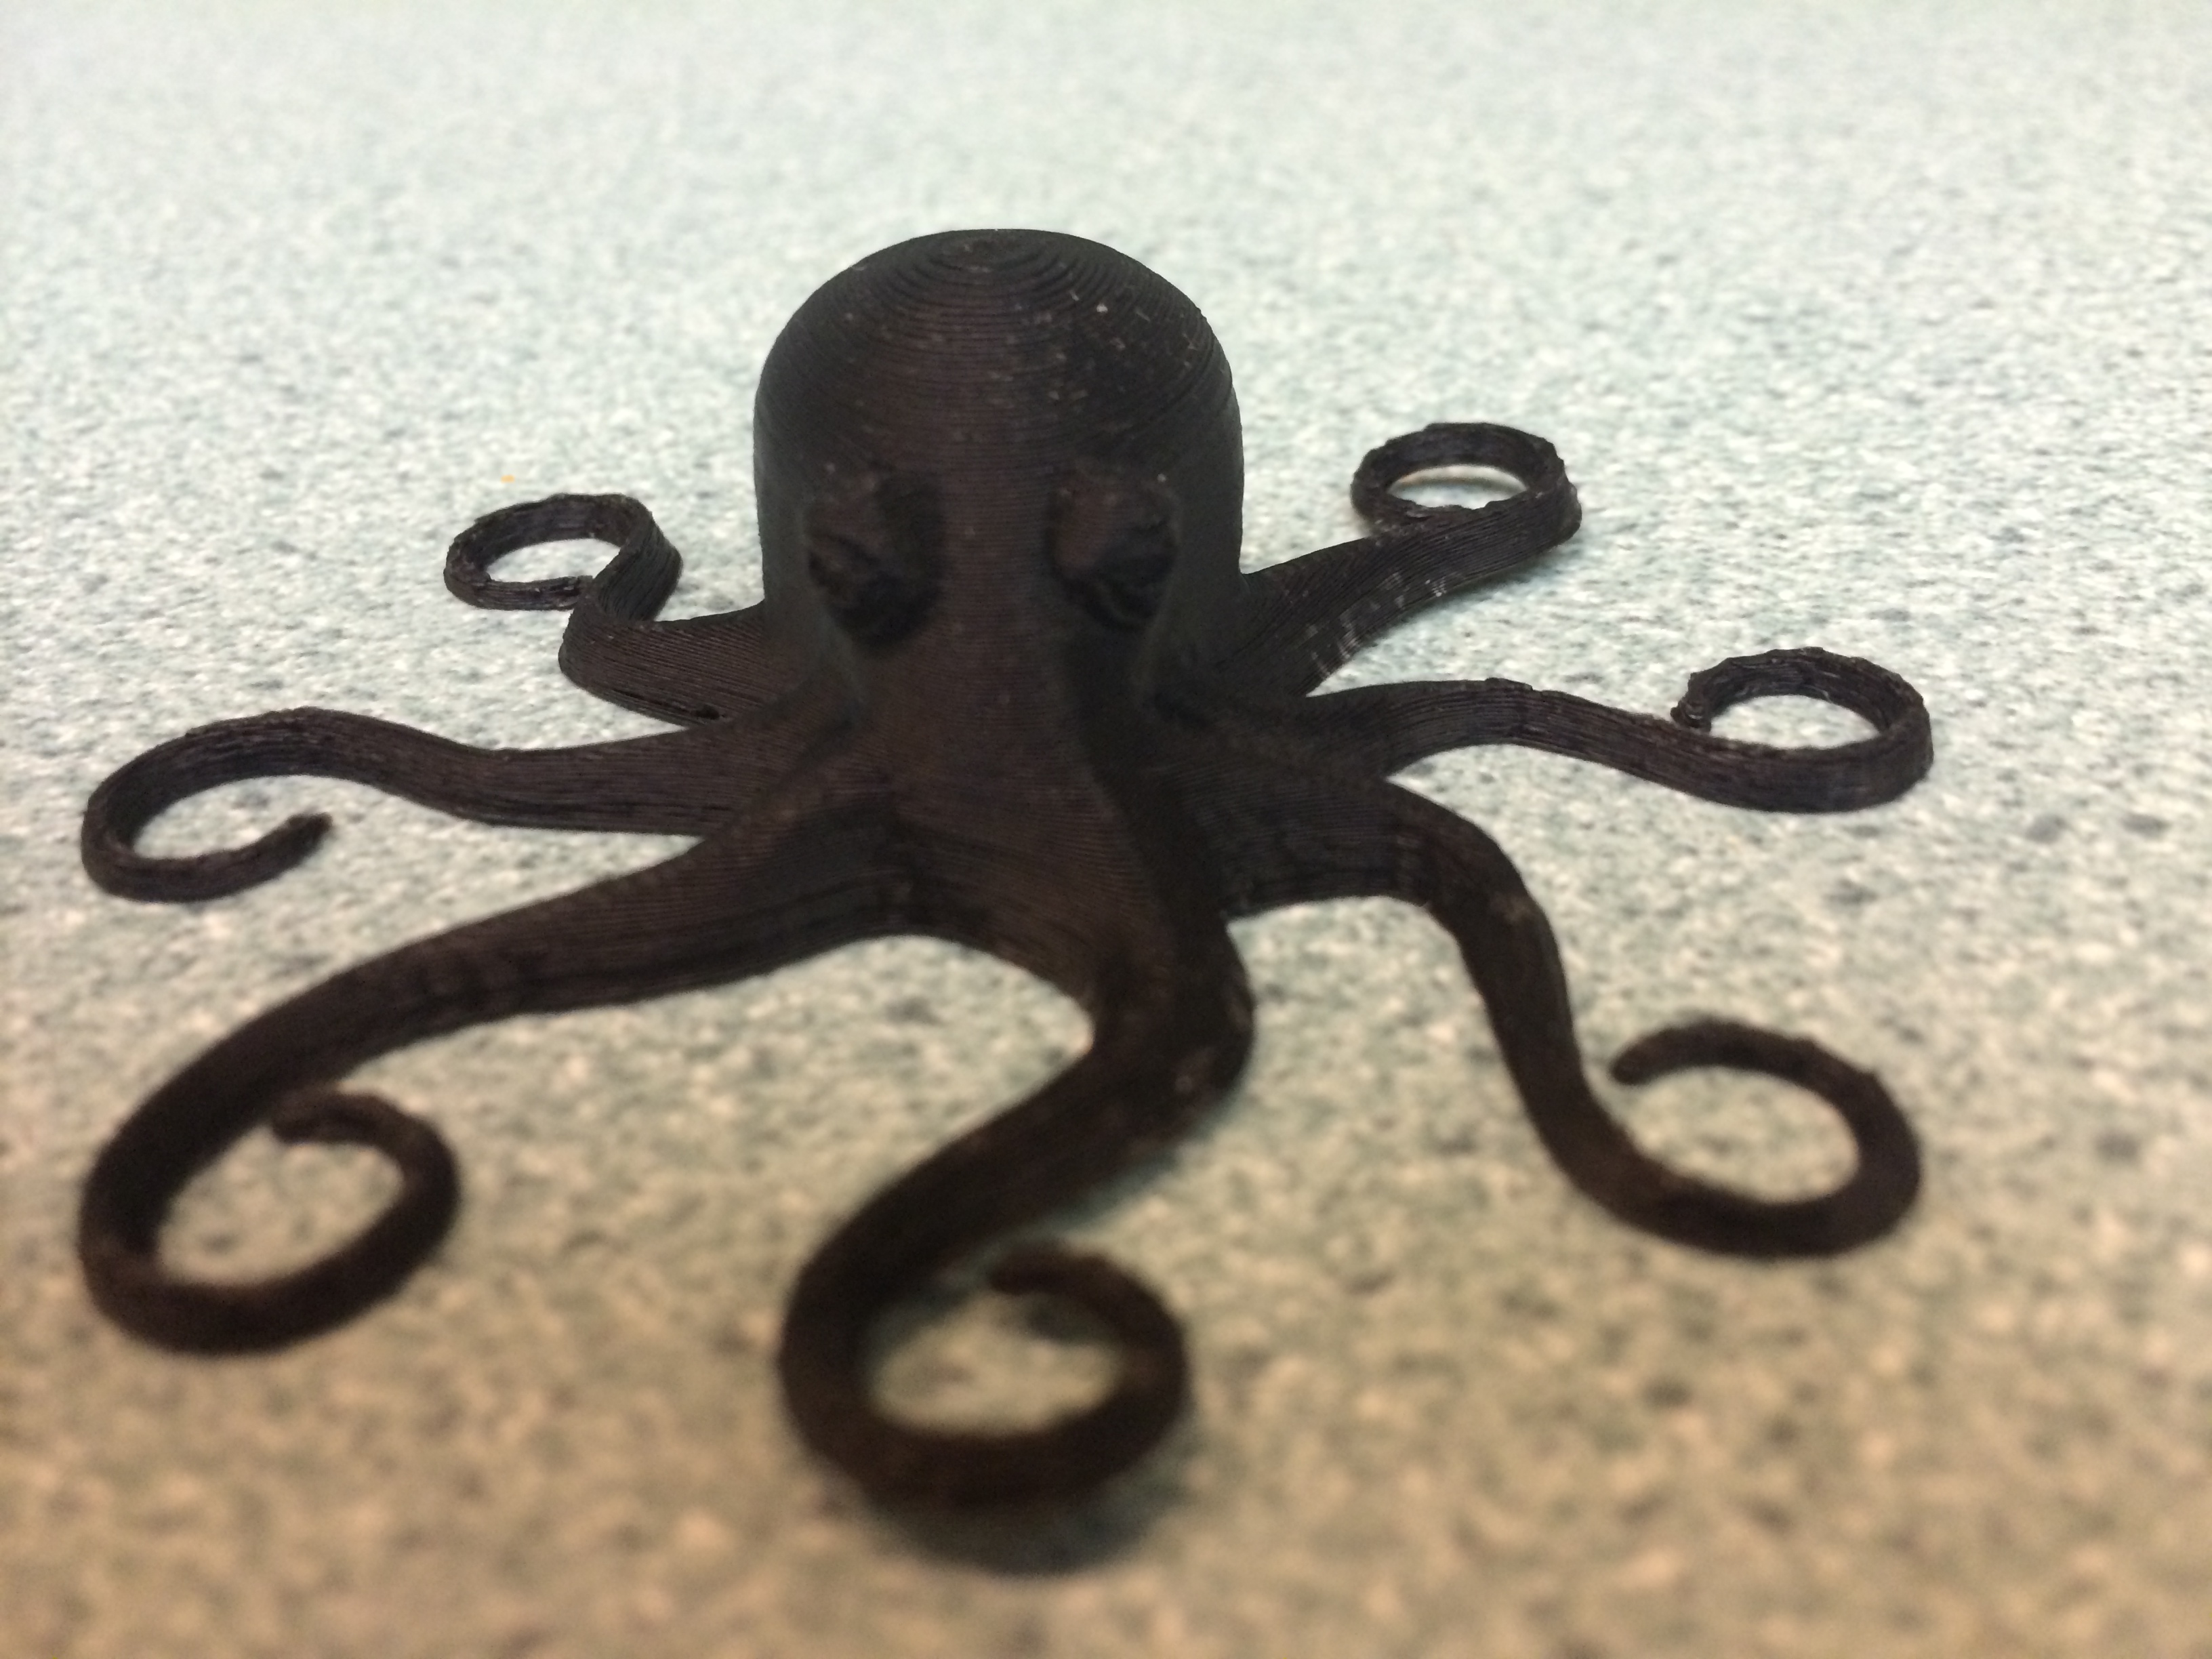
The printer ships with an octopus test print that was my first object. I loaded up the file and hit print. The printer ran for about an hour and at the end I had the print shown below!
What's Next
I've got some plans for what to print next. Currently I'm designing some new brackets to hold sensors in place during experiments and a few new parts like shields and pulleys to improve the quality of some of our demonstration apparatuses in the lab. I'm sure some of the results will end up as their own blog posts, but you can always see what's new by following me on Twitter (@geo_leeman). I also would like to thank Hess energy and Shell energy for their support of various aspects of these projects and of course the National Science Foundation for supporting me and many aspects of my lab research. Everything I've said is of course my own opinion and does not reflect the views of any of those funding organizations. Next post we will likely return to more general topics like seeing trends in data or go back and look at more Doppler radar experiments.
Update!
I was able to print my first laboratory parts, a set of brackets to make a magnetic holder for a displacement transducer. I will be posting the cad files to my github account under an open license.
Today I was getting a demo in the lab ready for a tour group and decided to try shooting a quick, unscripted bit on rocks as springs. There are a few generalized statements in here, but overall it is a first try at a public education video. Comments welcome!
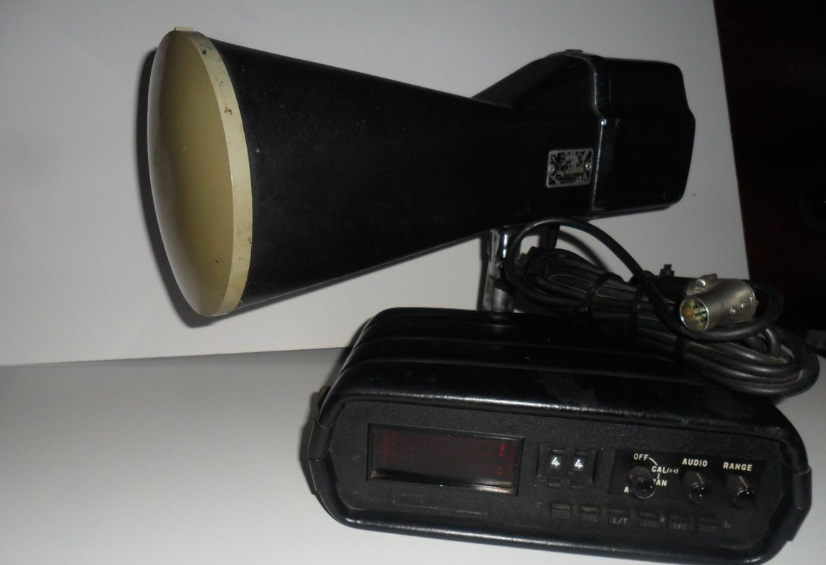
When you hear "radar", you probably think of weather radar and a policeman writing a ticket. In reality there are many kinds of radar used for everything from detecting when to open automatic doors at shops to imaging cracks in concrete foundations. I've always found radar and radar data fascinating. Some time back I saw Dr. Gregory Charvat modify an old police radaron YouTube and look at the resulting signal. I happened to see that model of radar (a 1970's Kustom Electronics) go by on EBay and managed to buy it. I'm going to present several experiments with the radar over a few posts. If you want to learn more about radar and the different types of radar I highly recommend Dr. Charvat's book Small and Short-Range Radar Systems. I haven't bought a personal copy yet, but did manage to read a few chapters of a borrowed copy.
The doppler radar I purchased. I'm not using the head unit.
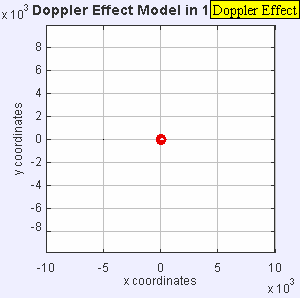
The radar I have outputs the doppler shift of a signal that is transmitted, reflected, and received. Doppler is familiar to all of us as we hear the tone of a train horn or ambulance change as it rushes past us. Since there is relative motion of the transmitter (horn) and receiver (your ears), there is a shift in received frequency. Let's say that the source emits sound at a constant number of cycles per second (frequency). Now let's suppose that the distance between you and the source begins to close quickly as you move towards each other. The apparent frequency will go up because the source is closer to you each emitted cycle and you are closer to the source!
The doppler effect of a moving source. Image: Wikipedia
This particular radar transmits a signal at a frequency of 10.25 GHz. This outgoing signal is continually transmitted and reflected/scattered off of objects in the environment. If the object isn't moving, the signal returns to the radar at 10.25 GHz. If the object is moving, the signal experiences a doppler shift and the returned frequency is higher or lower than 10.25 GHz (depending on the direction of travel). This particular radar can be easily hacked and we can record the doppler frequency out of a device called a mixer. The way this unit is designed, we can't tell if the frequency went up or down, just how much it changed. This means we don't know if the targets (cars) are coming or going, just how fast they are traveling. Maybe in a future set of posts, we'll build a more complex radar system such as the MIT Cantenna Radar. Be sure to comment if that's something you are interested in.
Since we'll be measuring speeds that are "slow" compared to the speed of light, we can ignore relativistic effects and calculate the speed of the object knowing the frequency change from the mixer, and the frequency of the radar.
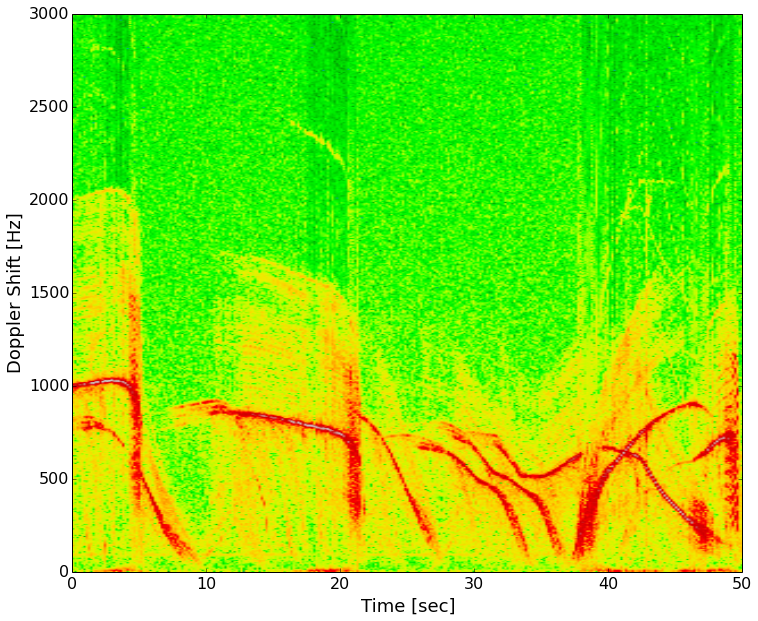
I took the radar out to the street and recorded several minutes of traffic going by, including city busses. Making a plot of the data with time increasing as you travel left to right and doppler frequency (speed) increasing bottom to top, we get what's known as a spectrogram. Color represents the intensity of the signal at a given frequency at a certain point in time.
Speeds of several cars on my street. 1000 Hz is about 33 mph and 500 Hz is about 16 mph.
The red lines are strong reflectors (the cars). Most of the vehicles slow down and turn on a side street in front of the radar. About 30 seconds in there are three vehicles, two slow down and turn, the third again accelerates on past. Next I'll be lining up a video of these cars passing the radar with the data and you'll be able to hear the doppler signal. To do that I'm learning how to use a video processing package (OpenCV) with Python.
In the next few installments, we'll look at videos synced with these data, radar signatures of people running, how radar works when used from a moving car, and any other good targets that you suggest!
UPDATE: John Meacham commented below letting us know that he has updated the package. It can now be installed with it's new features by installing the packages I mention below and then:
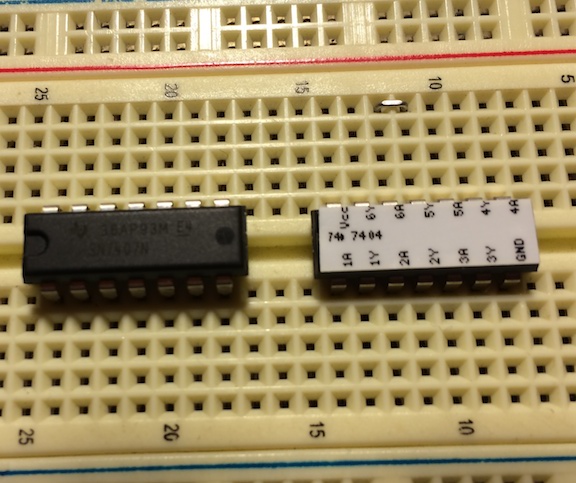
This is a topic of interest to a rather limited group, but one well worth posting I believe. Those who build electronic circuits regularly know the pain of constantly swapping back and forth between datasheets when trying to remember which pin of an integrated circuit does what. It's different for almost every chip and can slow down prototyping when you're on the fly or don't have internet access. John Meacham over at Not A Number decided to remedy this problem after noticing that 6mm tape from a Brother label printer fit perfectly on top of his chips!
You can find his Perl script over here, but I wanted to elaborate on how to get it working and my experience with it thus far. I ended up running the code on an Ubuntu virtual machine with Parallels. I had lots of problems getting the libraries needed to run on Mac OSX, but the Linux install took just a few minutes.
First, download and unzip the files from John's website. There is a read-me telling you how to run the scripts, but we don't get there just yet. First we must install the GD module for pearl and the cups-bsd for printing utilities. To do so, follow these two commands:
Okay, now we need to install our printer. Just plug in your Brother printer and follow the normal steps to install it just like any other device. Ubuntu automatically found the drivers for me and set it up.
Next I just printed out a 555 timer IC label to get started. My printer is called labelprinter, so the command was:
>>./print_png.prl -Plabelprinter -w 6 out/555.png
The label printed out! Now I did notice that sometimes there is some garbage at the beginning of the label, but I trimmed that off with scissors anyway. I do wish there was a way to prevent the printer from feeding and cutting after every label though, it wastes some label tape. There may be a way to modify the scripts.
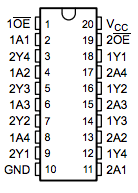
While there are a few included labels, you'll want to make your own eventually. This is done with YAML. Let's make a label for the 74LVC244A octal buffer/driver. First we'll look at the datasheet (here) and get the pinout. Below is the screen-shot of the datasheet spec.
We must write a YAML file to describe this pinout:
The / before the pin will add the overbar to indicate the active state of the pin. The YAML code is added to the file chips.yaml and we run the script:
>> ./chip_label.prl -c 74LVC244A
We now have a new label to print and affix to our chips!
There we go! Sorry this was a bit lengthy and technical, but this tool is incredibly useful for anyone involved with prototyping!