AGU Education Demonstrations

I recently got back from the American Geophysical Union meeting in San Francisco and wanted to try out adding some videos to the blog. The education section had a poster session during the last day of the conference that was on collection of data in real time in the classroom. Some of the demonstrations were very interesting and I thought it would be fun to share here. I didn't have my good HD camera at the conference, but I did have my iPhone.

That being said these are rather rough videos. If you think these are interesting be sure to say so and I'll try to take some better camera gear to conferences!

Demo 1: Mantle Convection

Using a set of cross driven PVC rollers Gary Glesener (UCLA) demonstrated a basic, historical plate tectonic model with his classroom Griggs apparatus. I got most of the explanation and demonstration on video.

Demo 2: Internal Waves

This demo used a small tank with saline water in the bottom and a layer of fresh water floating on top to demonstrate the standing waves setup at the density contrast. Then with two conductivity probes they show the passing wave and phase offset to allow students to calculate quantities such as the Brunt–Väisälä number. Again I think that most of the explanation is on the video. This is one of many demos from Dr. Jonathan Aurnou's group at the UCLA SpinLab.

Demo 3: The Geodynamo

The last demonstration was very interesting, but sadly I only have the explanation on video. Luckily I have video of a similar apparatus I built years ago to supplement! The idea was to show how rotating fluids in the Earth can create our geomagnetic field. That is rather difficult to show, but the inverse is pretty easy. It is also the basis for magneto-hydrodynamic propulsion. Below is the video of the project being explained and a video of my apparatus from many years ago. This is another UCLA SpinLab demo!


My old version of a similar idea:

LINKS!

UCLA Modeling Educational and Demonstrations Laboratory
SpinLab YouTube Channel
SpinLab Webpage


20 Years Since Northridge

FEMA_-_1807_-_Photograph_by_Robert_A._Eplett_taken_on_01-17-1994_in_California

Today marks 20 years since the famous Mw 6.7 Northridge earthquake.  In the early morning hours the earthquake hit the San Fernando Valley region of California and caused massive destruction.  In the 20 seconds of shaking there were around 60 deaths and over 8,700 injuries.

While the magnitude is strong, it really isn't that impressive.  What is impressive about this event is the accelerations and velocities involved.  The ground acceleration was up to 1.8g (~54 feet/second^2) and the peak ground velocity was the highest ever recorded at just over 6 feet/second (1.83m/s)!

Without going into all the details of the earthquake that are easily available, I would rather provide a news clip of the evening after the event and ask a question.  If you live in an earthquake prone region, do you have a disaster plan?

As you can see in the video, when gas mains are snapped and fires start there are only minutes to evacuate.  Take some time and put together a survival bag as well as talk to your family (especially children) about what to do during a disaster.  Even if you don't live in an area with significant earthquake hazard this is important to do with the upcoming severe weather season.  Some helpful links are provided at the bottom!

http://youtu.be/8Xg_mhA4ffA

Links

American Red Cross Survival Kit
Ready.gov Survival Kit
CDC Earthquake Health Information
FEMA Ready.gov  Earthquake Information
Earthquake Safety at Work

Exploding Ice and Rock - Booms Heard a Result of "Cryoseisms"

Ice Hanging From Rock

UPDATE 1/13/14: Frost-quake creates 100ft long crack here.

Over the past few days (starting around Christmas eve), there have been reports of large booming sounds associated with minor ground shaking across the northern states, as well as in Canada.  The Toronto events have a nice string of tweets that are associated with them as well.  Are these really explosions? Earthquakes? Sonic booms? The truth, as it turns out, is a rare event that produces what are known as "cryoseisms".  Oddly enough, these "frostquakes", as they are commonly known, have been discussed in the literature since about 1818!  Having a background in both meteorology and geophysics, cryoseisms are just one example of how closely related to two fields are.

So, what happens to produce such loud and potentially startling events? It's all about ice.  Cryoseisms occur when there are seasonal frost conditions, no insulating blanket of snow, lots of rain/thaw to saturate the ground, and a sharp drop in temperature.

Surface water penetrates into sufficiently permeable soil/rocks, but then is rapidly frozen with a fast drop in surface temperature.  Normally temperature drops slowly enough that the ice gradually freezes, giving the surrounding soil/rock time to adjust.  When really fast temperature drops occur and freezing is rapid, the surrounding areas are stressed by the expanding force of the ice.

The freezing process is actually a very powerful mechanism, and is one of the geologist's favorite ways to explain physical weathering of large boulders.  Freeze/thaw cycling has even been used as a quarrying technique in granite!

Expansion during this rapid freezing of infiltrated ground water stores energy in the surrounding rock/soil, like a spring, until..... BAM! Failure occurs in much the same way faults fail.  Here the driving force isn't tectonic though.

Cryoseisms can do light damage to structures in the immediate vicinity, but their intensity falls off very quickly with distance.  For the seismology buffs out there, the zero focal depth produces lots of surface waves, but these events are generally not recorded on seismic networks.

Want to know more about cryoseisms? The literature isn't too robust, but check out Barosh (2000), Nikonov (2010), and Voss & Herrmann (1980) for some starting points!

*Cryoseism is also used to refer to earthquakes at the base of glaciers as well.  That's a whole other story for another day!


Favorite Books and Products of 2013

This year, like every other, was full of lots of great, okay, and no so good things. Being the list-oriented person that I am, it seemed appropriate to list out great things of the year. While there were many things that could go here (favorite trips, etc), I thought keeping with the orientation of the blog we should look at the favorite books and products of the year. Not all of these came out in 2013, but I discovered them all in 2013. Without further delay:

Favorite Books

In Suspect TerrainIn Suspect Terrain - John Mcphee
This book reads like a novel, but gives massive geologic context. It is part of a series that I will continue reading this year. If you are curious about the geologic history of the east, this gives a driving cross-section and great context.

Scientific PresentationsThe Craft of Scientific Presentations - Michael Alley I was fortunate enough to attend my 2nd Michael Alley workshop this year and gained much from both it and his book. Dr. Alley is a phenomenal person that is full of energy. His presentation advice helped me give an AGU talk, as well as successfully pass my candidacy exams (those should probably be posts).

EE 101Electrical Engineering 101 - Darren Ashby I've seen this book for quite some time, but decided to give it a read and see what it was like. Overall it was a great intro to electronics for new-comers and a good review for those who, like me, perform lots of electronics hobby work, but are not professional engineers. A few of the analogies were somewhat wrong at anything more than the basic level, but that's what they were there for.

GuesstimationGuesstimation: Solving the World's Problems on the Back of a Cocktail Napkin - Lawrence Weinstein A fun read that helps speed up your order of magnitude estimation capabilities. These were great lunch-hour exercises.

Command and Control


Command and Control: Nuclear Weapons, the Damascus Accident, and the Illusion of Safety - Eric Schlosser Having lived in Arkansas for most of my life, this book was of interest to me. I was quite surprised at just how unsafe much of the nuclear arsenal was and how many close calls we have had.

Feynman's RainbowFeynman's Rainbow: A Search for Beauty in Physics and in Life - Leonard Mlodinow Recommended to me by a professor in the department, this was a quick read that gave an outside look at the life of Richard Feynman from one of his colleagues. A must for any Feynman fan or general physics reader.

Data PointsData Points: Visualization That Means Something - Nathan Yau Another stellar book from Natan Yau of flowingdata.com. Great advice on presenting complex data in an easy to digest form.

Zen


Zen and the Art of Motorcycle Maintenance - Robert M. Pirsig Sometimes I will read a classic, and this did not disappoint. Very quotable and very enjoyable.


Favorite Products

Timbuk2Timbuk2 Classic Messenger Bag I didn't want to carry my leather briefcase throughout Italy and Holland this summer, so I ended up with this bag. I can't say enough about how durable it is and what a great traveling companion it makes. I have notice many geoscience folks carry these and believe that they should sponsor AGU.

Blackwing 602Palomino Blackwing 602 Pencils A post in the "How I Work Series" mentioned these and I must say that they are the darkest pencils I've seen. I generally use pen in my notebooks, but these are great replacements.

Beaglebone


Beaglebone Black This is the new small/embedded computer design. I'm implementing them in my infrasound bucket project and in a few others.

Hakko


Hakko FX-888D Soldering Station This is my new go-to soldering station for those of us on a budget.


USRP Software Defined Radios While expensive, I got to use some of these in a recent project and make a radar out of them!
USRP

What did I miss?

Earthrise - 45 Years Ago Today

Earthrise Photograph

The famous "Earthrise" photograph.

On December 24, 1968 one of the most powerful photographs of our time was captured. Today being the 45th anniversary of this event, I thought a brief look back would be fitting. The crew of Apollo 8 (Borman, Anders, and Lovell) were just finishing their fourth lunar orbit when they saw an awe inspiring sight. Due to a roll maneuver being executed by the spacecraft, the Earth came into view out of the window. As the astronauts were just coming around from the far-side, the Earth was rising over the lunar terrain! This was a sight that nobody had seen before. There was a scramble for film, first a black and white photograph, then finally a color photograph as the capsule rotated further and the event came into view of another window. Listening to the crew conversation is very interesting as they hurry to photograph the event with their Hasselblad 500EL. The "Earthrise photo" is more officially known as NASA photo AS8-14-2383.

The scientific visualizations team from NASA have done a fantastic job putting together a short video showing the events that transpired with syncronized crew voice recordings. By using photos from the recent Lunar Reconnisance Orbited (LRO) and a timed camera on Apollo 8 they have even determined the exact orientation of the spacecraft during these events. I highly recommend watching it! This greatly reminds us of the sentiment Eugene Cernan expressed later in the program: "We went to explore the moon, and in fact discovered the Earth."

Blog and Website are Now One!

Hello everyone! Notice anything new? I’ve combined my blog (formerly at http://madscientistatlarge.blogspot.com) and academic website into this new wordpress powered site.  The old blog will remain up for awhile so that other sites can change their links, but all new content, publications, and updates will be posted here! Please be sure to update your RSS feeds and links.  Also don’t worry about the old content; all articles and comments have been migrated to this page.  I would like to update this blog with more short posts that are more frequent.  As always please be sure to send/comment any feedback!

Communicating Science: The Lost Art of the "Chalk Talk"

During this semester our lab group has been holding a weekly seminar in which everyone gets together to hear about the latest and greatest that other members of the group are doing.  In a group with multiple professors and many students it is easy to lose track of what is happening in the lab on a daily basis!  When organizing the meetings it was suggested that the presenter of each ~40-50 minute talk use only the chalk boards, no slides, no handouts.  While there was much grumbling from the group, I was rather excited at the idea of giving such a "naked" talk, and it turns of so was one of the great physicists: John Wheeler. Wheeler was famous for going into the lecture hall before his talk and covering the chalk-boards with very nice color diagrams, then walking through them.  Here I am going to discuss my attempt and giving a John Wheeler style talk, and why you should as well.

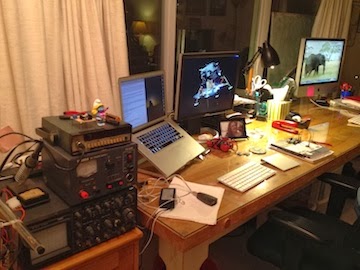
John Wheeler giving one of his famous talks with colorful hand-drawn illustrations.

For my talk, I was going to be discussing electrical phenomena surrounding earthquakes such as radio emissions and earthquake lights.  After some background I wanted to discuss some laboratory experiments I've done and propose a model to explain the data.  A few challenges were immediately apparent:

1) I can't show exact data plots or scatter plots with many hundreds of data-points.
2) Showing photographs isn't an option.
3) There is no room for all the content that would have been in a slide presentation.
Having just attended a workshop by Michael Alley on "The Craft of Scientific Presentation," many of these "challenges" resonated with things that presenters do, but shouldn't.  We often overload our audience with information: many words on a slide, complex plots, and us speaking fast to beat the buzzer.  We also depend on our slides to guide our talk instead of having the "story" and path well developed in our heads and just using the slides as visual aids.  Dr.Alley even mentioned that one of his favorite slides is the plain black slide, because then the focus is on the presenter and their words.  
In preparing the chalk-talk I thought about how to tell my story, wrote that down, then decided what visual aids would be helpful.  I drew a sketch of those aids by the notes I had just made and then began cutting many of them.  The drawings on my paper would have taken the chalkboards in the room times two! I didn't want to erase anything and draw in real-time for two reasons: it wasted time that we could be talking about science and it didn't let me draw intricate diagrams.  In the end I drew the final set of diagrams on a separate piece of paper and only had one word list in the introduction to help make a point about the diversity of natural observations.
The morning of the talk I went to the room about an hour before people would be arriving with two boxes of chalk (one plain white and one of many colors).  I spent the hour drawing the figures, erasing, drawing again, refining, removing, etc.  Drawing some data plots was difficult, but let me get away from the audience worrying about noise and other artifacts.  By being able to emphasize the important points in the data it made the plots less confusing for the audience.

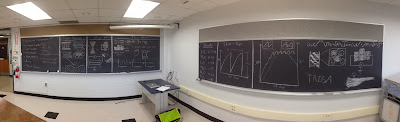
The entire talk.  I walked around the boards and presented for about 50 minutes.

During the talk I just walked down the boards and talked through the points I had outlined without bulleted lists.  Doing so I noticed a few things:

- The audience eye-contact was just incredible.  Instead of looking at my slides and reading words, examining detailed plots, or other distractions there was a lot of focus on the topic matter.
- The style of the presentation was very relaxed and let me steer the talk dynamically.  Unlike slides that fix you into a path from the moment you click "Show Presentation," I could adjust the level on-the-fly as the audience showed interest or got lost.
- Making the diagrams made me notice things in my data when looking for ways to simplify it.
- Preparing for this talk I learned where gaps in my knowledge were because I refused to rely on pulling figures directly from a paper as we often do in making slides.

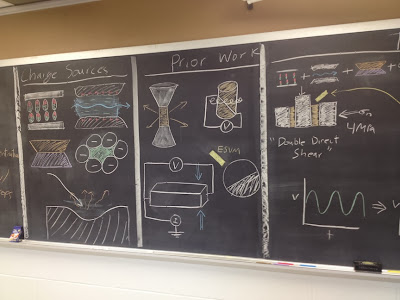
My attempt at summarizing about 20 minutes of talking points in diagrams alone.

Overall the talk was very well received and I got some great feedback on the research.  The biggest drawback was also one of the advantages: plots.  Though my simplified drawings made understanding easier for the audience, my drawing skills also caused some questions that were on "artifacts" in my art skills, not the data.  When drawing a time series, making sure things were precisely lined up was a bit tricky, but showing a real plot would probably introduce more confusion due to the complication.

Next time you have to give a talk to a small group in a classroom you should try a chalk-talk! They are simple and I think you'll be pleasantly surprised at both your own understanding and the reaction and engagement of the audience.  If you do, let me know how it goes!

Liquid Cooled Laptop Stand

This is going to be a short post that was requested during the LifeHacker "How I Work" feature.  In the post (here) I had mentioned my custom laptop stand that has an automotive transmission cooler and there was some interest in its construction.  Since moving I haven't hooked everything (fluid and such) up, so I did make any thermal profiles of the stand, but maybe at some point I'll attach some thermocouples and so just that.  Regardless, here are a few photos and some construction notes.

First off I should state the purpose and design requirements of the stand.  I wanted a stand to that the laptop monitor would line up nicely with my second monitor and wasn't made of books.  At the time I was running lots of rather intensive thermal models and gridding some large data sets, so that my laptop would be running very hot with the fans full blast for anywhere from 5-20 hours straight.  To keep it running a bit cooler I decided to build the stand of something thermally conductive, Aluminium was a good choice since that's what the laptop case is made of and it looks nice.  It's also not bad at conducting heat!
The stand was designed to hold the laptop screen at the same level as my second monitor and give a nice angle of viewing.

I bought some Al sheet a Lowe's, as well as a small strap of metal, and some "L" shaped material.  The channel makes the supports for the sheet and the runners on the desk.  I left them long incase I decide to mount the fluid tank and pump back there.  So far I haven't found a setup that is quiet and that fits in the space.  I will try again soon, but I've played with pumps and small aquarium tanks in the past.  

Using a sheet metal shear and brake I cut and bent the top plate to hold my laptop.  Be sure that the rubber feet on the bottom of the computer are off the stand, we want metal-metal contact for the best heat transfer!
So there were no screw heads to scratch my laptop, I used adhesive to mount the top plate to the frame.  The frame was assembled with nuts and bolts, then set on plastic feet to prevent scratches to the glass desktop.  
Next I made the stand match the computer a bit better by giving it a brushed Al finish instead of shiny metal.  A wire polishing wheel attached to the drill gave a nice, but time consuming finish to the entire stand.  
To further the cooling I wanted to mount a heat-sink to the bottom of the stand.  It so happened that I found a great solution at the automotive store that would allow for liquid cooling! A small generic automotive transmission cooler add-on kit (about $25 at the time) provides lots of surface area and a nice look.  The cooler is mounted with JB-weld and seems to get nice and warm when I'm working the laptop.  I'll probably inject some thermal grease to increase the coupling even more.

The transmission cooler on the bottom of the stand.

The surface where the computer sits.  
  This was a really fun little afternoon project and its not done yet! Eventually I'll run onto a tank/pump combo that I like and will fit onto the stand.  I'll mount it and use some colored water to give a nice effect when I'm cooling.  The easiest control mechanism is a small temperature sensor that turns the pump on and off as necessary to maintain a set-point.  When that happens, I'll be sure to post and update.  
To William (the commenter that requested some details of my stand): Sorry this took so long! The LifeHacker article went live not long before I took my candidacy exam! 
As always feel free to comment/email questions!

Quick Test of Geophone Response

I just wanted to post a quick article about geophones.  Geophones are essentially instruments that allow us to measure the velocity or acceleration of the ground.  Yes, seismometers do this, but generally when we refer to geophones we are talking about single sensor (almost always vertical sensing) devices used for seismic imaging in oil/gas exploration.  I've talked about seismic surveys before (here for example). The "element", or the actual sensor is pictured below.  These sensors have a magnetic element on a spring inside a coil of wire.  Motion of the magnet (resulting from ground motion) generates a small electrical potential in the coil.  If I can find a cheap element/case on eBay I'll do a teardown of one in the future.  The signal generation happens through a process called "electromagnetic induction", described by Michael Faraday in 1831!  Want to know more about induction? Head over to the wikipedia page or shout out and we can put together a demonstration.

Dr. Ammon, whose office is next door, brought over an old element that he wanted to compare with our seismometers in the basement of the building.  Not knowing the output voltage range well, we hooked it up to a Rigol DS1102E oscilloscope on my desk.  I set the trigger of the oscilloscope (when it started collecting data) to just above ground potential so that any appreciable motion will trigger data recording.  We recorded the voltage output of the sensor about 6800 times per second!

The sensor element from a geophone.  (Image: Ebay)

Below is the waveform collected from hitting my desk with moderate force.  Surprisingly these elements put out +/-4 Volts! When shaking the element to it's limits we were seeing voltages of around +/- 10 Volts.  To me this indicates there are many turns in the coil and a very strong, probably rare earth, magnet inside.  Measurement of the coil resistance or a teardown will tell if this is correct! I've also included the power spectral density for those of you interested.  These figures tell us about the frequency response of the instrument.  Depending on how the spring system is setup, the oscillator is very sensitive to some frequencies and not so sensitive to others.  These diagrams help us characterize this response.  

Collected waveform from hitting my desk.
Power Spectral Density

Power Spectral Density: Zoomed in

Sorry for the short post, but I just wanted to share a quick desktop experiment!

The Infrasound Bucket - Part 1 - Hardware

I'd like to write a short series of posts describing my setup of the infrasound unit I've written about before.  This is the same unit we used to look at traveling acoustic energy from the Russian meteorite and will soon use to examine earthquakes! Placing the unit inside my office or even inside the apartment proved to be very noisy as I saw every time someone opened or closed a door!  The makers (Infiltec) suggested that I put it outside, maybe in a drink cooler to shield it from the weather.  I did exactly that (photos below), but the cooler turned out to not be water proof and had about 2 cm water standing in the bottom when I checked it after a small storm.  The data quality while the instrument was outside was amazing though, with seismic signals coming through very clearly.  It was time to design a new system that would: 1) Be safe to leave outside in the weather, 2) Not have thick data cables running inside to a computer, 3) Would not require an inside computer, and 4) Would automatically post the current data online.

For the first post we're going to talk about the casing setup and mounting of all the vital hardware.  One weekend we decided to go wandering about Home Depot to find a suitable shell for the instrument as well as pickup a few other essential supplies.  Lendi had the flash of inspiration that we should use a 5-gallon plastic bucket... the ones at the Home Depot "Homer's All Purpose Bucket" even have an O-ring seal on the lid.  Perfect.

A built in O-ring seal on the bucket.

Now to figure out how to hold the hardware up off the bottom of the bucket.  In an ideal world this isn't needed, but in reality water may get in and I don't want it covering electronics thrown in the bottom of the bucket.  We used 1/4" plywood cut to a keystone shape that just fits the vertical profile of the bucket.  Adding two "L" brackets from the shelving section meant for ~$15 we had the shell and left over plywood.
Test fitting the plywood into the bucket.  Notice the cooler in the background that formerly housed the instrument.

I bolted the infrasound unit to the wood by using "plumber's tape" or metal strap with holes down its length.  This isn't the most elegant solution, but it meant no drilling the infrasound case which is semi-sealed on its own.  It is also very easy to get the unit out for any maintenance.   My RaspberryPi ended up having problems on the circuit board, so I've bolted a Beagle Bone Black to the board as well.

Front of the mounting board.  Infrasound unit (right), Beagle Bone (left), and power plugs (top left).

Rear of the mounting board with power passthrough.  

With no tall standoffs handy I made use of locking nuts, washers, and other assorted 4-40 hardware.

Two holes were drilled in the side of the bucket: one for the power and one for the air tube to the infrasound instrument.  I passed the power cable through (outdoor zip cord) through as well as clear plastic tubing and sealed it with bathroom silicon sealant.  I'd recommend sealing on the inside and outside of the bucket bulkhead.  Make sure to leave extra cable and tube for drip loops. A drip loop like structure was fashioned on the outside of the bucket to ensure no rain would blow up the tube into the unit.  We taped the tube down and then ran beads of silicon to secure it to the bucket.  After the sealant dried we moved the tape and secured the rest of the tubing.

Power and air tube sealed into the bucket and loops to prevent water flow.

Inside the bucket: notice the power plug.

In later posts we'll talk about how the power is actually provided and such, but the part that pertains to the hardware is the mounting of two binding posts on the plywood at the standard 3/4" spacing.  This allows us to power the board from a banana jack on the bench for testing or operationally in the bucket.  I drilled a passthrough hole to send power from the back of the jacks to the front of the panel.

Initially I built a 5V regulator to power the computer with from an LM7805 linear voltage regulator, but this was indeed a poor choice.  Even with a decent heat sink, the chip still got blistering hot when I was drawing 700mA (of the 1000mA rated power).  Considering this would be outside in the summer heat and the fact that I didn't want the failure point of a mechanical fan I decided to use a buck voltage converter.  Linear regulators dissipate all extra power as heat.  For example: I was feeding 12VDC to the converter with a 700mA load running at 5VDC.  That means that (12V-5V)*0.7 = 4.9 Watts of power was being turned into waste heat! No wonder, remember we think of watts as energy/time (Joules/second actually).  That's a lot of wasted electricity and really just a complication to our design, but it was very clean power.

The old linear regulator.  It's now awaiting a new use in the parts bin.

The buck converter is a switching type regulator.  I don't want to get into how switching regulators work current, but it's an interesting topic and you should have a read on the theory if you like.  I bought a small unit (P/N 1385) from Adafruit that is rated to 3A (though it gets warm there).  The power isn't quite as clean from this switching supply, but it's fine for out use here.  It works great with the Beagle Bone and provides lots of extra power for 5V accessories.  Don't want to order and ship from Adafruit? You can get the exact same thing from a model shop.  They are called "battery eliminator circuits" and allow modelers to plug their airplane, car, etc servo electronics (5VDC operation) into a 12V battery they already have in their kit.  Just clip the 3 pin servo plug off the end and you are ready to go.  Don't forget good soldering practice and to use heatshrink tube! Shorts could spark a fire, which we don't want.

The "battery eliminator circuit" or my 5V buck converter to supply 5VDC to the Beagle Bone.

So there it is! Next time I'm going to talk about setting up the power and network infrastructure.  Maybe even the serial communications! We're going to try to avoid using a serial-USB converter since the Bagle Bone has only one USB port (that I'm using for a WiFi adapter), I don't want to use a hub, and it's a chance to learn about signal level shifting and wire into that temping header on the board.

Everything fit into the bucket nicely and powers up from the bench power supply.