
Again we have a short project post in-between the posts of the open science series (part 3 coming soon)! This time I want to share a fun little project involving cheap drones and an instrument pack that I designed on top of the Light Blue Bean module. The pack uses an HTU21D temperature/humidity sensor and a BME180 pressure sensor. I designed the board in the open-source PCB/EDA tool KiCAD. Should you want to reproduce the boards, the files to send off to a board house are available on a GitHub repository here.
I designed the pack to be a measurement device for a home, truck, or airplane of the weather enthusiast or storm chaser. Ideally it will send the data to a smartphone/tablet that then sends it out to the web or lets you do whatever you want with it. It was also a good excuse to play with the bean after hearing about it. While delivering another product to a friend, we decided to strap this sensor to a small and cheap ($33) drone and see what happened. We got some vague data, but the drone didn't get over a few meters high due to the high load. Zip ties provided some protection on takeoff/landing.
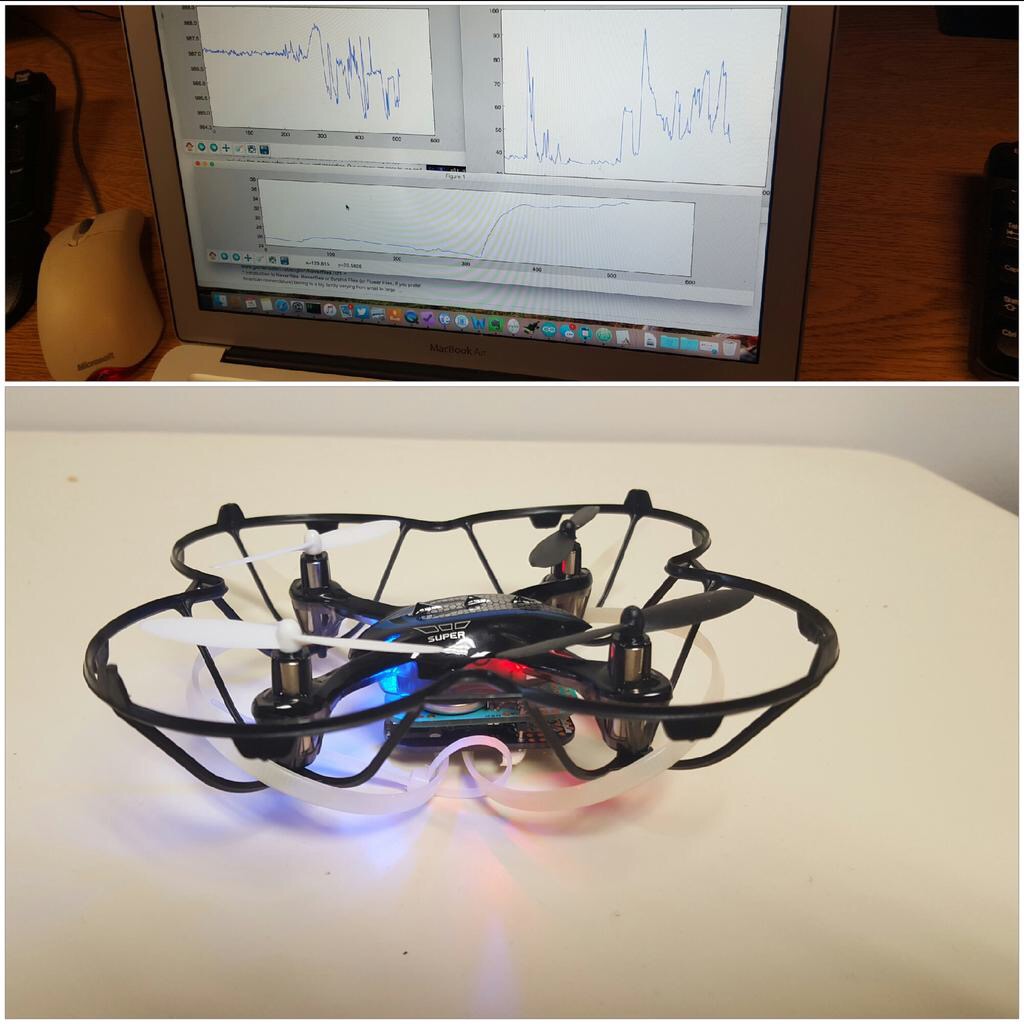
Our initial test flight with some quick plots in the background.
After playing we though it would be fun to do this on a drone with some more power. I grabbed a $55 drone (Syma X5C) on eBay and gave it a shot. After a couple of test flights I just couldn't get the bluetooth link to stay connected at the distances I wanted (50m).
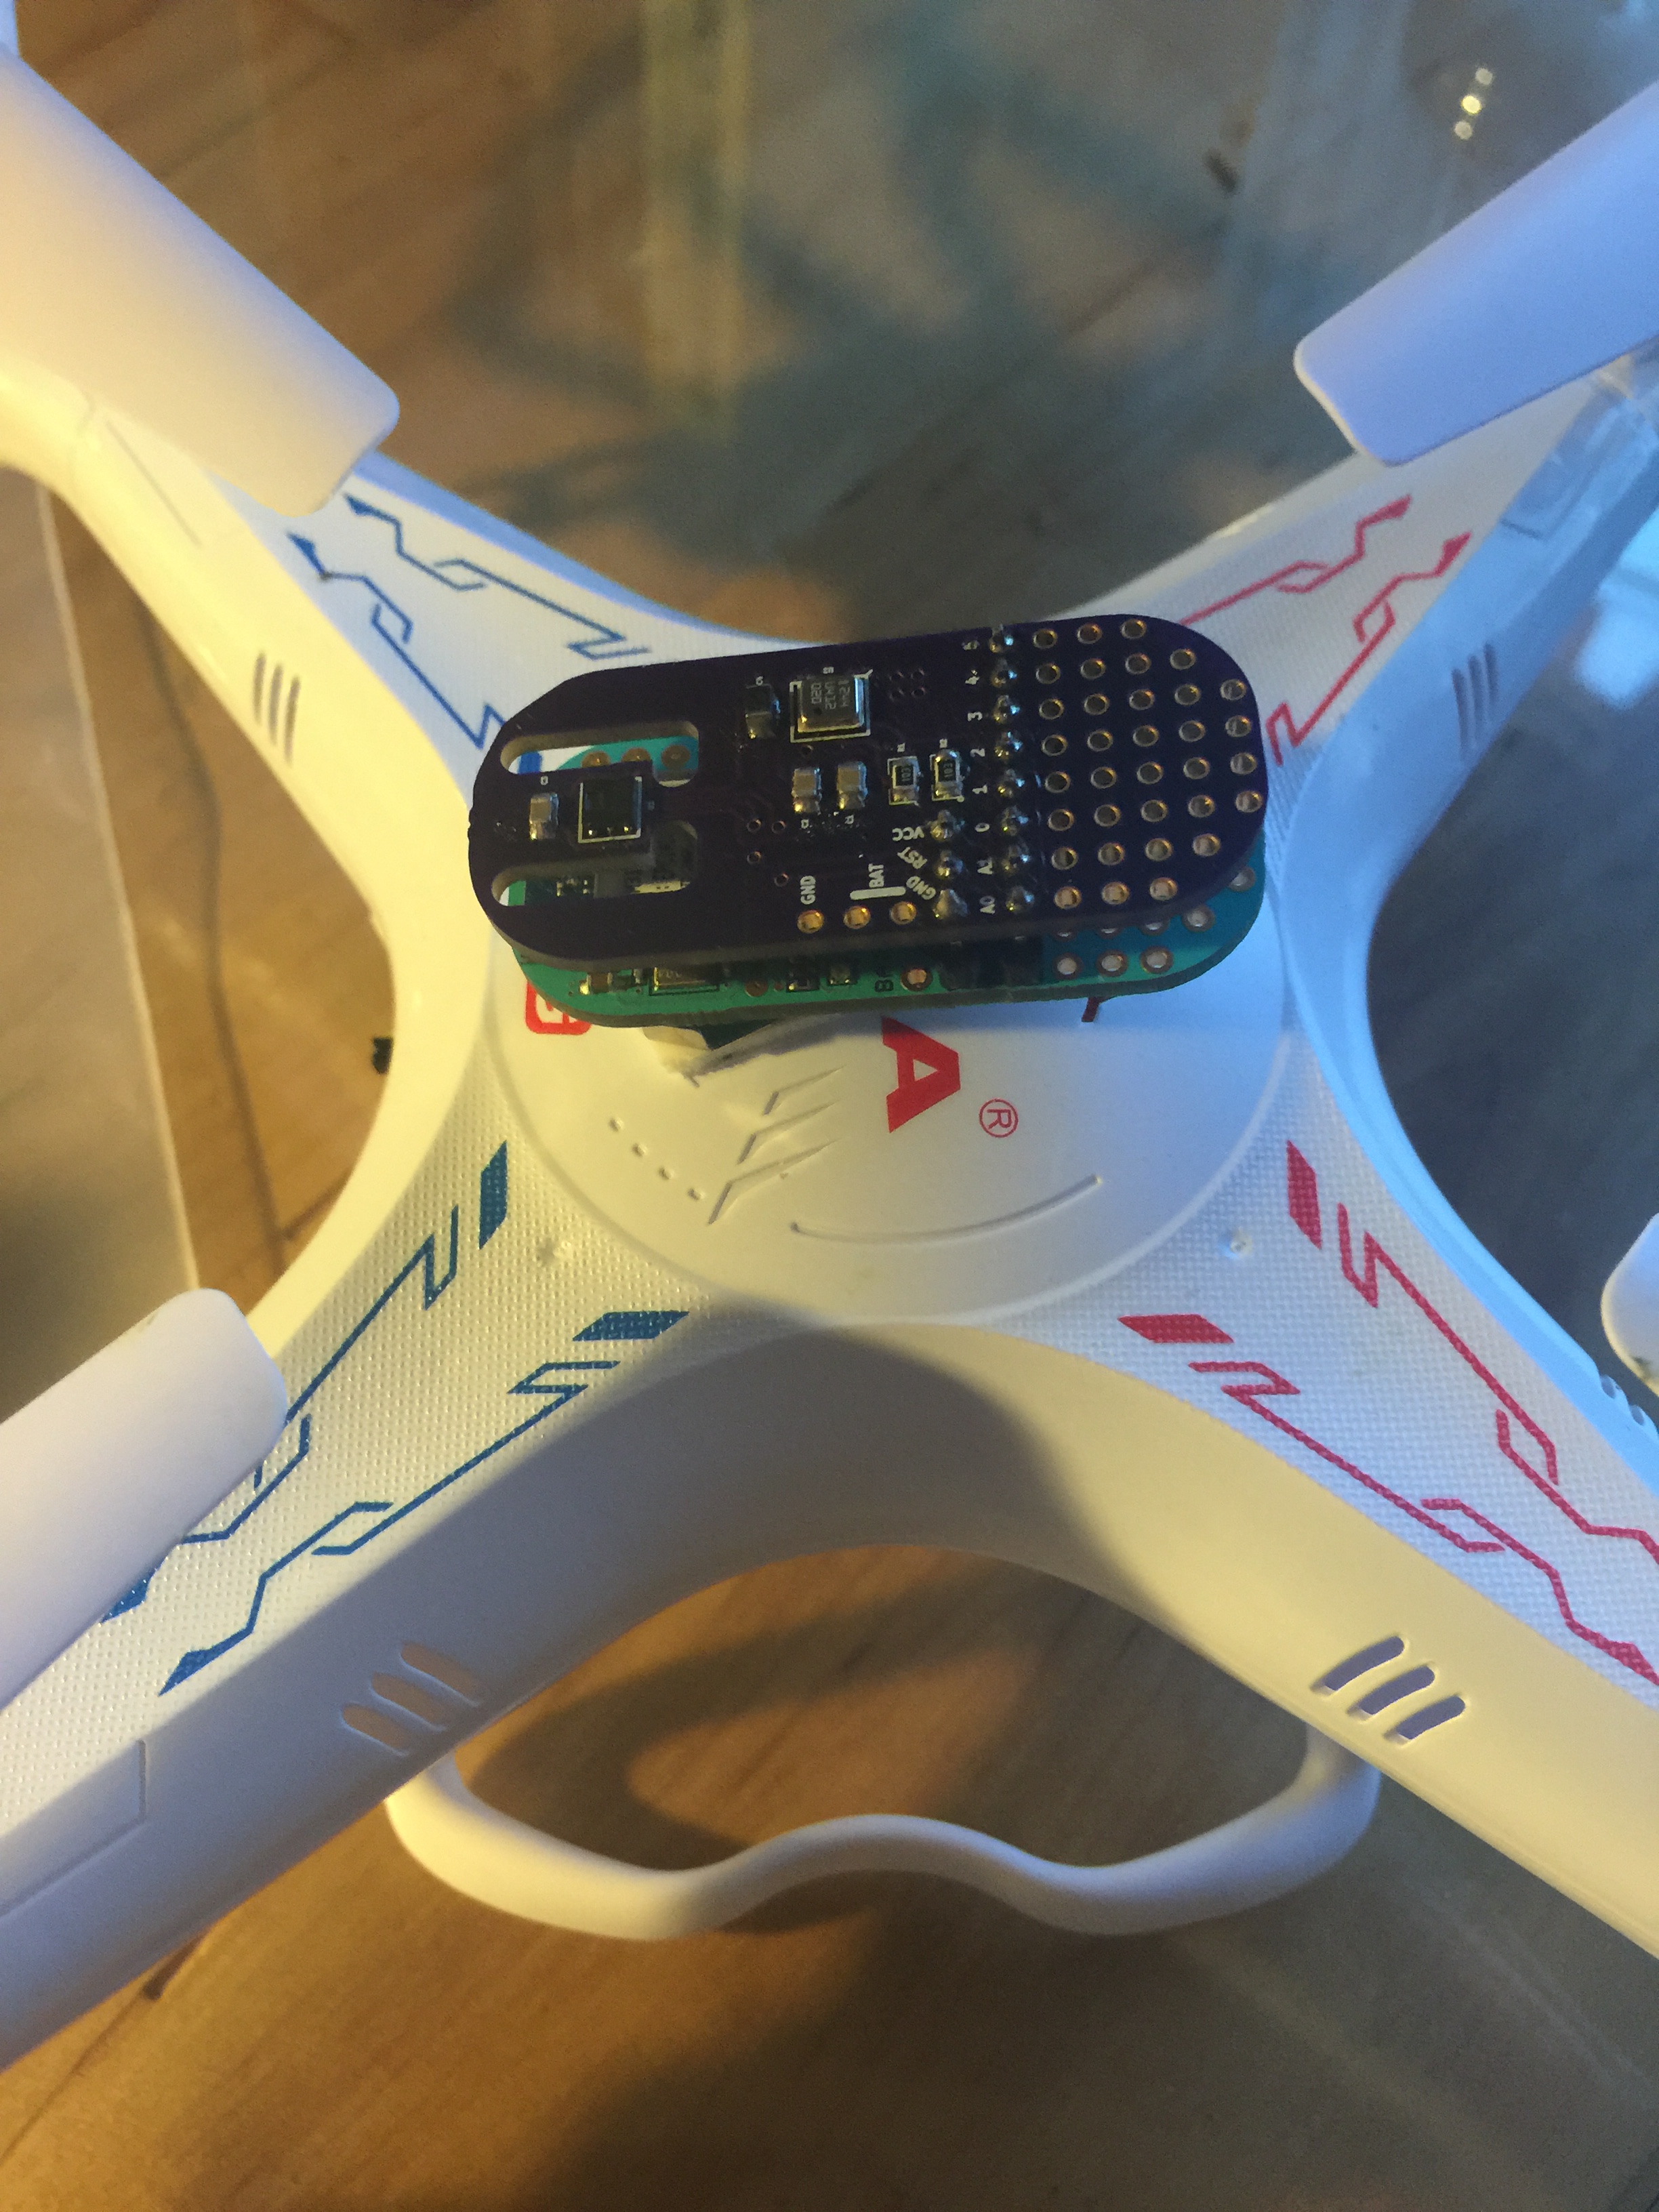
My breakout and the bean attached to the top of the drone body.
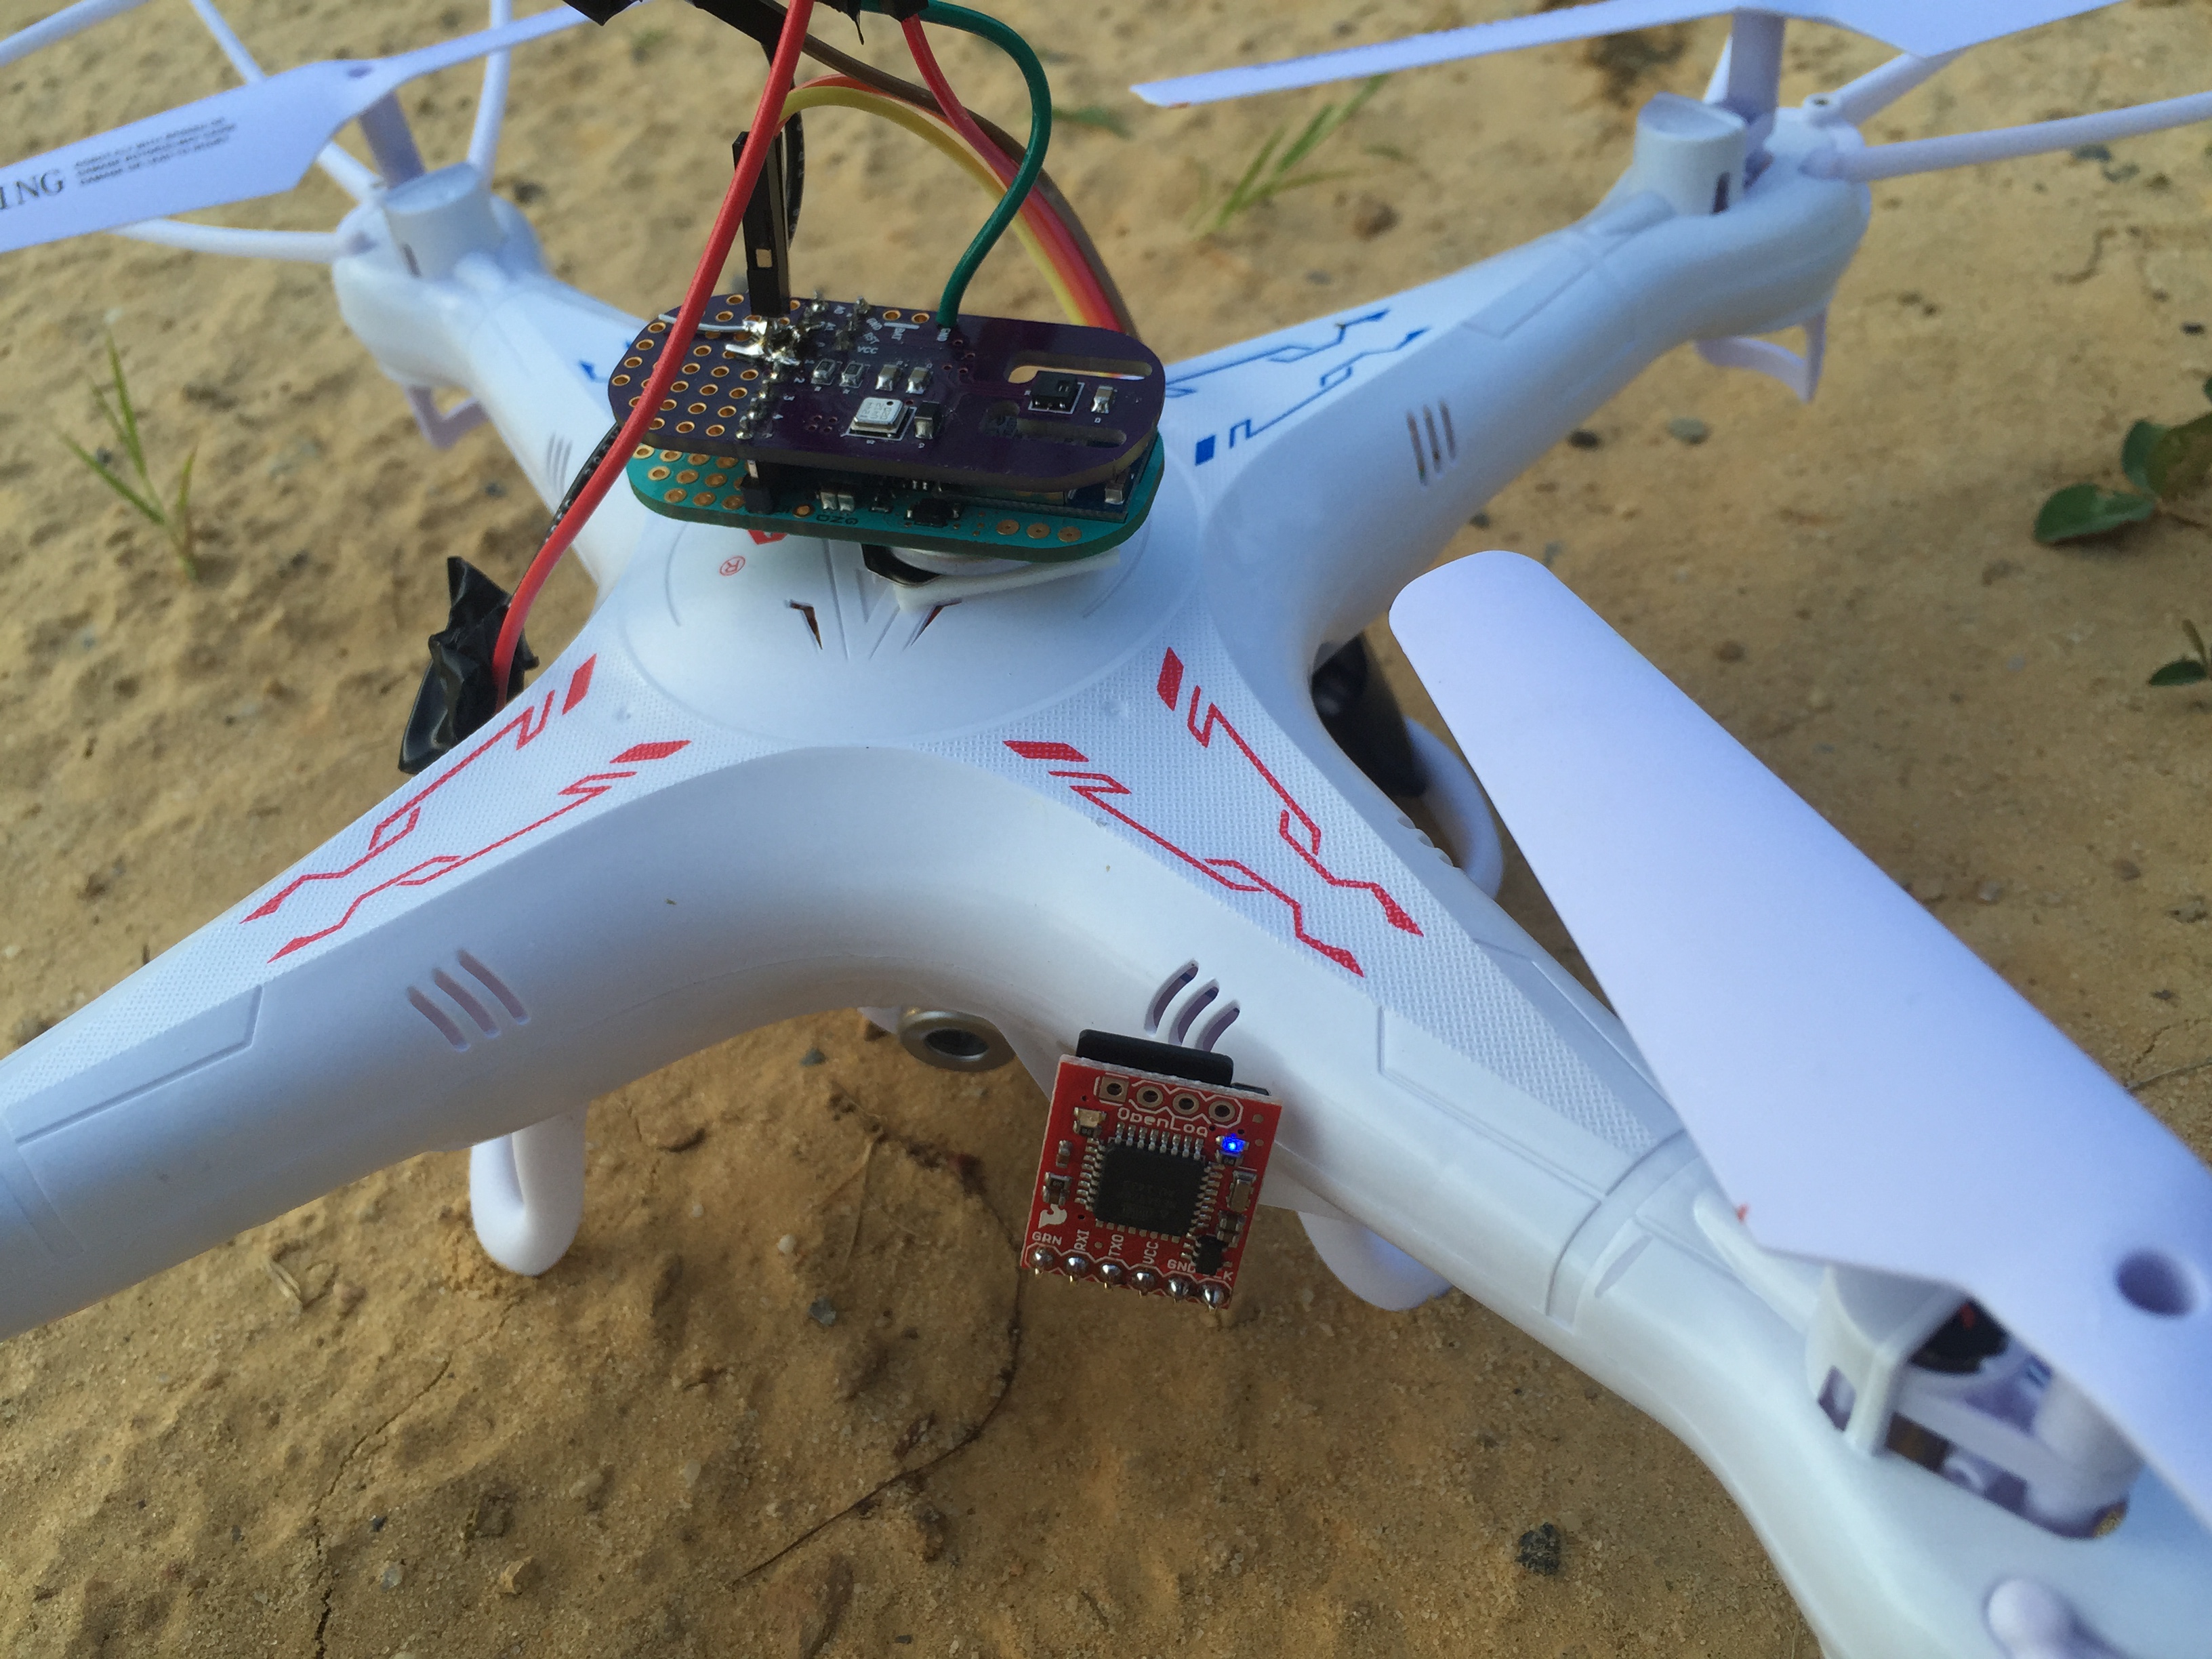
I added a kludge that wrote data to an SD card using the OpenLog. It was extra weight since I needed two more coin cell batteries, but the drone turned out to be able to carry it to 45 m once or twice. Then the drone looses signal and shakily falls out of the sky until I can get control again. While inspiring me to drool over more advanced drones, I did get some interesting data! Some of the plots are rather small in web-view, but click on them to expand. I just didn't want a bunch of individual figures making the post scroll forever.
First I'll show my first SD logged flight(s). Below is the altitude plot (derived from the barometric pressure sensor on-board).
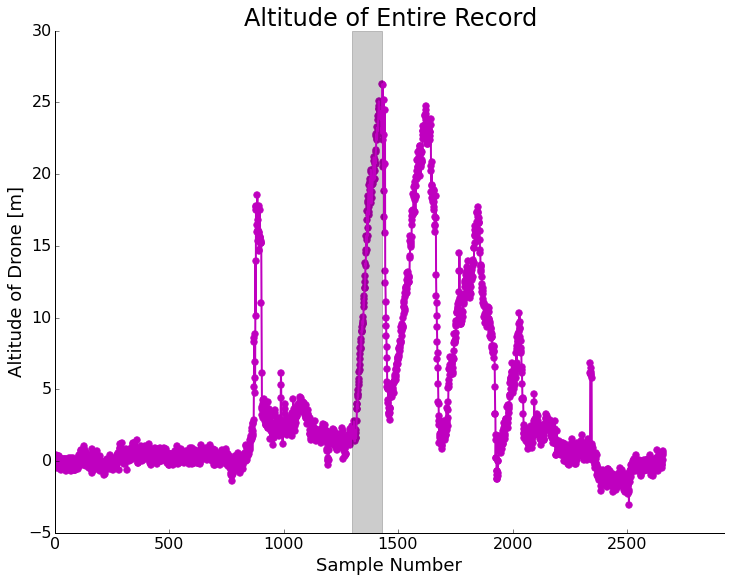
A few up/down flights of the drone. The ascent in the grey box will be examined in detail.
If we take the highest and most constant climb rate ascent (gray box) and look at the temperature/dewpoint data we see rather clean results!
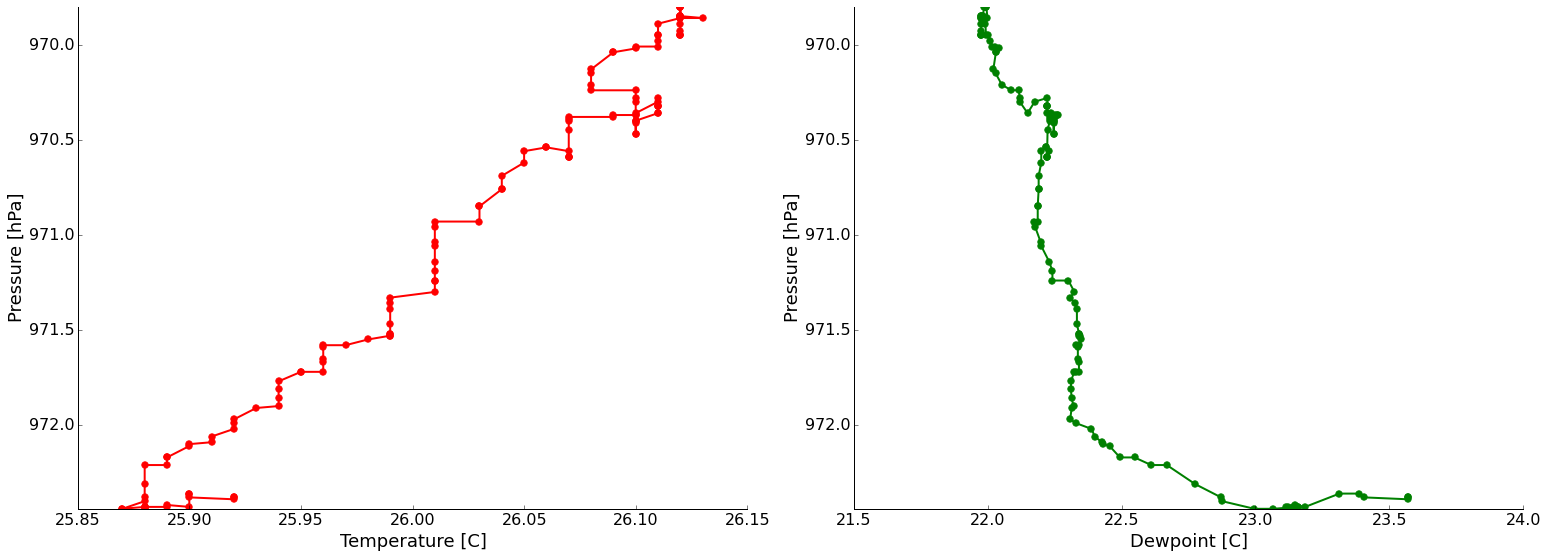
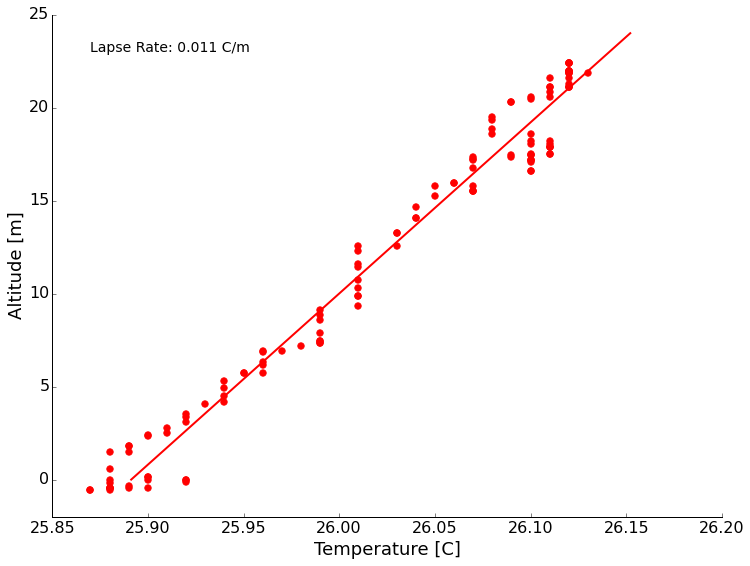
It was a dead still evening, just before sundown. Without any mechanical mixing, we see radiation from the ground producing a temperature inversion (temperature increases with height here). We also see a nice dew point trend to drier air as we ascend. For fun, I calculated the lapse rate. This just means how fast the temperature changes with height. Plotting the data and fitting a line we get about +11 degrees/kilometer of height. A reasonable number. (Perhaps coincidentally about the negative of the typical dry adiabatic lapse rate? It's been too long and I didn't ever do much near ground meteorology. Thoughts appreciated.)
The next evening, a very similar setup without wind, I did another sounding that got up to 45 meters. On this flight I noticed that the bumps in the temperature and dew point trends match rather well with the bump in my ascent rate. Since this drone isn't programmable, I do this by hand which is tricky to judge. It probably has to do with the sensors needing a lot of settling time to equilibrate to their surroundings (a couple of seconds). Maybe flying small circles on the way up is a solution. I also have the video from this flight if you're curious what it looks like. Nothing too interesting, but the uncontrolled descents are rather exciting. I've read about hacking better antennas on this drone for more range, so that's a thought. Before I get it much further away I want to do it in a large field to decrease the risk from a runaway drone. If this proves to be interesting enough, maybe a drone update will be in order. They are pricey though!
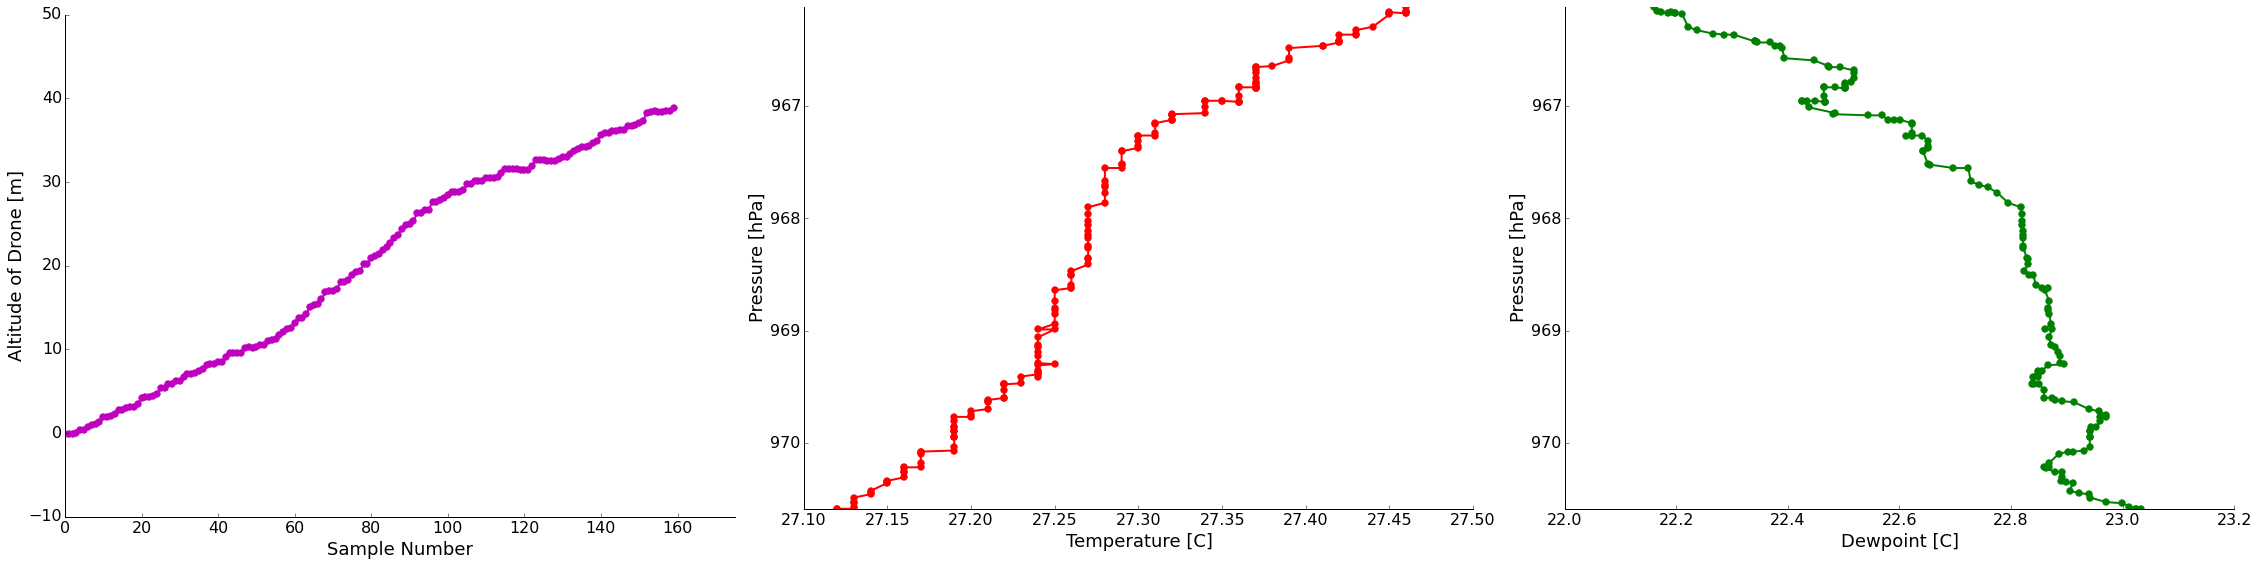
Flight 2 data


