Tag Archives: Python

Exploring Scientific Computing at SciPy 2014

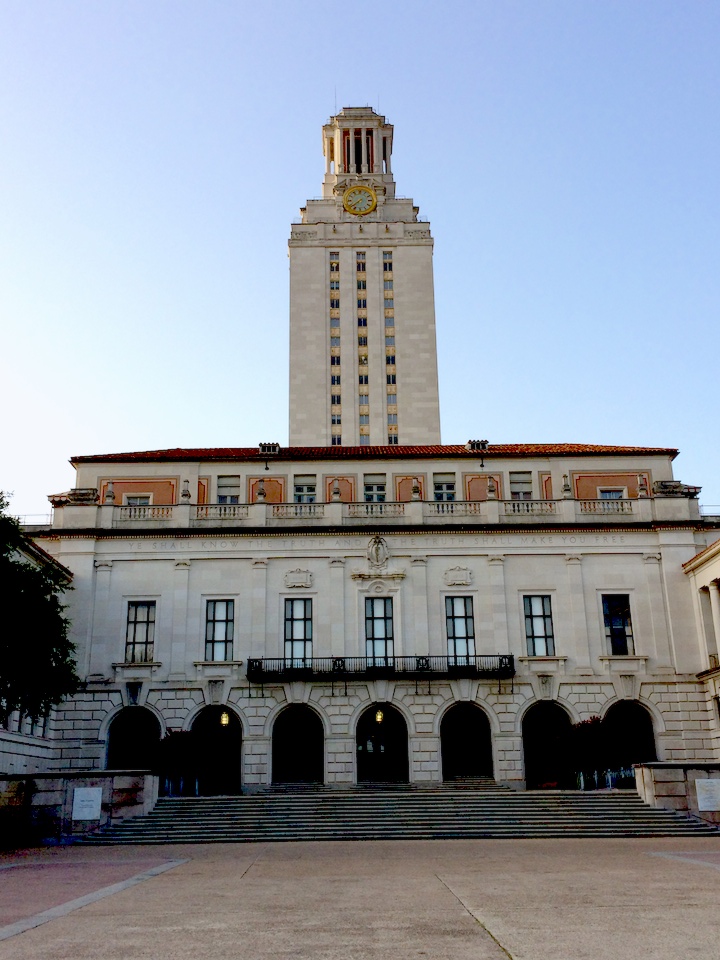
Texas Campus

This past week I've been in Austin, TX attending SciPy 2014, the scientific Python conference.  I came in 2010 for the first time, but hadn't been able to make it back again until this year.  I love this conference because it gives me the chance to step away from work on my PhD and distractions of hobby projections to focus on keeping up with the world of scientific computing with Python.  I try to walk the fine line between being a researcher, engineer, and programmer everyday.  That means that it is easy to fall behind the state of the art in any one of those, and conferences like this are my way to getting a chance to learn from the best.

SciPy consists of tutorials, the conference, and sprints:

The first two days were tutorials in which I got to learn about using interactive widgets in iPython notebooks, reproducible science, image processing, and Bayesian analysis.  I see lots of things that I can apply in my research and teaching workflows!  Interactive notebooks are one of the last things that I was wishing for from the Mathematica notebooks.

The next three days were talks in which we got to see the newest software developments and creative applications of Python to scientific problems.  I, of course, gravitated to the geophysics oriented talks and even ran into some people with common connections.  It was during the conference that I gave my poster presentation.  I knew that the poster focused more on the application of Python to earthquake science than any earth-shaking (pun-intended) software development.  There were a few on the software side that wondered why I was there (as expected), but the poster was generally very well received.  Again I had several chance encounters with people from Google and other companies that had similar backgrounds or were just very interested in earthquakes!

The final two days (I'm writing this on the last day) were sprints.  These are large pushes to further develop the software while a critical mass of experts are in one location.  I'm still new enough to these massive open-source projections (on the development side at least) that I wasn't incredibly useful, but the reception of the developers was great!  Everyone was excited if you wanted to help and would spend as much time as needed to get you up and running.  During the sprints I've been following a fix for an issue that has recently caused problems in my plotting.  I also fixed a tiny issue (with help) and had my first pull request accepted.  For software people these are tiny steps, but for someone coming from just developing in-house purpose-designed tools.... it was an hit of the open-source collaboration drug.

Lastly, I worked on a project of my own during the evenings.  During the 2010 conference I worked with a friend to make a filter remove the annoying vuvuzela sound from the World Cup audio.  This year I've been making a fun earthquake visualization tool.  You'll be seeing it here on the blog, and may have already seen it if you follow me on twitter.  I learned a lot during this year's SciPy 2014, got to spend time with other alums of OU Meteorology, and meet some new folks.  Next on the blog we'll be back to some radar or maybe a quick earthquake discussion!

Holiday Engineering Project - Beginning an Ultrasonic Mapper

Over the Thanksgiving break I decided to tackle a small engineering project that has been on my mind for the past month or so.  The basic idea was inspired by learning about Bill Stone's underwater cave mapping system (Stone Aerospace).   It is a relatively complex system constructed by more funding that a college student has at his/her disposal.  Being a caver myself I decided to build a much simpler and cheaper version for both above and below ground mapping.

Since this project is not too large it should be easily constructed over a few weekend hacking sessions, and over the last day the first steps have taken place. The machine uses and Arduino Uno as an interface between a computer and the real world.  While it is true that it would be possible to make a self-contained unit that would store data on a flash drive and maybe even display initial results on some simple display, I opted out of that option for cost and control concerns.  It should be simple to make a simple GUI that allows a netbook to control the setup very nicely and process the data real time.  
Above the basic layout from my notebook is shown.  The ultrasonic ranger (an SRF05) is attached to a rotating mount to sweep through the space around it.  In the initial prototype stages I'm using a simple RC servo since I have it on hand.  Servos only sweep close to 180 degrees to avoid bending control links on models.  While continuous rotation servos are made, they have no position feedback which does not allow accurate positioning of the servo.  It would be possible to use multiple rangers so 180 degrees is enough rotation, but it will be more economical to switch to a slow geared motor with an encoder (maybe a quadrature rotary encoder?) to detect the position as the unit slowly sweeps the space around it.  
Also pictured is the Arduino board and the range finder mounted in a custom case built this afternoon (the window added allows the ping LED to be seen inside the case to confirm the link).  Modification of the PCB and mounting hardware was required.  CAT5e cable along with 4-pin radio mic connectors are used for the power, ground, echo, and trigger pins.  The ranger has a built in PIC controller to pulse the output with a length of the echo time.  The unit seems to range effectively up to about 17 feet.  
While I don't know the accuracy at large distances, or the spread of the 'beam' with the increasing path length, some simple tests should help sort that out.  Currently I've written the interface on the Arduino in C, which will listen for commands over the USB connection.  It this executes those commands (such as move servo, get distance, etc) and returns the appropriate values if necessary.  The communication is asynchronous and not really 'handshaking', but using startbits there is some error checking involved.  
The control from the computer is in the form of a python script that takes easy user input and converts it to the short serial commands in the home-made quick transfer format in the Arduino C code.  Currently it moves the servo and returns distances in cm.  At distances less than 30 cm results seem to be accurate to about 2-5mm.  

The next steps include mounting everything up to get 180 degree scans produced, assessing the accuracy and noise limits of the unit.  I also plan to implement a scanning algorithm that scans more quickly over plan surfaces and slows down over more interesting surfaces.  It will also throw out false returns, which could be due to a range folding issue in large spaces (I have not done anything past back of the envelope on if the signal is strong enough to cause a range folding issue).  A leveling mechanism (manual or automatic) would be nice for field applications.  If this were to be used in mapping a tunnel some kind of simple inertial navigation system with a combination of gyros and accelerometers could be used.  These are all for future development and future posts.  
Have a happy and safe Thanksgiving! 

The Vuvuzela: An Annoying Horn but a Fun Filter Project!

As we've watched the world cup matches over the past weeks everyone has been annoyed by the droning hum of the vuvuzela.  Everyone in the crowd blowing on one of these pipes makes life for our ears unpleasant.  What can you do though?

While at SciPy 2010 this week we saw a tutorial about signals with Python.  Another student and I talked about filtering out the drone and after several late nights of hacking it worked! The principle is simple, block the frequency of the horn and it's harmonics.  To do this we use a notch filter that rejects the signal from a certain frequency range.

The code (waves.py) is available and is a short script to read in, filter, display, and write out the files.  Below I show an example of the signal and power spectral density before filtering (left) and after filtering (right).  There are also links to the audio files.  I found three example files and filtered them with three different filter widths (5,10,25 Hz). All runs are available at http://leemanwebb.org/vuvu/ , but that link will disappear and I'll then post a more permanent page after some tweaking with the project.  Be sure to listen to example 3 before and after the 5Hz width filter.