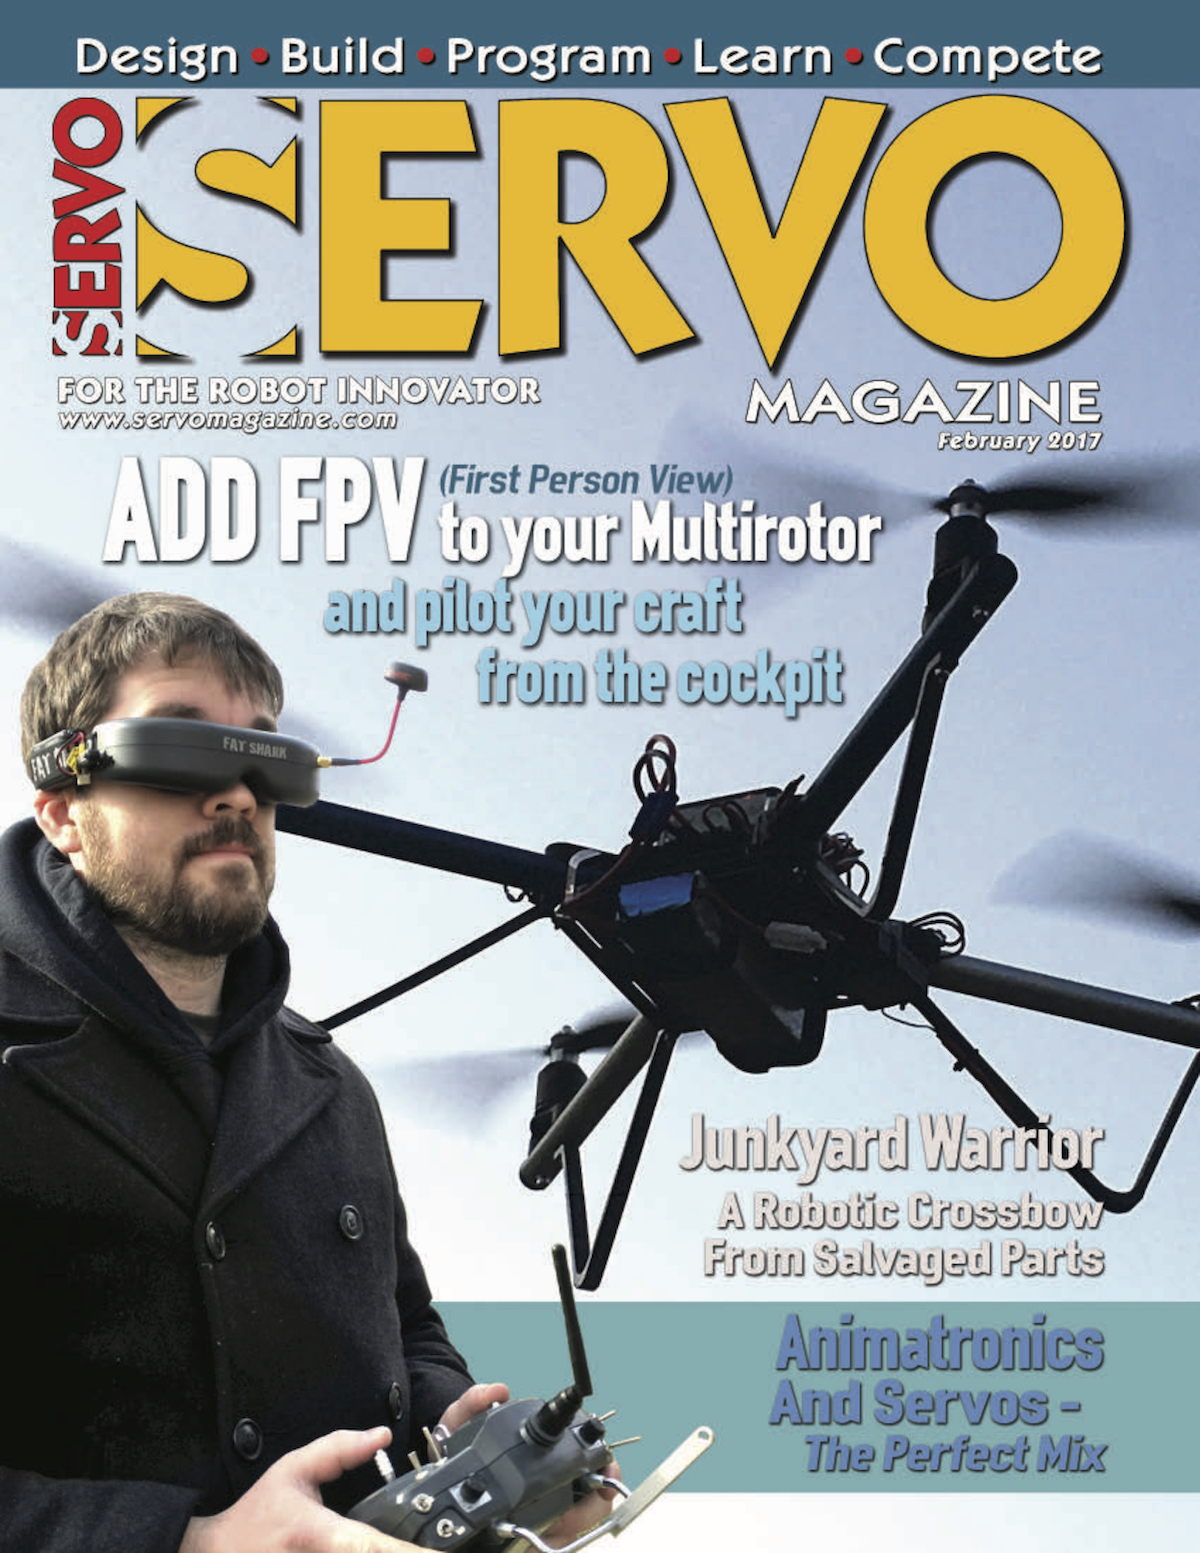
This month I was lucky enough to have a cover feature on adding a camera and googles/screen to your drone setup. Adding this "First Person View" (FPV) capability really makes flying a lot different as its like you are setting in the cockpit!
Several years ago, I rode in the copilot’s seat of a small Cessna circling over northwest Arkansas. The view was great and the experience of sitting right behind the propeller with a view of where we were headed was fantastic. It made riding in economy of commercial airliners seem even more boring and cramped than it already did. As multirotor pilots, we can now have that experience with first person view (FPV) equipment that literally puts us in the pilot’s seat and immerses us in the experience of flying.
Be sure to checkout the column and let me know of other topics you'd be interested in seeing in future articles! Right now I've got a photogrammetry series coming up after a quick CX-10 hack.
Folks that follow my various projects have probably noticed that I've recently formed an instrumentation and consulting company. I've had great fun doing several jobs for folks ranging from CAD design of brackets to writing numerical models for projects to designing custom measurement solutions. I've also been very busy designing some exciting new hardware that I hope will be available soon. In this post I wanted to share a time saving trick I used in KiCad while designing my printed circuit boards for one of these projects.
When designing things to be made in any quantity by an assembler or manufacturer (and for financial reasons) you need to keep a really good bill of materials or "BOM". Doing this often involves linked Excel sheets, binders of parts lists, and general gnashing of teeth. When working on the BOM for my circuit boards I found an excellent post by Dan over at Rheingold Heavy on designing for manufacture with KiCad. In this post he outlines a really nice workflow on how to keep track of part numbers and other meta-data for each component. Ideally this would happen at the beginning of a project. You would assign a part (say a resistor) a manufacturer's part number, distributor's part number, etc. Then, you can copy that component (and it's metadata) as many times as you need by simply hovering over it and hitting "C". Well, I already had my entire schematic and board layout completed. I had a lot of components that were used many times (think 10 k resistors, 0.1uF caps, and jumpers). I didn't want to keep copying and pasting the information over and over from the websites of the manufactures and distributors and I didn't want to delete the components and copy in components with metadata for fear of destroying my completed project, footprint associations, and who knows what else. My solution? TextExpander.
TextExpander is a program that stores snippets of text and lets you type a few trigger keys to place all of that text in a fraction of a second. I've used it for years and it has easily saved me tens of hours on my laptop. I've got snippets for date and time stamps, outlines for our podcast, form replies about common technical issues in our lab, chunks of code that I use a lot, and really just about anything else you can imagine. (I forgot to add LaTeX equations/tables in there, but that alone saves me a lot of time on every paper I write.) The pricing model for TextExpander has changed recently, and I'm not a huge fan of the new scheme, but that's beside the point.
My idea was simple. I made a set of snippets that would expand into web addresses and part numbers. I would copy information in for a certain part, then using TextExpander add that information to add parts of that kind. After that, I'd change the snippets to the next part and repeat. Yes, this took awhile, but nowhere near as long as if I'd done all of the population by "hand". I've made a quick demo video below to show you how it's done. I hope this ends up being useful to others, let me know of any tricks you've come across to speed your DFM process.
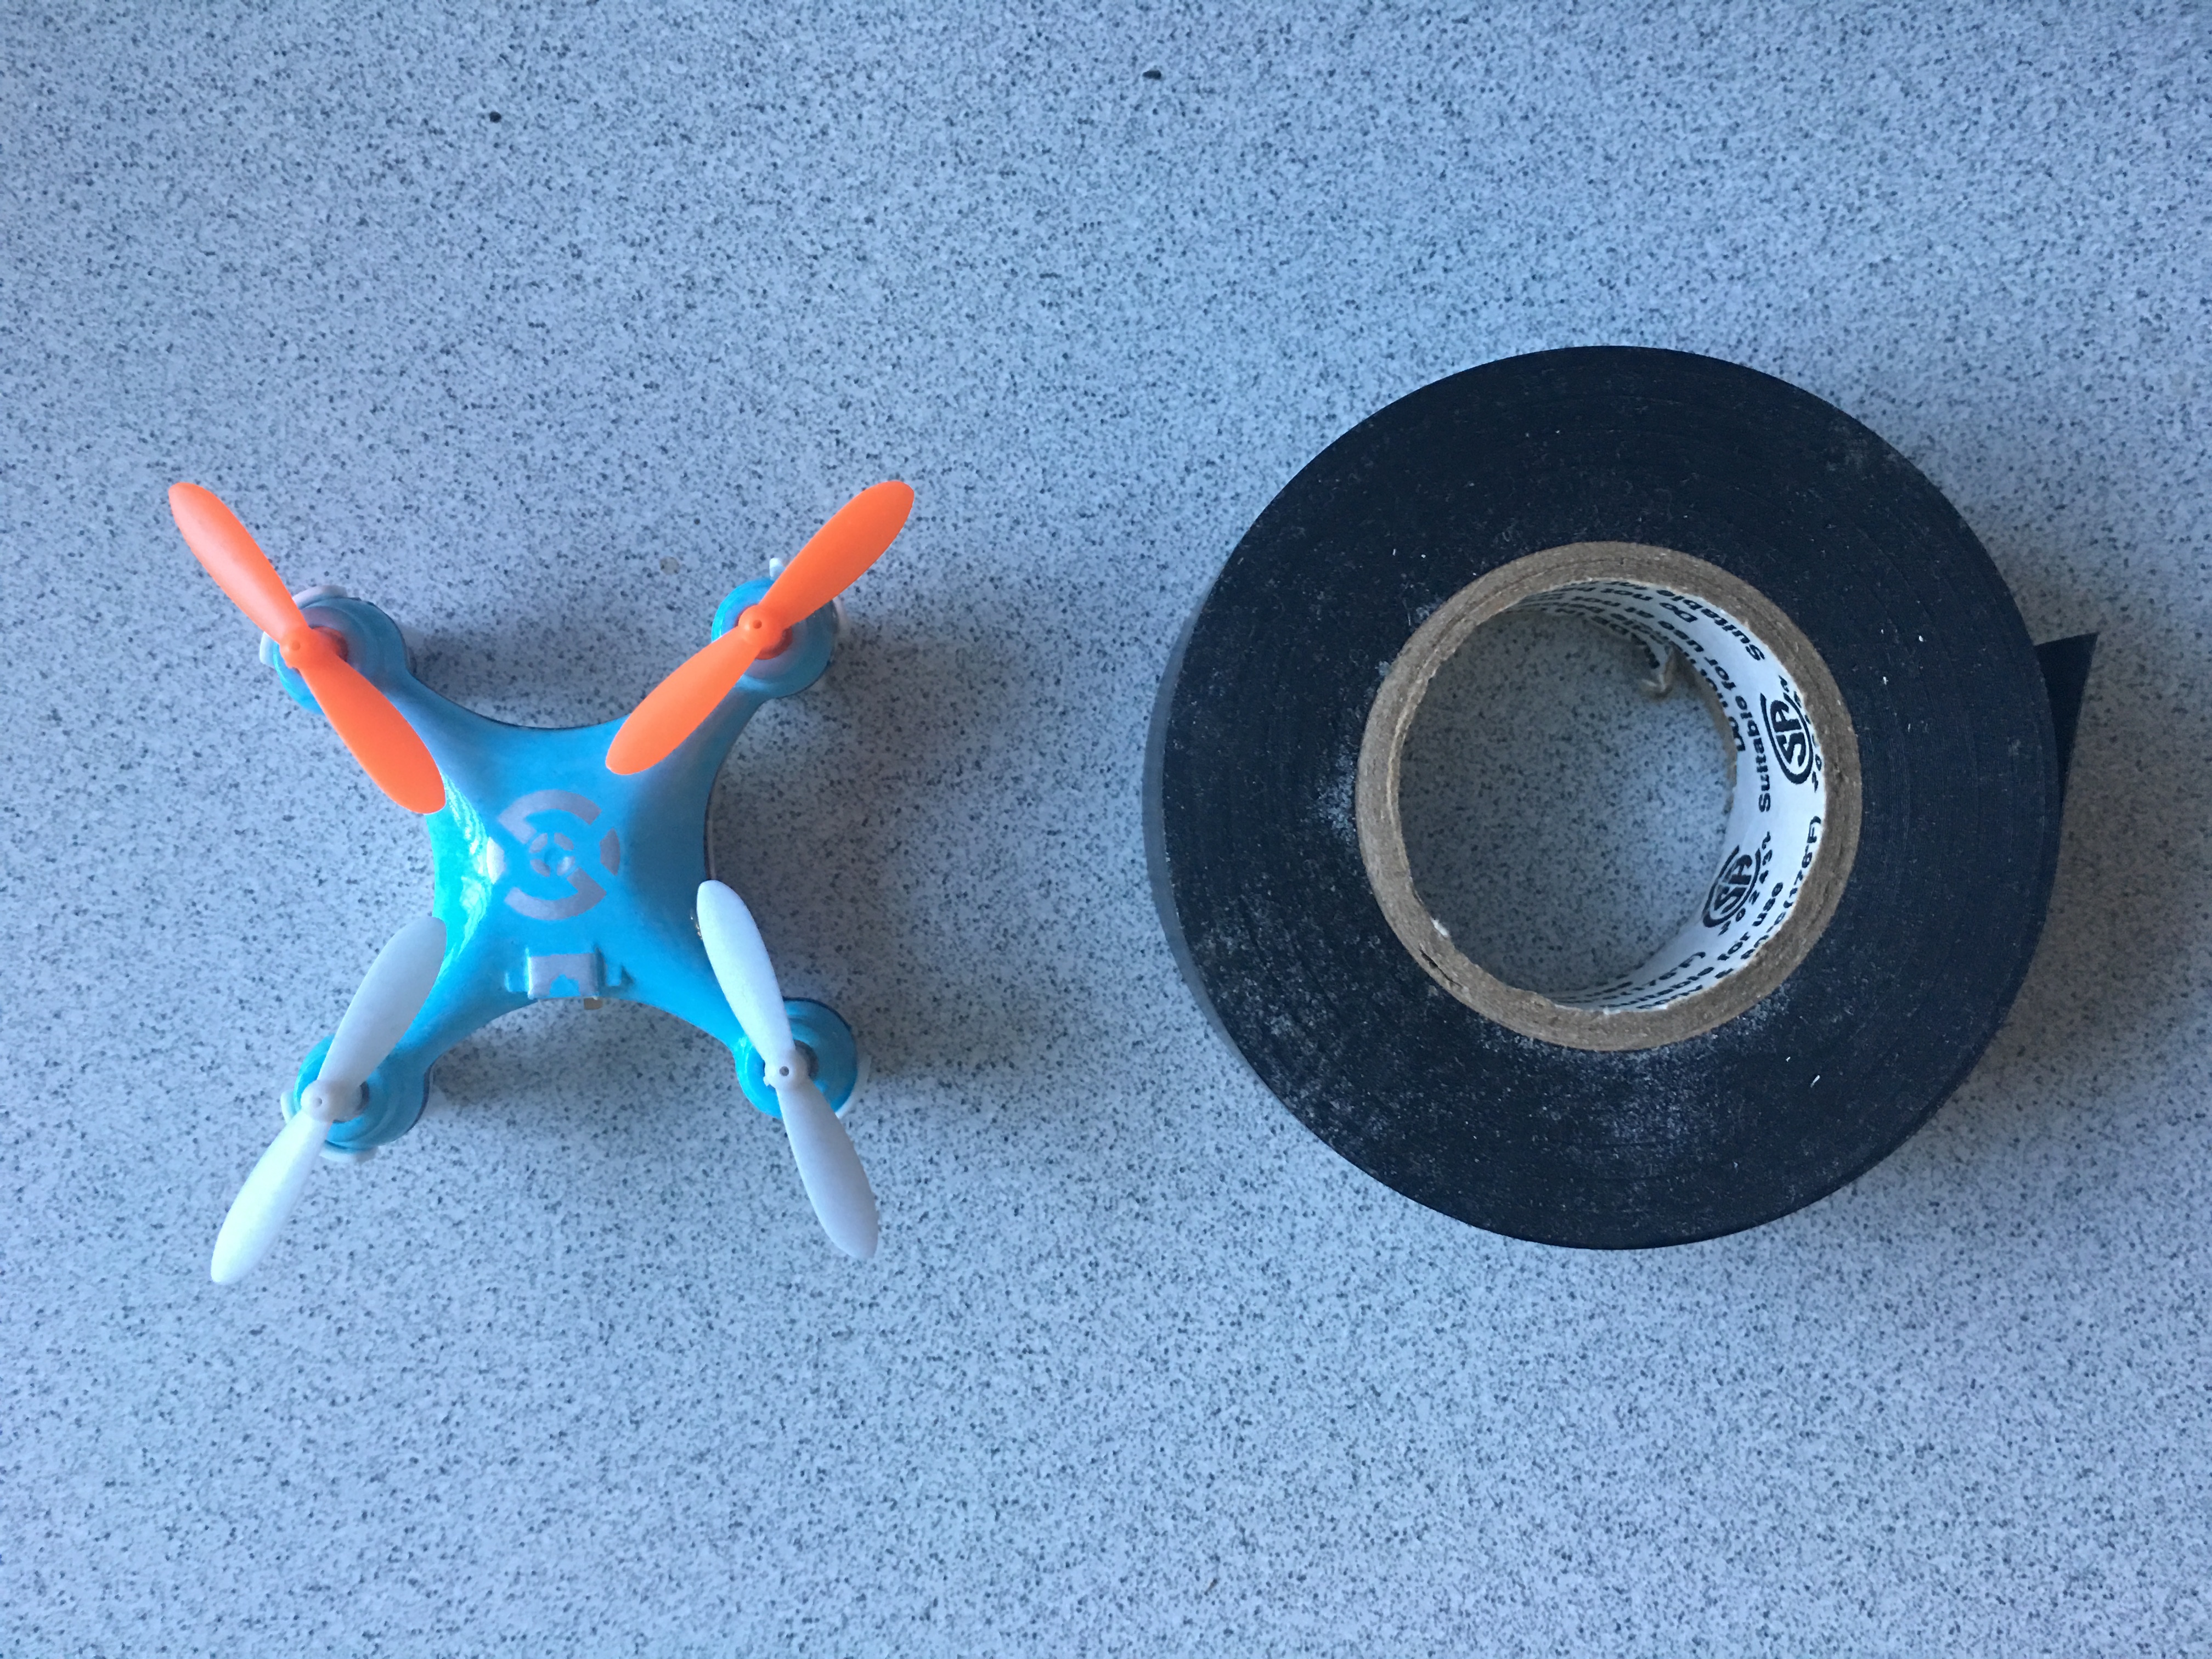
If you've been following my drone work through Servo or on social media, you have probably seen me posting pictures of the tiny Cheerson CX-10 quad. You can pick them up for ~$15 on Amazon and have hours of fun. As you can imagine, there is a fair share of crashing at first while getting used to the response of such a small vehicle. After a few run-ins with the wall, I could fly it pretty well though. I picked up a couple more, including a model with a camera. Amazing for the price. A couple of weeks ago there was some random falling out of the sky behavior, followed by the realization that one of the props on two of the three quads was not turning anymore. I checked for any hair/carpet wrapped on the shafts, but they were clean.
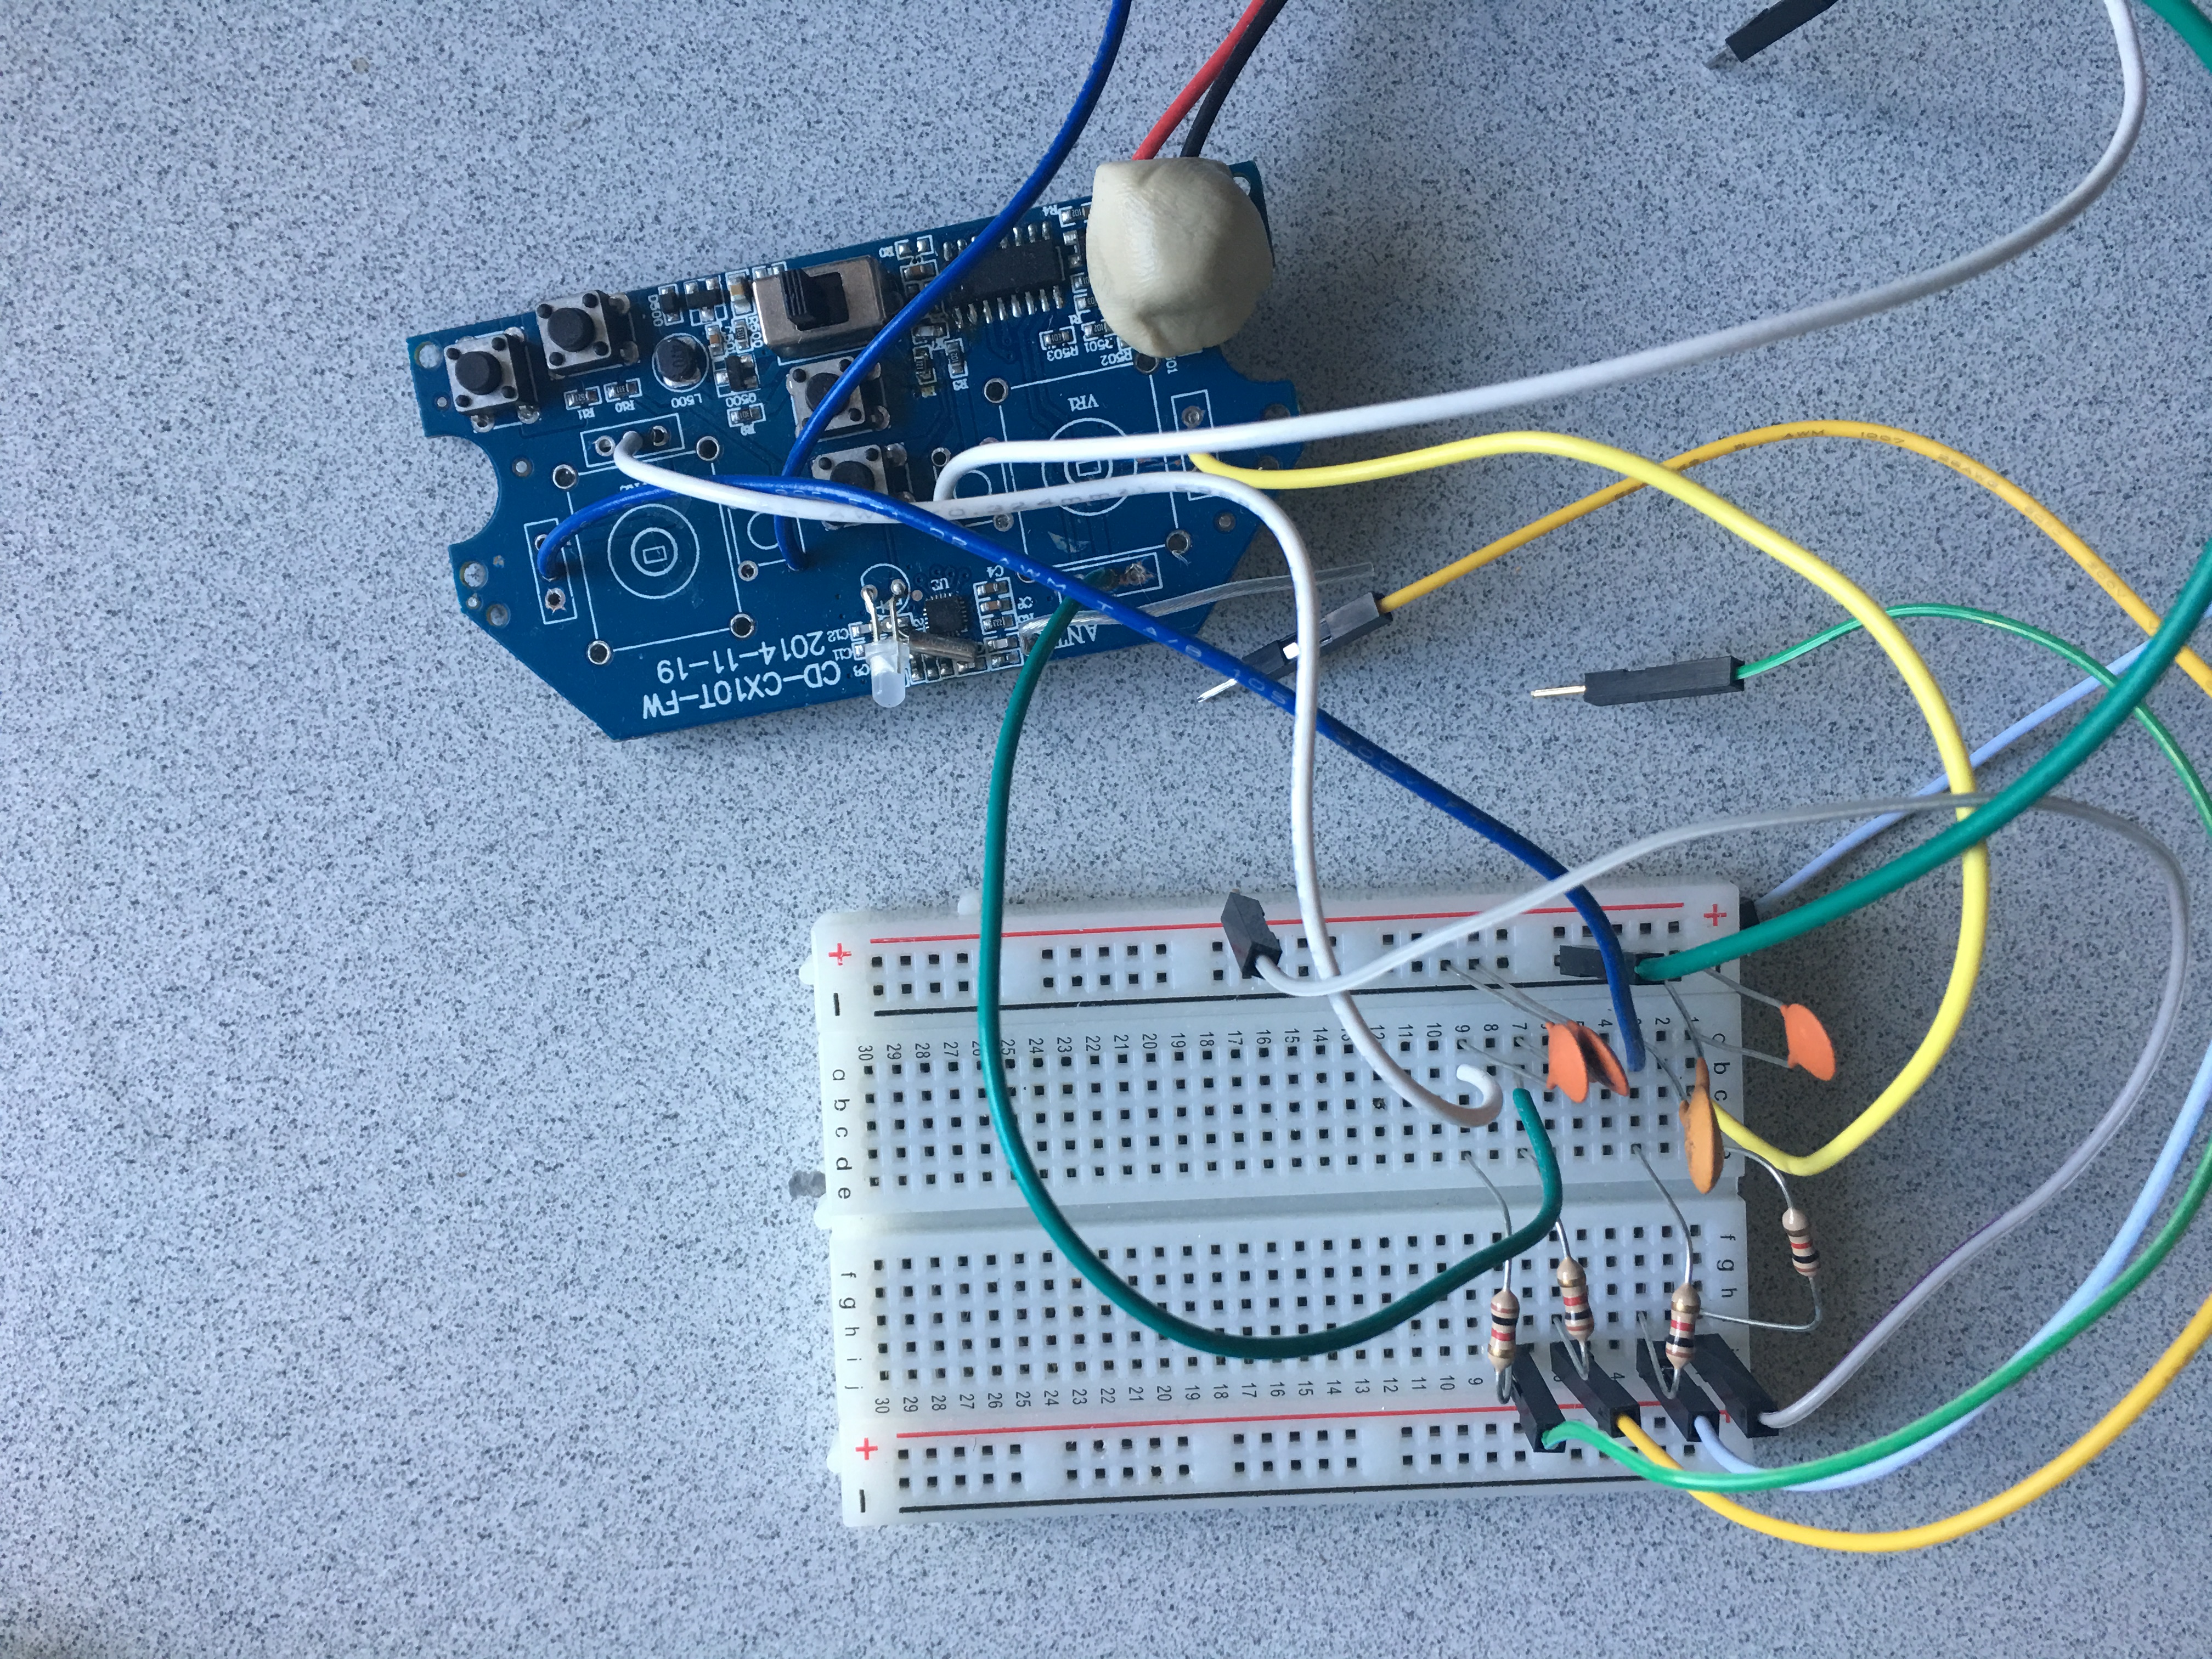
I needed to repair the quads as I'm working on a little project modifying their controller for a future Servo article (preview photo below). Sure, they are cheap enough that they are almost disposable, but I figure if nothing else I could swap some parts to get at least one working vehicle out of the two. Time to crack it open!
A teaser of a future project that I'll be writing up in Servo.
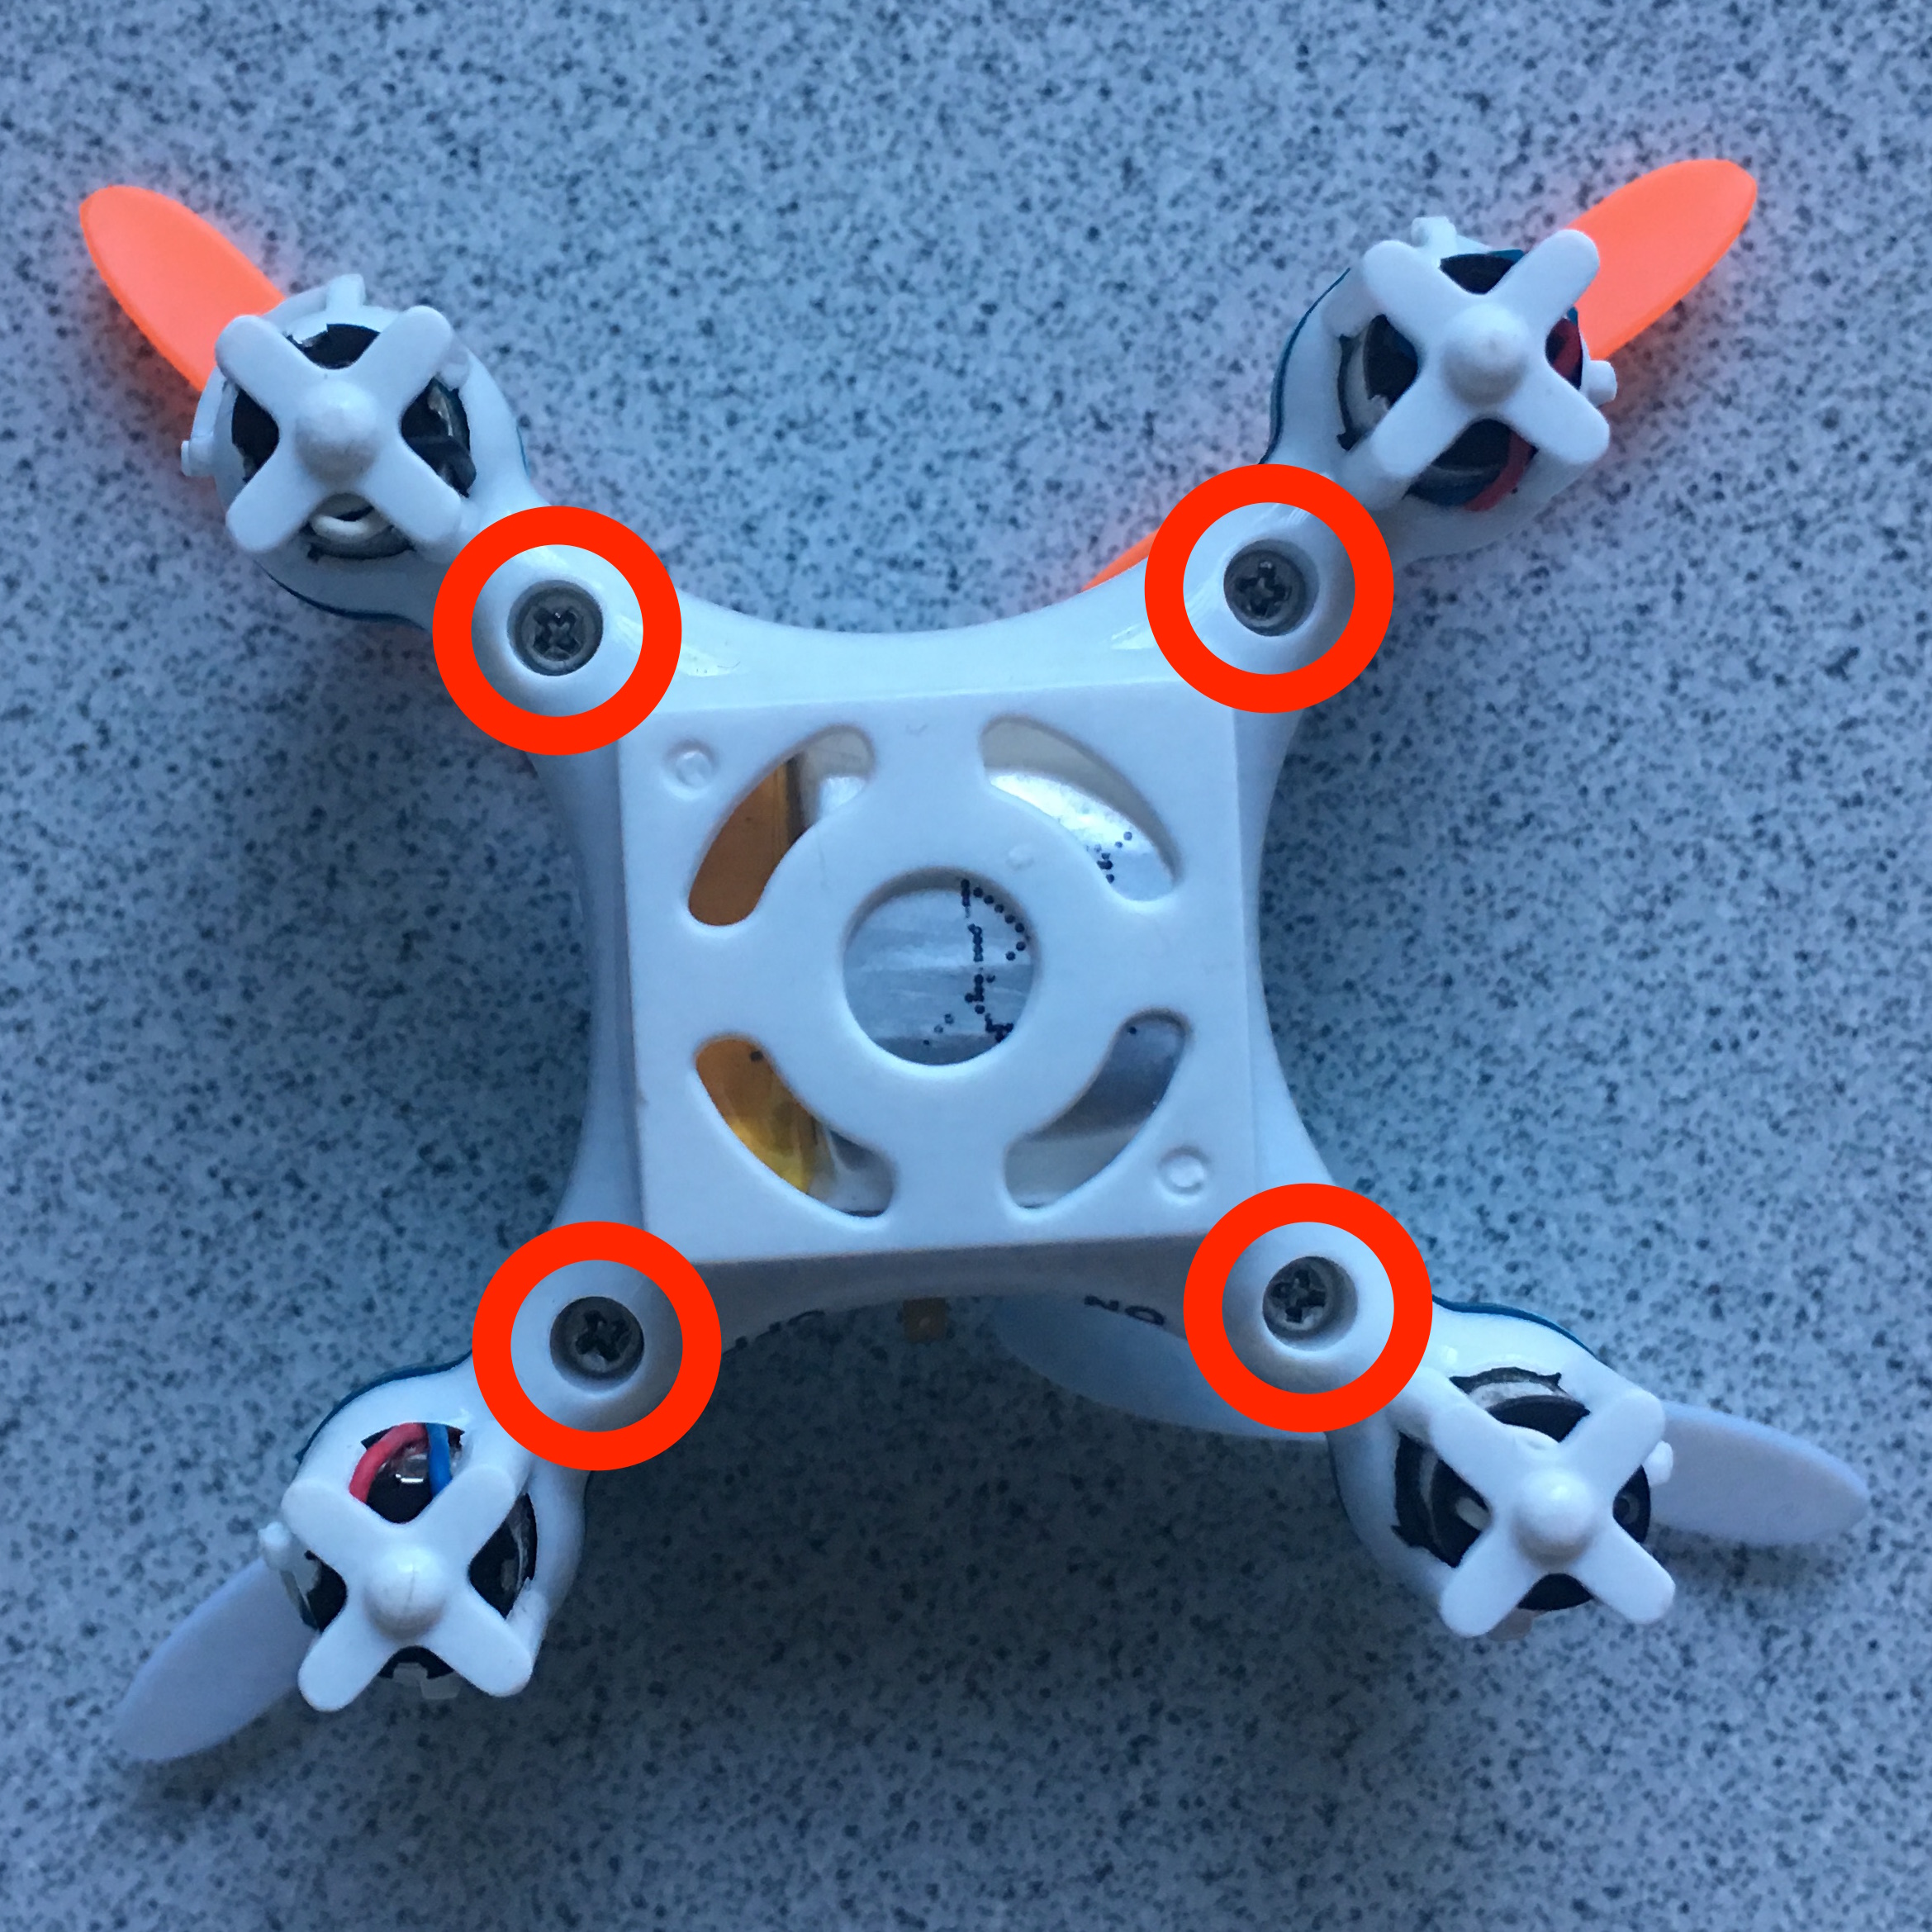
There are four small screws holding the plastic half-shells together. After removing those and placing them in a container for safe-keeping I gently pried open the plastic clips at the end of each motor extension arm. This was easy to do with just my fingernails. The two parts of the case came off and I was staring at the printed circuit board. (Side note: the camera is some module they just tacked on, so I just pushed it out of the way and ignored it.)
Four screws hold the airframe together. A jeweler's screwdriver set was essential!
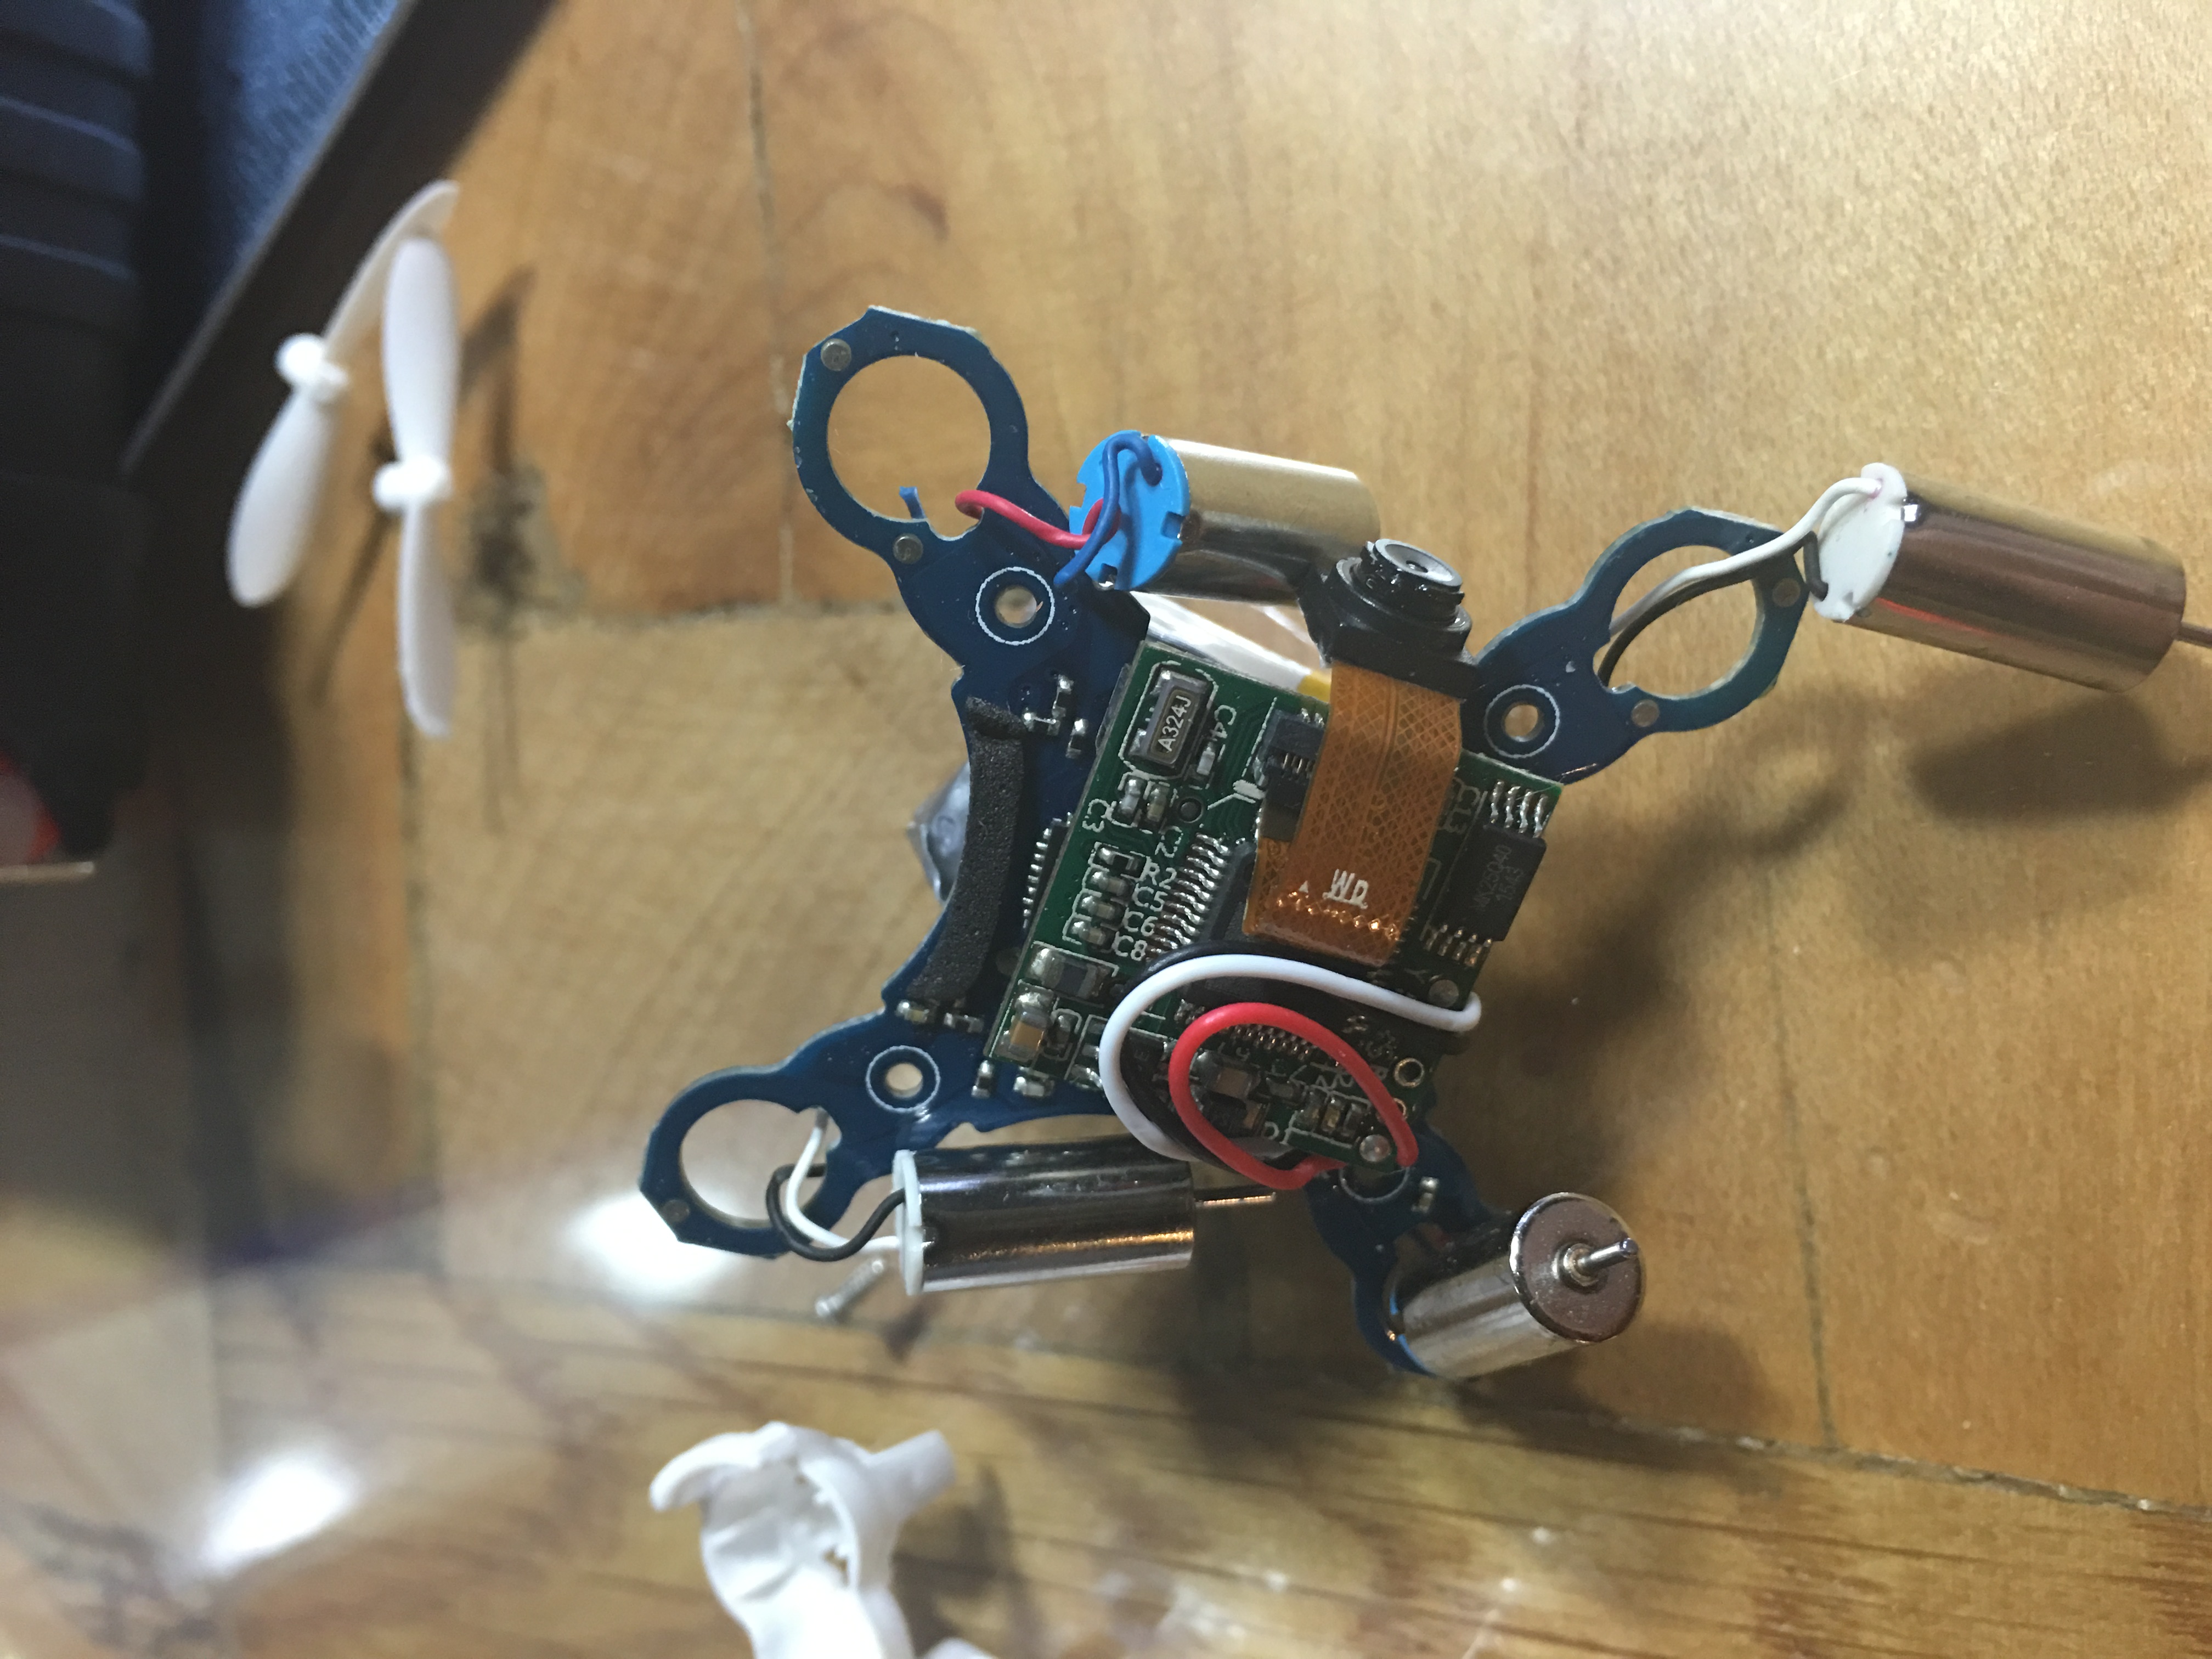
The problem was immediately obvious - the ground wire to the nonfunctional motor had been severed. Looking at a few other wires, it looks like they commonly get pinched in the enclosure during assembly. After repeated run-ins with objects, the wire was eventually sheared.
Note the broken blue wire in the upper left of the photo. Luckily this was an easy fix.
Using a little bit of magnet wire and a magnifier I was able to splice in a new section of wire. I was startled when the motor somehow jumped to life as the free end of the magnet wire swept across the PCB during the repair. I insulated it with a bit of electrical tape. The tape prevented me from inserting one of the four screws upon reassembly, but so far that doesn't seem to be a problem. Putting things back together took just a few minutes and I was happily flying again!
The moral of this story is that if you have one of these little quads and it seems to have died, go ahead and open it up! If the problem comes back, I may buy some extra motors or start a parts pool from other quads. Looking at the construction of the quad was a bit scary though - I think they will live in my LiPo fire safe now.
If you want to know more about how these little quads work, checkout these blog posts by Elecia White in her toy teardown series. Also, if you haven't listened to the podcast Elecia and Chris host "Embedded.fm" and you're reading this, you would probably enjoy it!
See you in a couple of weeks with a revisit of a popular myth we tested about a year ago!
Things have been a bit slow here at the blog with a lot of things happening at work and the fact that I'm not also very excited to be writing a monthly column about multi-rotors in Servo Magazine! Not to worry though, I've still got some excellent projects queued up for the blog, including one that has currently filled my living room with sawdust.
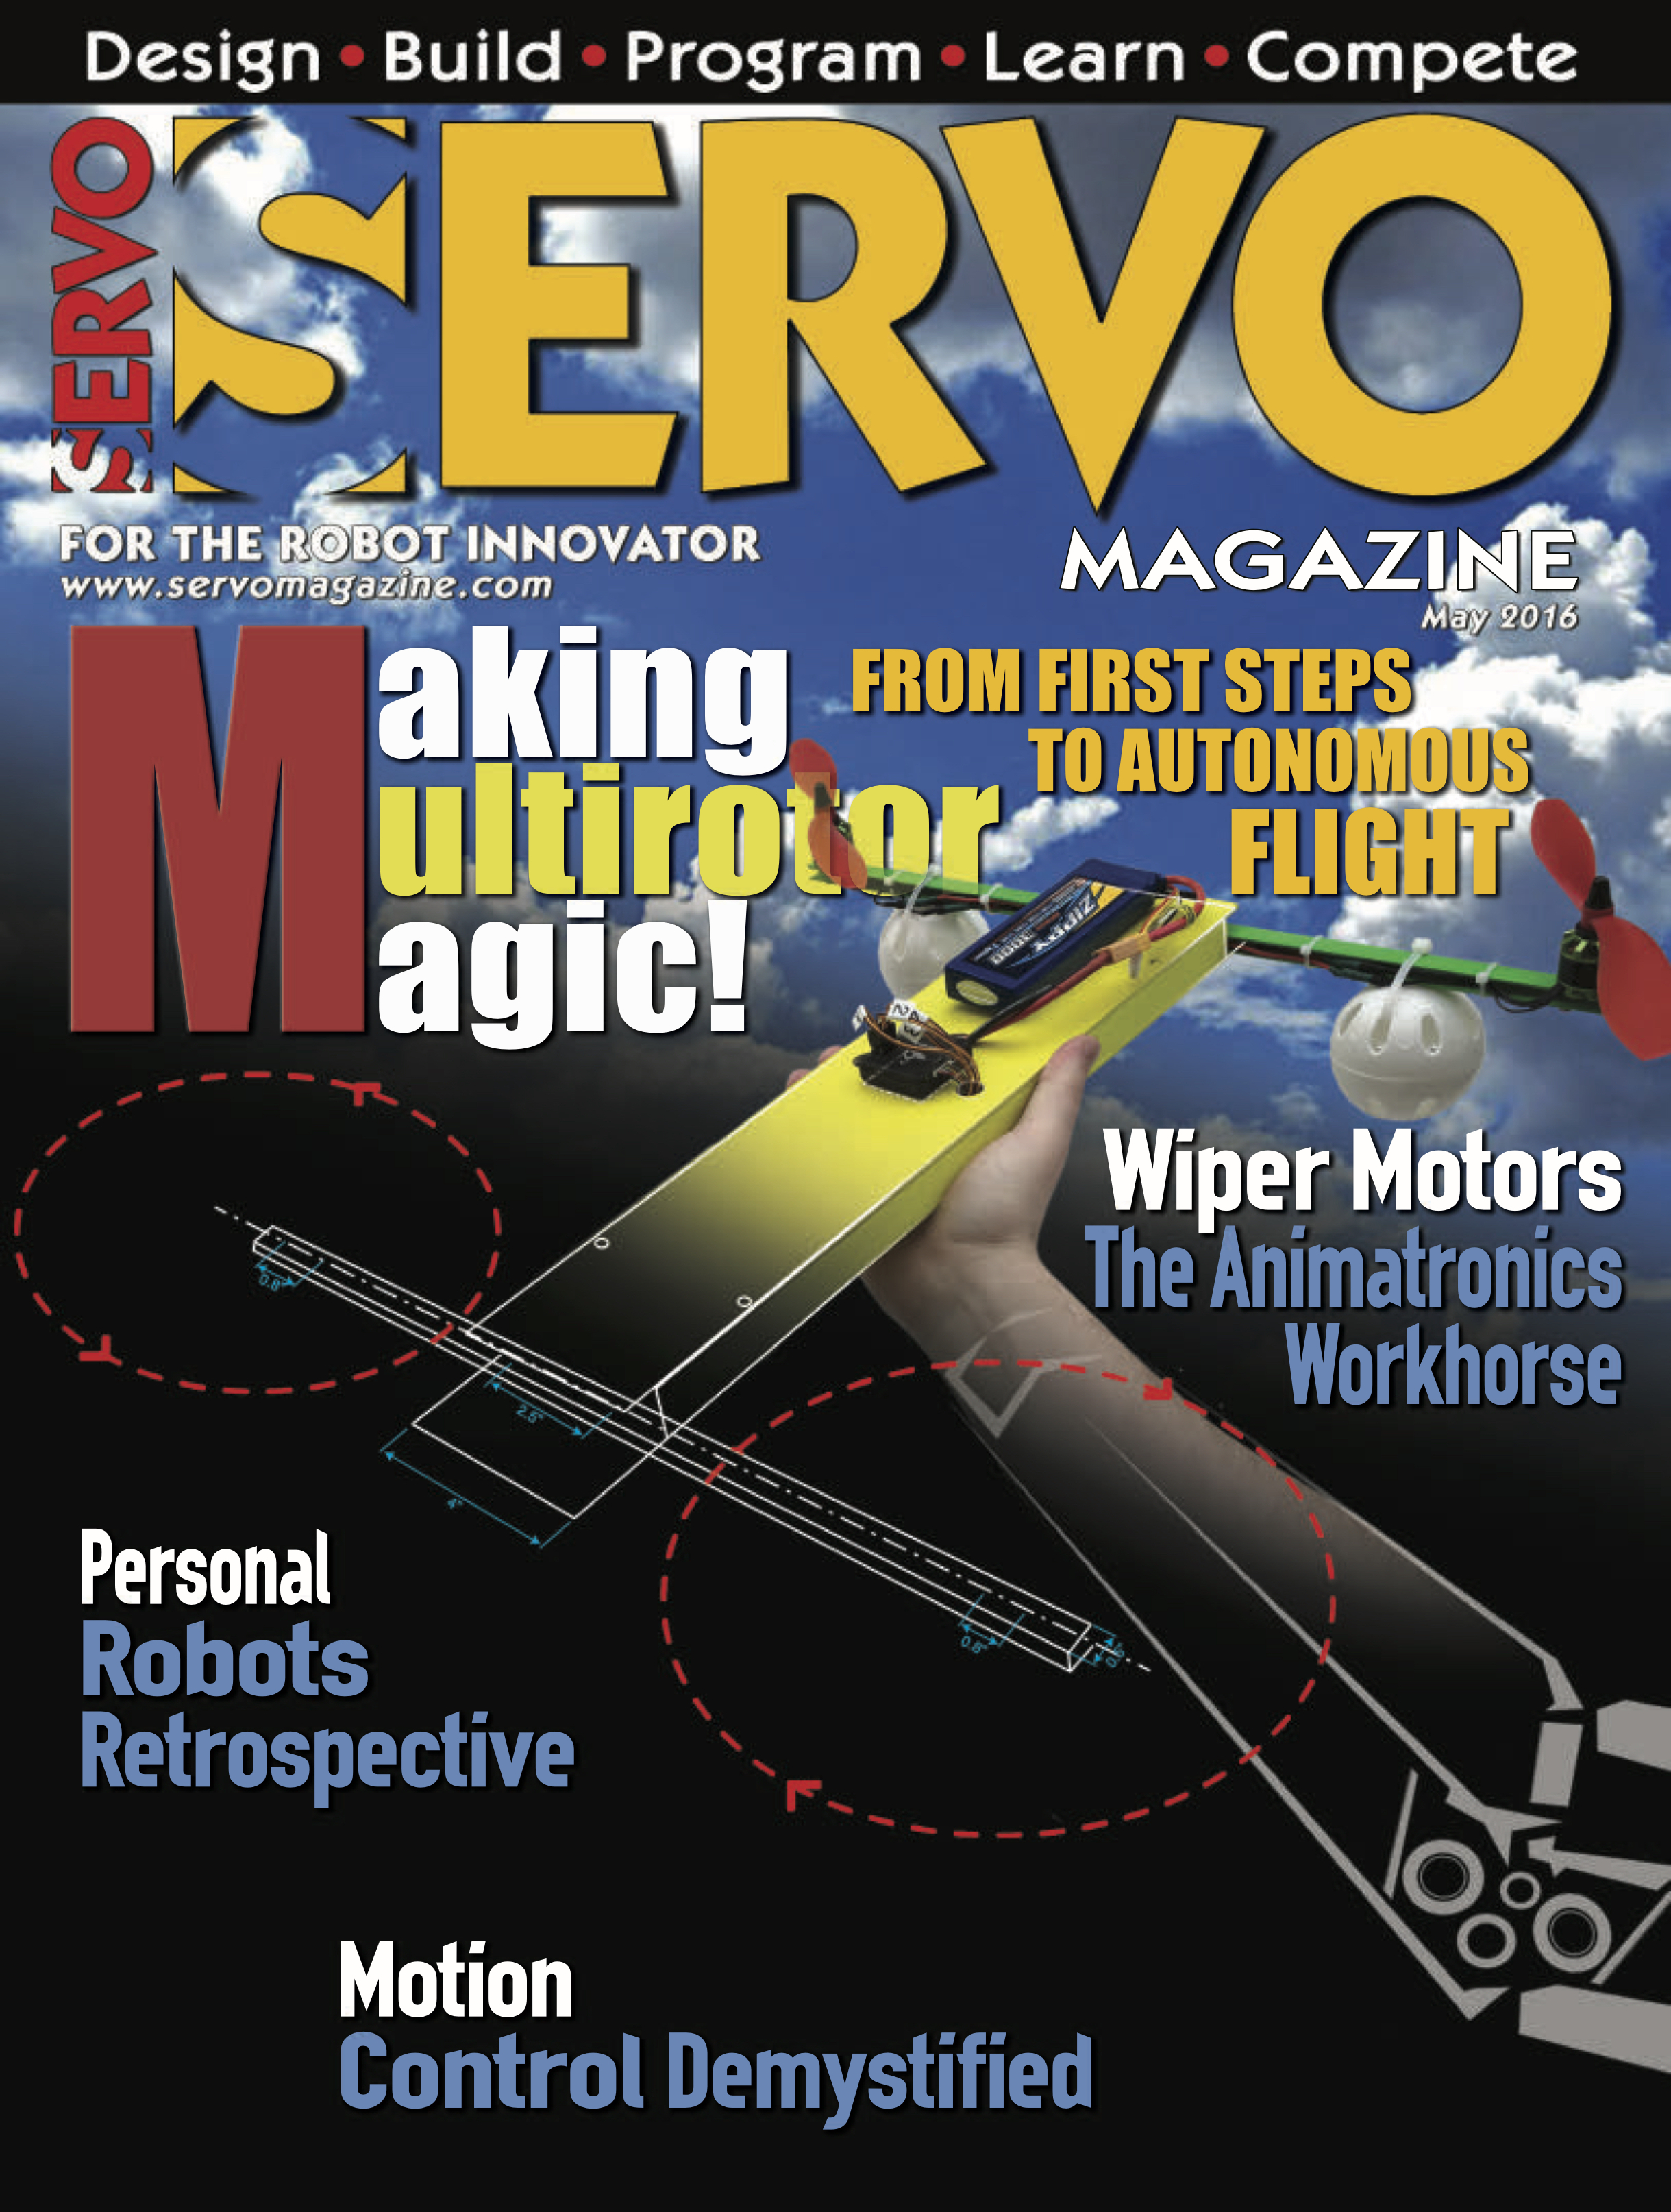
In this post, I wanted to share with you a video of the drone I scratch built flying around and encourage you to follow along and build it as well! The entire project cost about $350 and produced a really nice and versatile platform that I'm going to be adding instruments to, as well as GPS, telemetry, etc. The May issue of Servo featured the monthly column introduction on the cover! That column talks about FAA rules and how to get registered. The following columns are going to go through building the drone, step by step. We'll start off with the airframe, then move on to adding electronics, setting up the flight controller, and finally flying under manual and computer control. We already have other articles planned that include reviewing commercially available quads, as well as hardware hacking them for new functionality. If you like the blog, you might like to follow that series of articles as well!
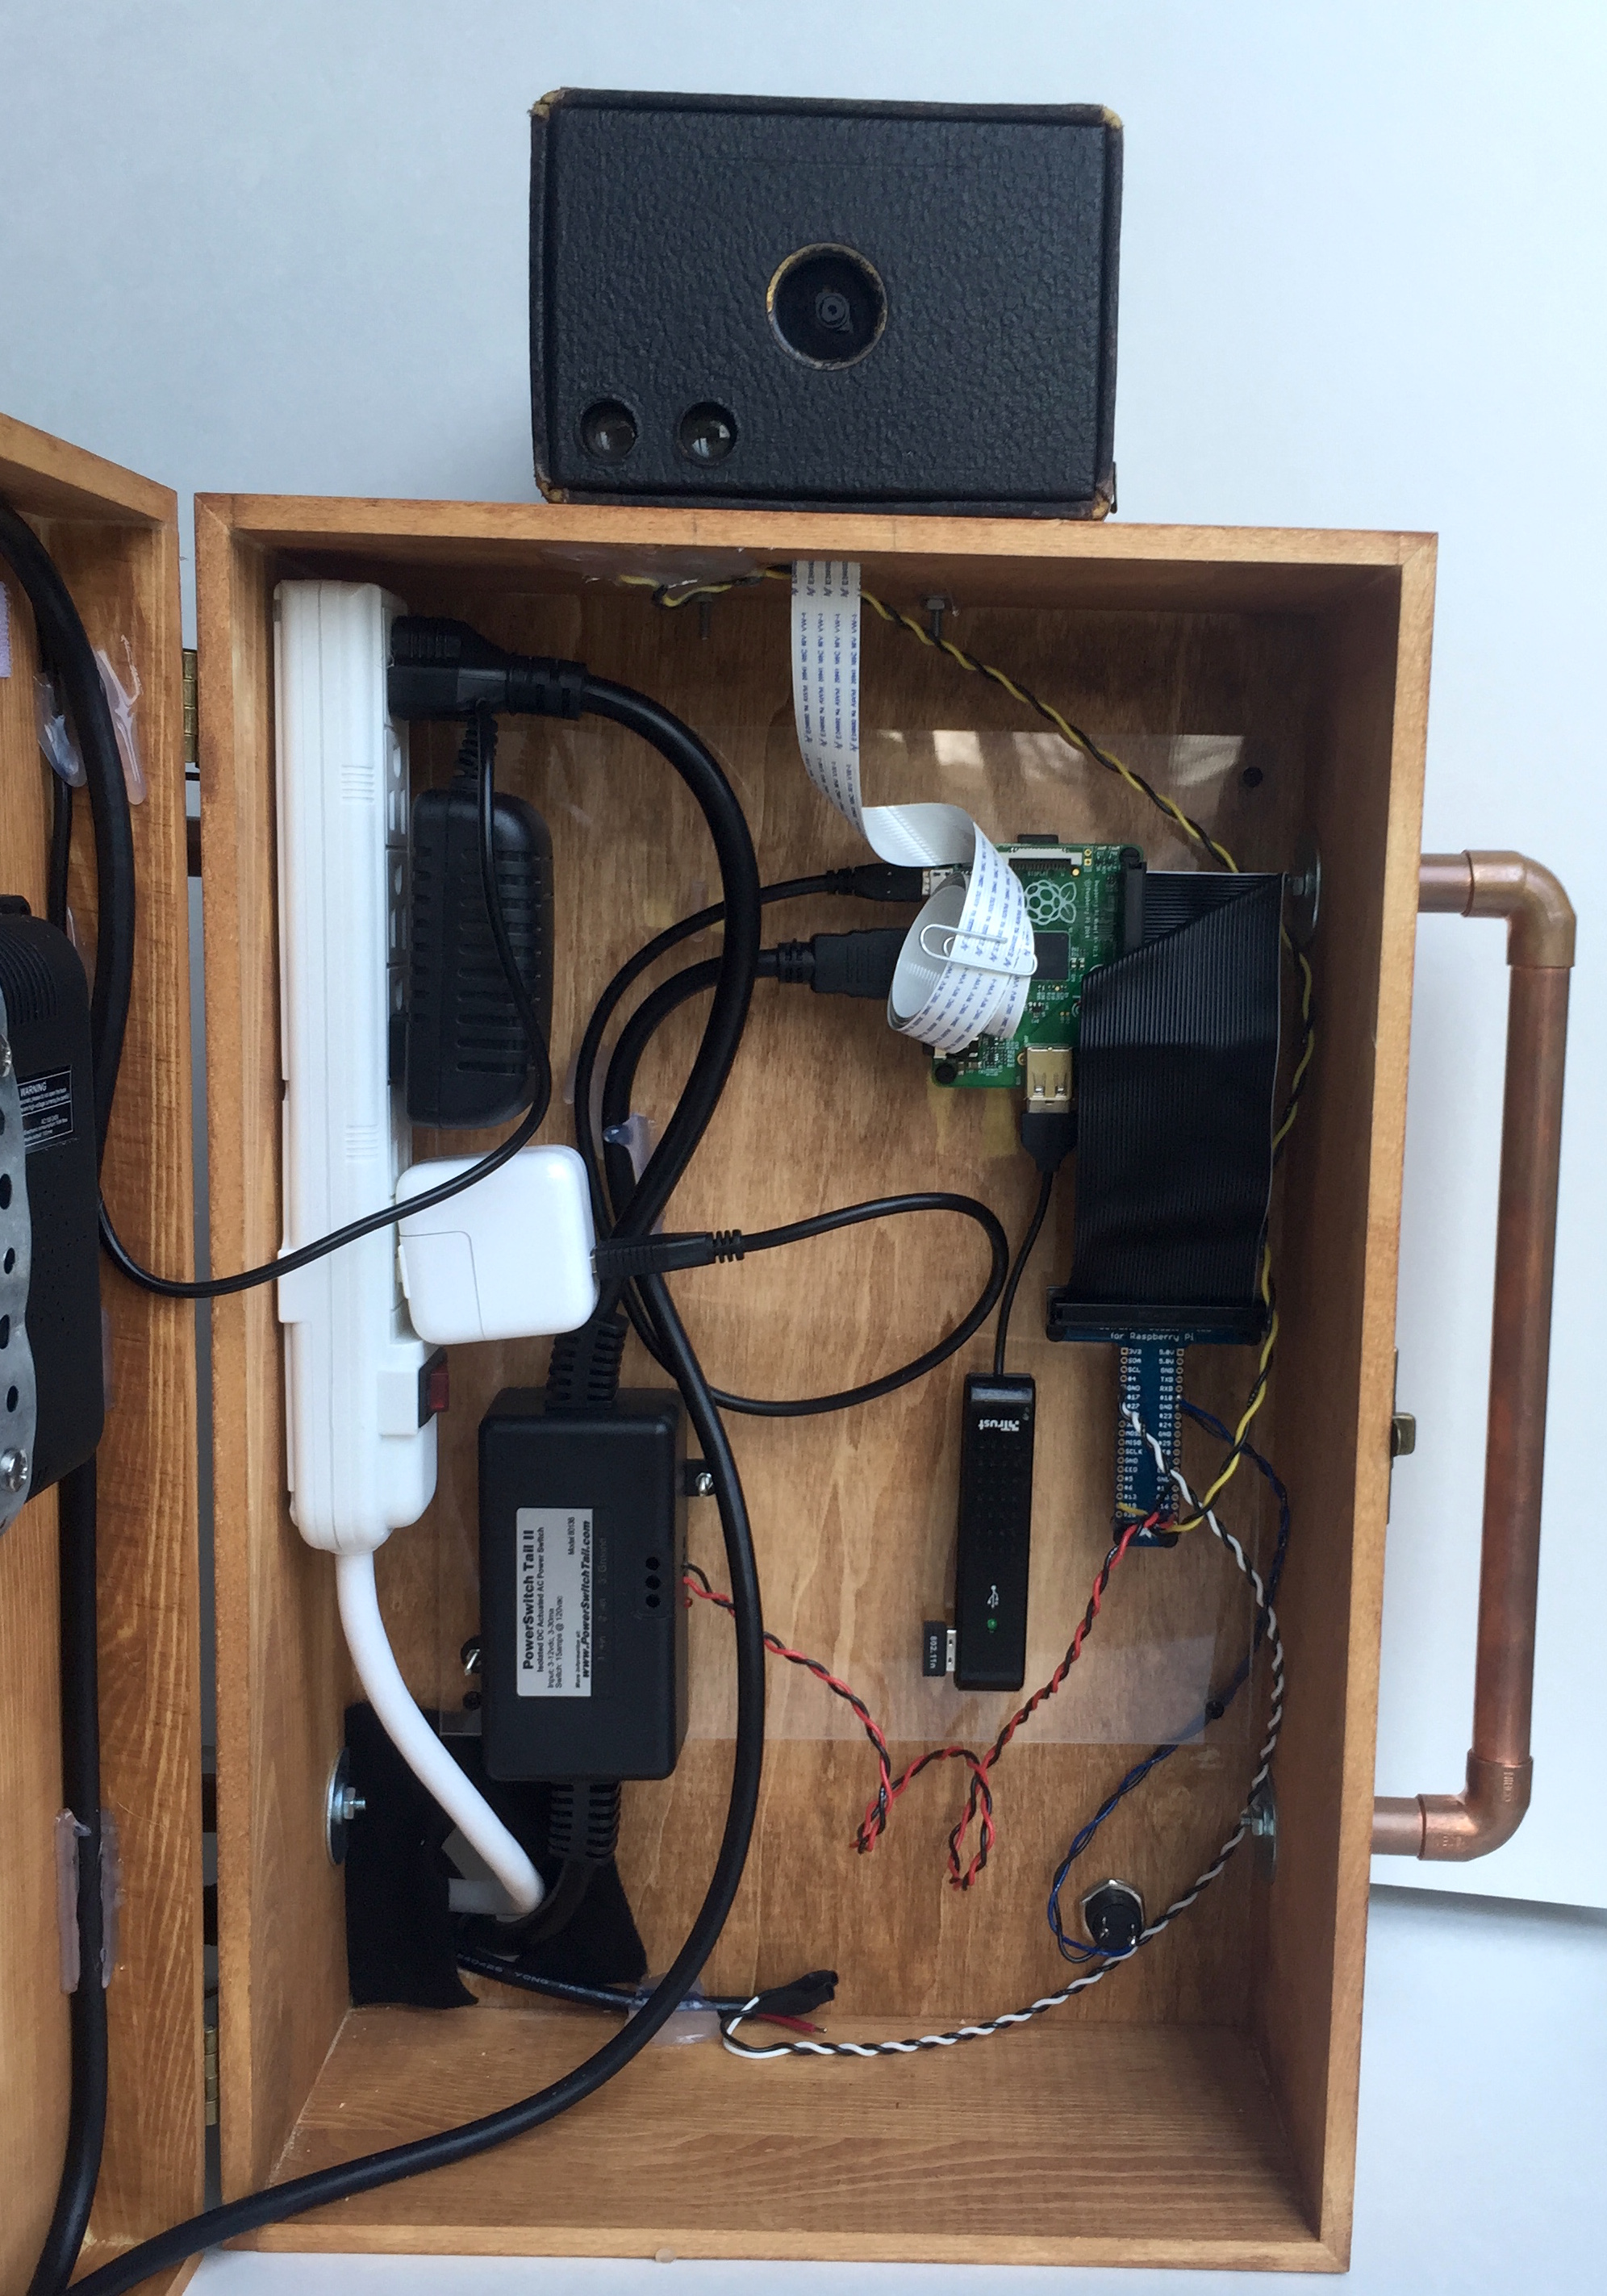
While getting wedding arrangements ready a few months ago, my wife commented that she would like a Photo Booth at the wedding. I immediately did what I always do, write a Python script. She was thinking more of a table with props and disposable camera approach, but I decided to make it into a project that we could use on any occasion and have some fun with the Raspberry Pi.
I searched online thinking that surely somebody had already done this project and posted their code and instructions. I found a few examples of Pi based photo booth projects, but none that had code attached (mostly they said "my code is awful, so I won't share") and none that did exactly what I wanted. I wanted the booth to count down, take multiple photos of the guests, and store/tweet the photos. I also wanted it to be simple to plug in and turn on with no experience required - same for shutdown.
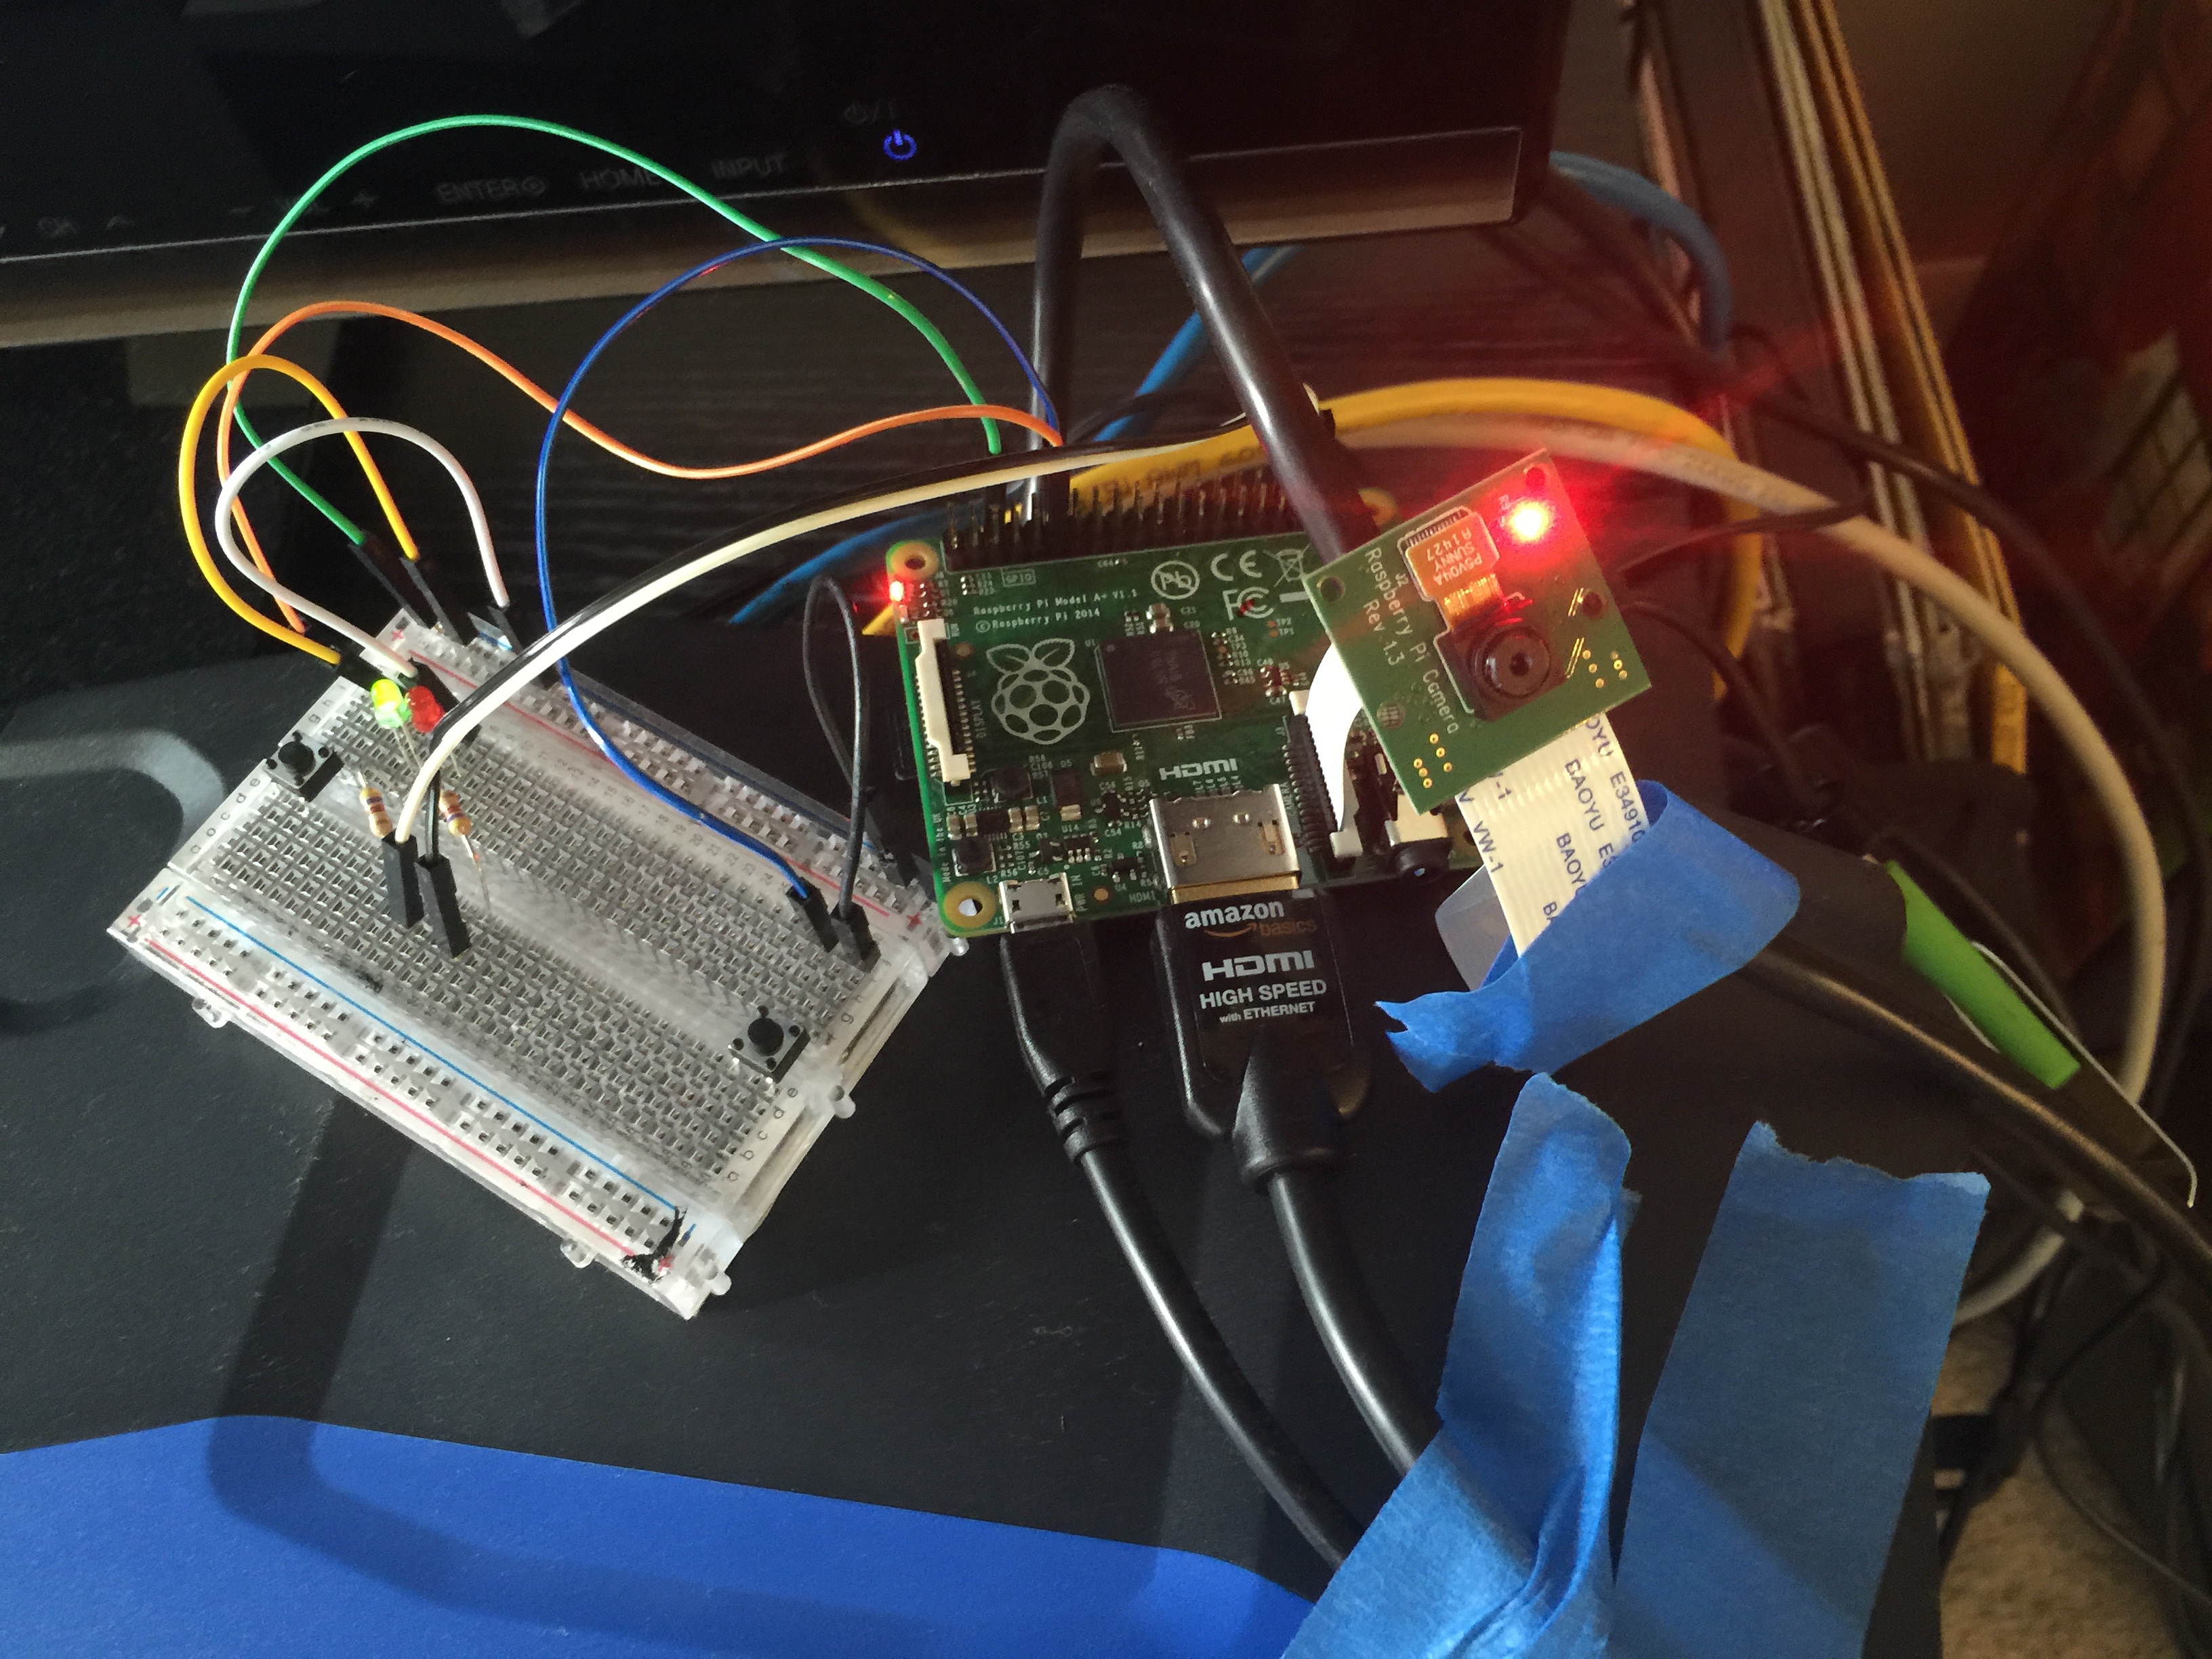
After a few afternoon coding sessions, I had the basic code and guts of the project working. A little time with some wood tools and I had a pretty decent looking enclosure setup as well!
An initial prototype circuit to test the code for the PiBooth.
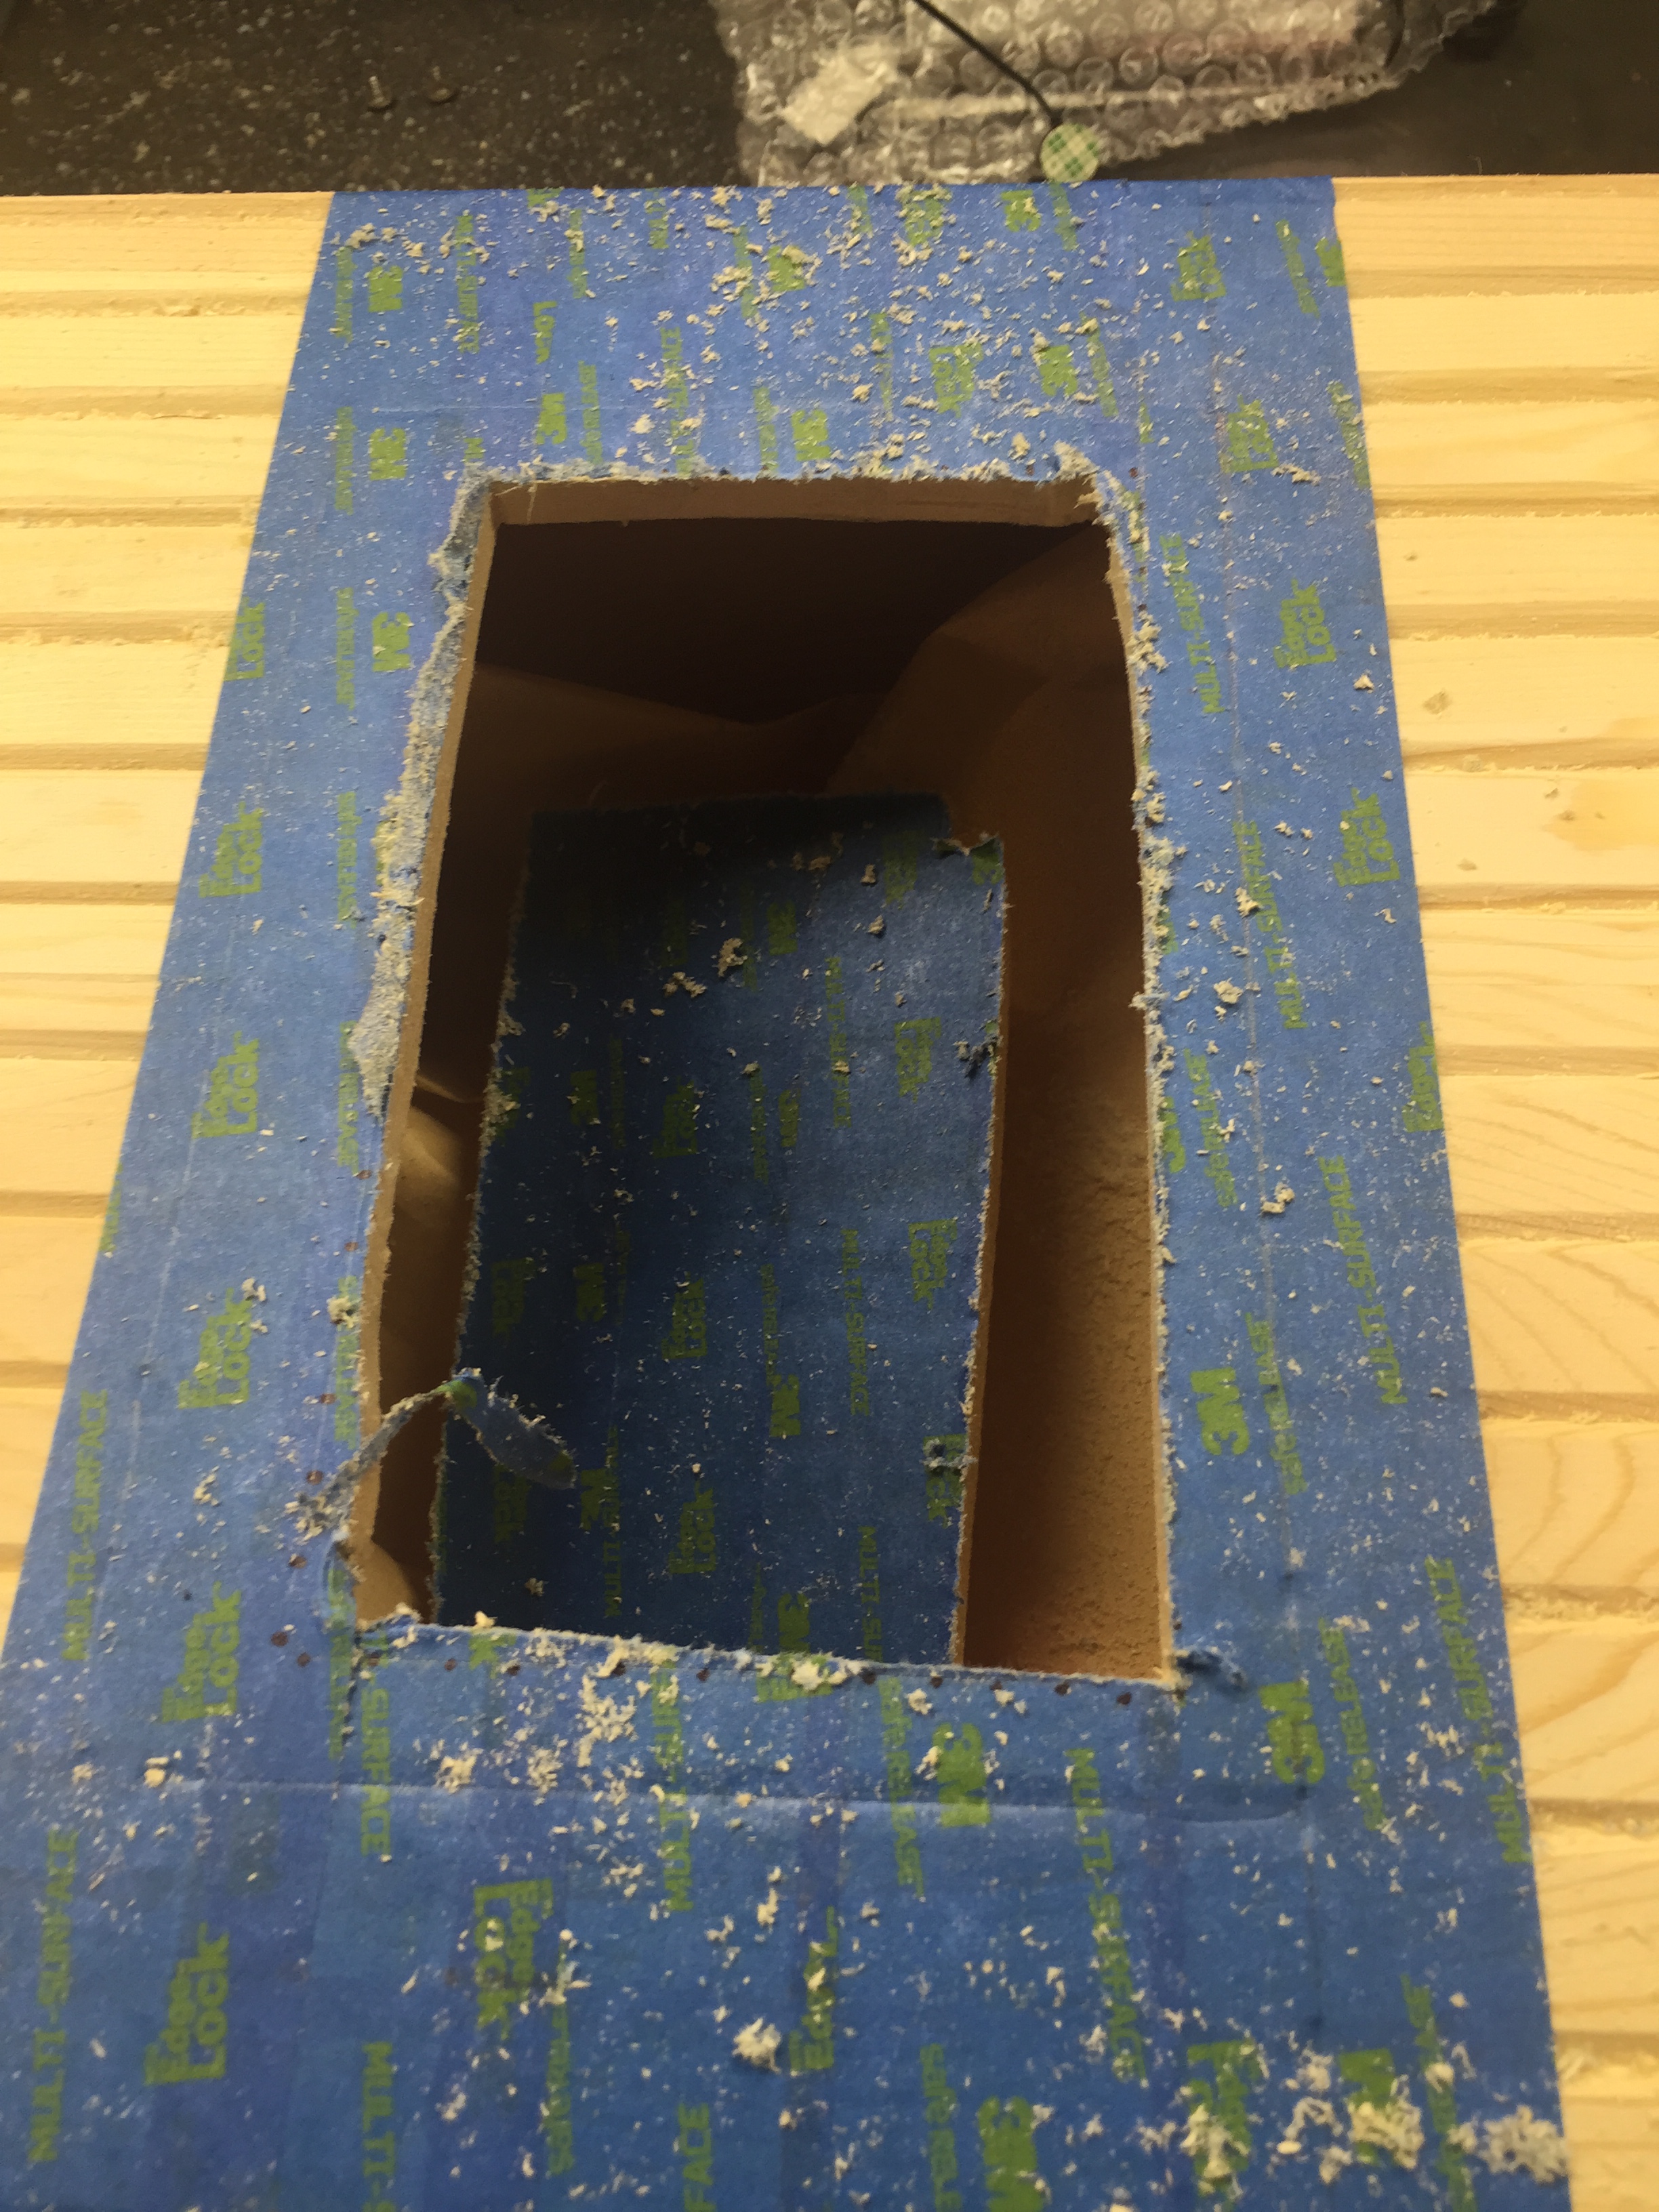
Rough cutting the hole for the photo booth screen in the shop.
I wanted to make sure that everything I did was out in the open to be reproduced. I ended up deciding to try writing a magazine article about the build for the electronics hobbyist magazine "Nuts and Volts." The editor sent me some guidelines and after a few hours I had a draft article. A couple of months passed by while we iterated on figures and ideas, but I was very excited when I was contacted saying that this article was being considered for the cover of the March 2016 issue. As you can see - it was selected! Be sure to grab a copy of Nuts and Volts (check your bookseller/news-stand) and read all of the details. You can grab the code over on the GitHub repository. Thank you to all the wonderful folks at the magazine for making this happen and thank you to my wife for letting me run wild with this project! Let me know if you build one, or a variant. The applications can range from parties/events to making an automated I.D. card station for your company!
As frequent readers of the blog or listeners of the podcast will know, I really like doing outreach activities. It's one thing to do meaningful science, but another entirely to be able to share that science with the people that paid for it (taxpayers generally) and show them why what we do matters. Outreach is also a great way to get young people interested in STEAM (Science, Technology, Engineering, Art, Math). When anyone you are talking to, adult or child, gets a concept that they never understood before, the lightbulb going on is obvious and very rewarding.
Our lab group recently participated in two outreach events. I've shared about the demonstrations we commonly use before when talking about a local science fair. There are a few that probably deserve their own videos or posts, but I wanted to share one in particular that I improved upon greatly this year: Squeezing Rocks.
Awhile back I shared a video that explained how rocks are like springs. The normal demonstration we used was a granite block with strain gauges on it and a strip chart recorder... yes... with paper and pen. I thought showing lab visitors such an old piece of technology was a bit ironic after they had just heard about our lab being one of the most advanced in the world. Indeed when I started the paper feed, a few parents would chuckle at recognizing the equipment from decades ago. For the video I made an on-screen chart recorder with an Arduino. That was better, but I felt there had to be a better way yet. Young children didn't really understand graphs or time series yet. Other than making the line wiggle, they didn't really get the idea that it represented the rock deforming as they stepped on it or squeezed it.
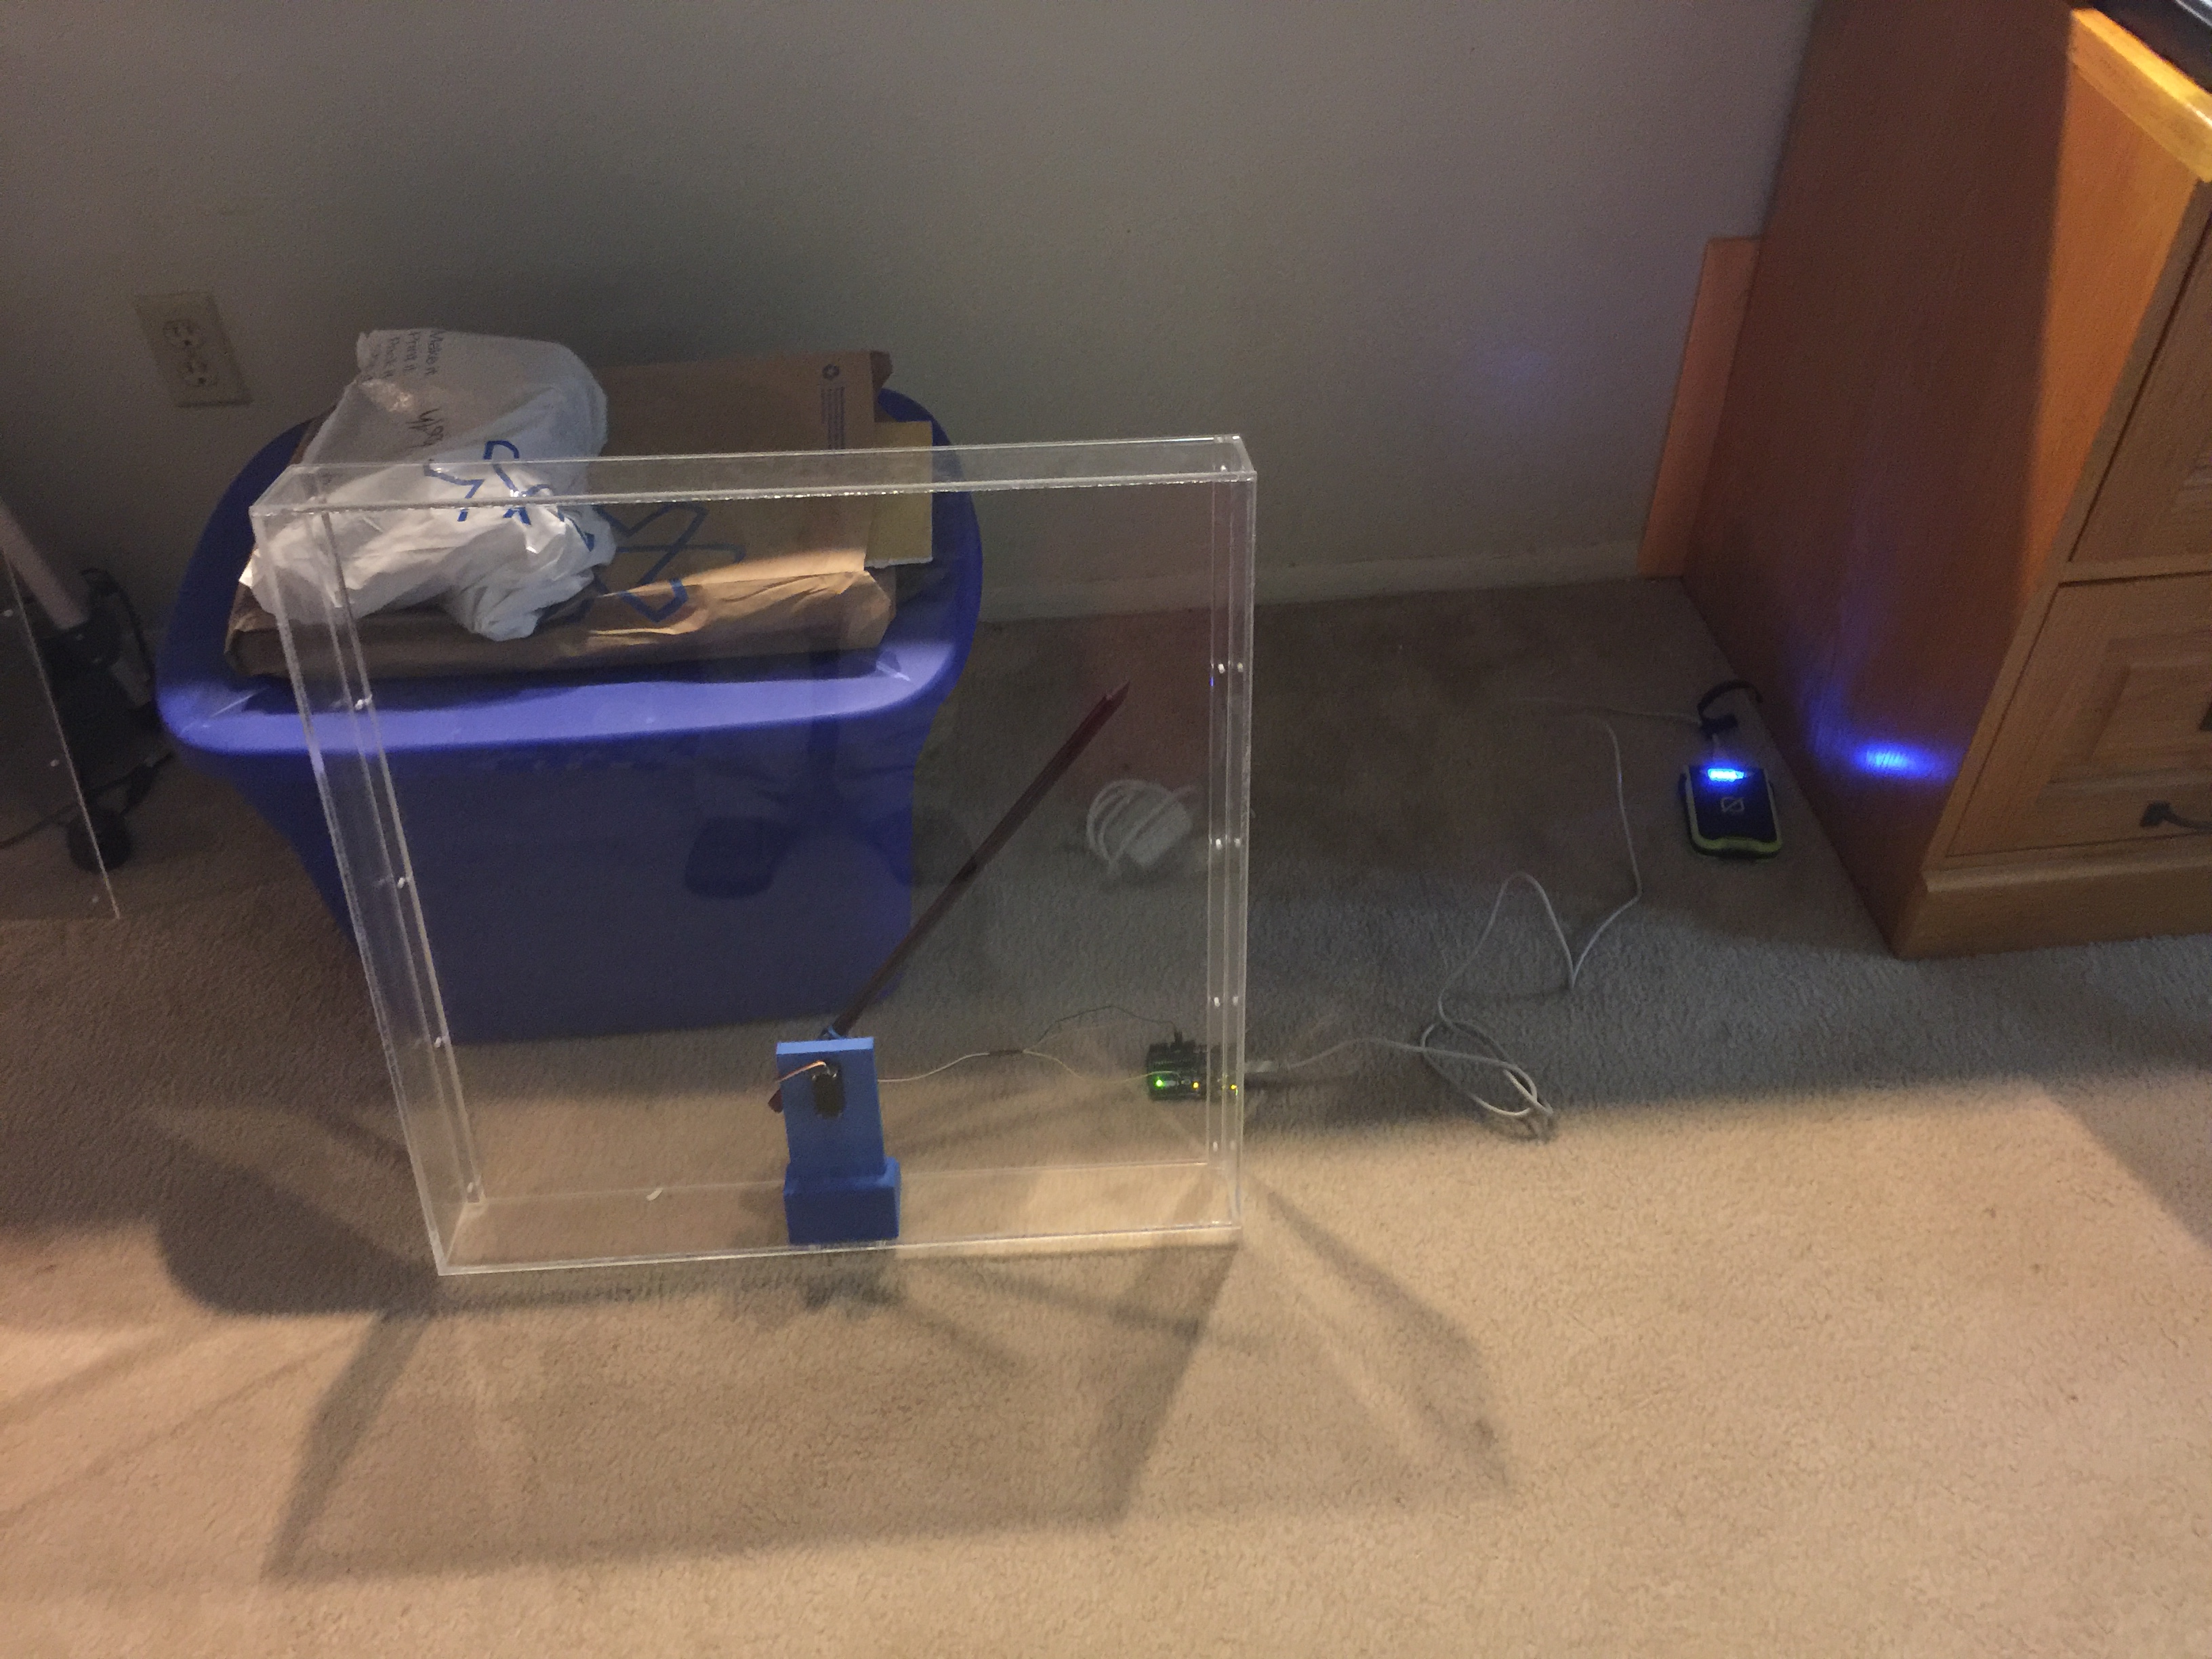
I decided to go semi old-school with a giant analog meter to show how much the rock was deformed. I wanted to avoid a lot of analog electronics as they always get finicky to setup, so I elected to go with the solution on a chip route with a micro-controller and the HX711 load cell amplifier/digitizer. For the giant meter, I didn't think building an actual meter movement was very practical, but a servo and plexiglass setup should work.
A very early test of the meters shows it's 3D printed servo holder inside and the electronics trailing behind.
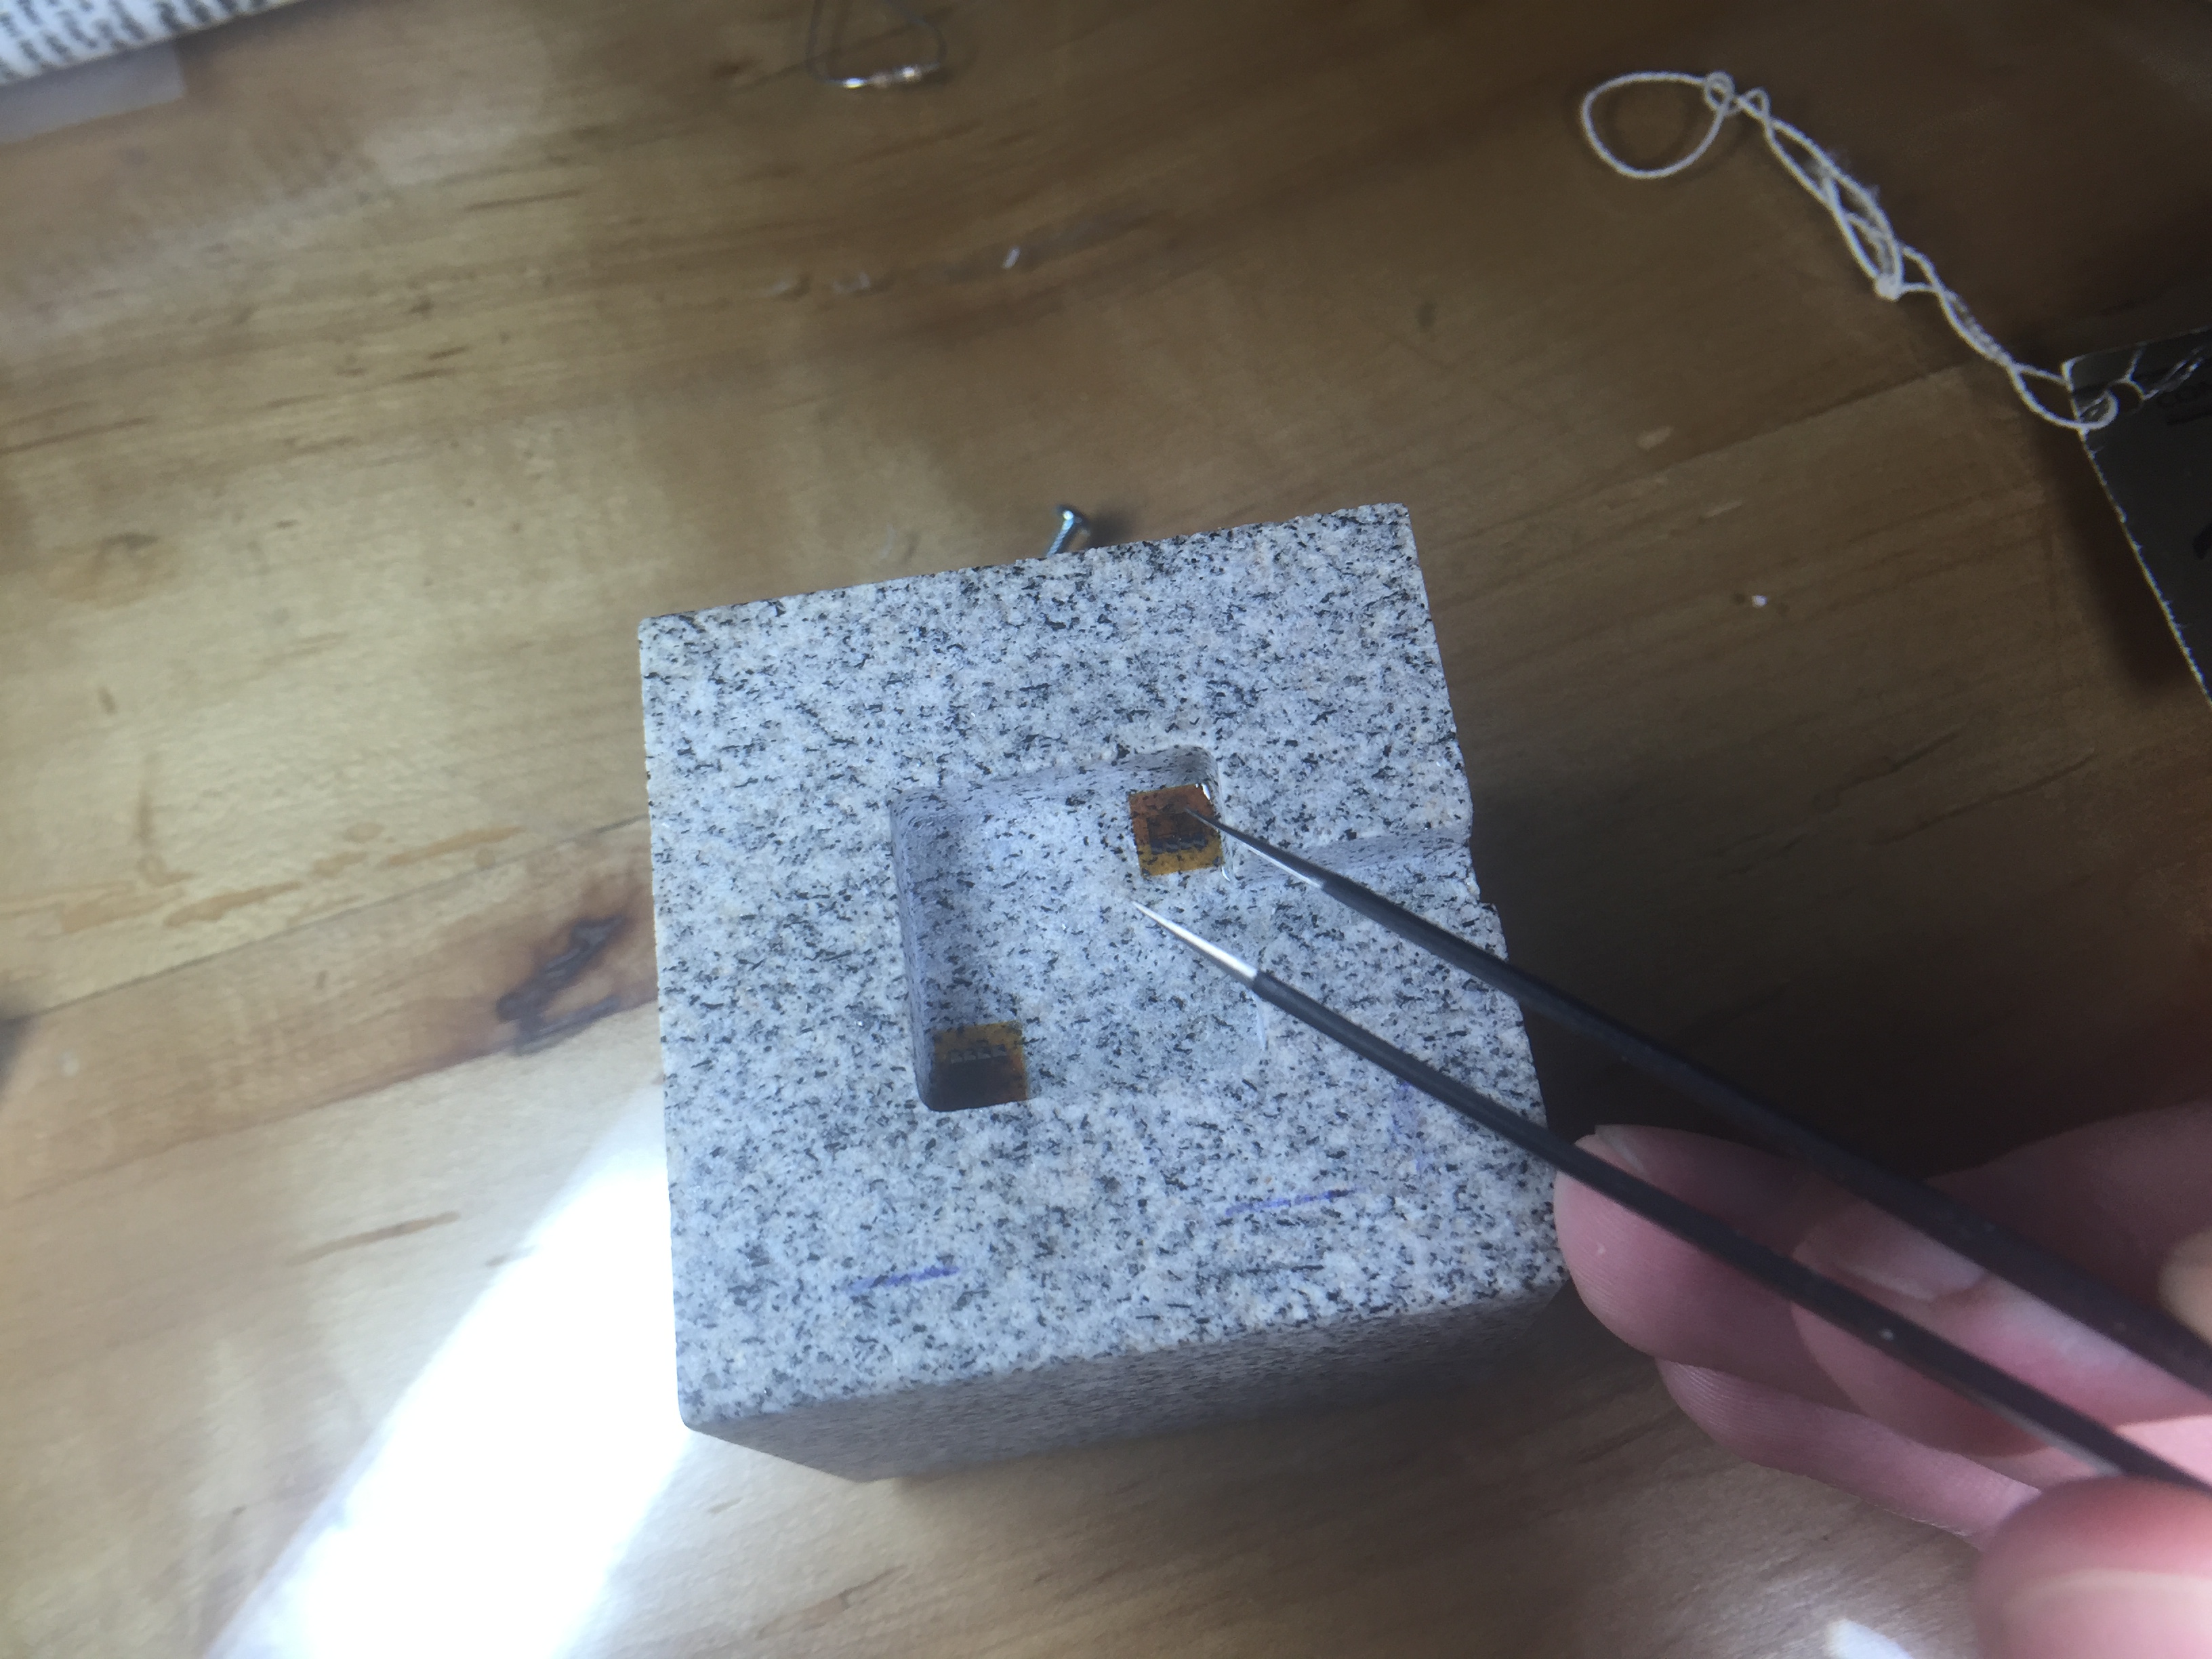
Another thing I wanted to change was the rock we use for the demo. The large granite bar you stepped on was bulky and hard to transport. I also though squeezing with your hands would add to the effect. We had a small cube of granite about 2" on a side cut with a water jet, then ground smooth. The machine shop milled out a 1/4" deep recess where I could epoxy the strain gauges.
Placing strain gauges under a magnifier with tweezers and epoxy.
Going into step-by-step build instructions is something I'm working on over at the project's Hack-a-Day page. I'm also getting the code and drawings together in a GitHub repository (slowly since it is job application time). Currently the instructions are lacking somewhat, but stay tuned. Checkout the video of the final product working below:
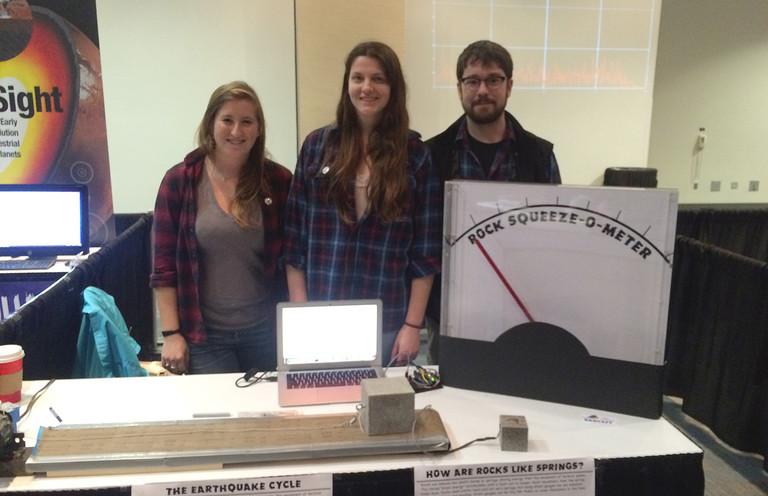
The demo was a great success. We debuted it at the AGU Exploration Station event. Penn State even wrote up a nice little article about our group. Parents and kids were amazed that they could deform the rock, and even more amazed when I told them that full scale on the meter was about 0.5µm of deformation. In other words they had compressed the rock about 1/40 the width of a single human hair.
A few lessons came out of this. Shipping an acrylic box is a bad idea. The meter was cracked on the side in return shipping. The damage is reparable, but I'm going to build a smaller (~12-18") unit with a wood frame and back and acrylic for the front panel. I also had a problem with parts breaking off the PCB in shipment. I wanted the electronics exposed for people to see, but maybe a clear case is best instead of open. I may try open one more time with a better case on it for transport. The final lesson was just how hard on equipment young kids can be. We had some enthusiastic rock squeezers, and by the end of the day the insulation on the wires to the rock was starting to crack. I'm still not sure what the best way to deal with this is, but I'm going to try a jacketed cable for starters.
Keep an eye on the project page for updates and if any big changes are made, you'll see them here on the blog as well. I'm still thinking of ways to improve this demo and a few others, but this was a giant step forward. Kids seeing a big "Rock Squeeze O Meter" was a real attention getter.
Hmm... As I'm writing this I'm thinking about a giant LED bar graph. It's easy to transport and kind of like those test your strength games at the fair... I think I better go parts shopping.
I've been working on developing some geophysical instruments that will need some significant temperature compensation. Often times when you buy a sensor there is some temperature dependance (if not humidity, pressure, and a slew of other variables). The manufacturer will generally quote a compensation figure. Say we are measuring voltage with an analog-to-digital converter (ADC); the temperature dependance may be quoted as some number of volts per degree of temperature change over a certain range of voltages and temperatures. Generally this is a linear correction. Most of the time that is good enough, but for scientific applications we sometimes need to squeeze out every error we can and compare instruments. Maybe one sensor is sightly more temperature dependent than another; comparing the sensors could then lead us to some false conclusions. This means that sometimes we need to calibrate every sensor we are going to use. In the lab I work in, we calibrate all of our transducers every 6 months by using transfer standards. (Standards, transfer of standards, and calibration theory are a whole series of posts in themselves.)
To do thermal calibrations it is common to put the instruments into a thermal chamber in which we can vary the temperature over a wide range of conditions while keeping the physical variable we are measuring (voltage, pressure, load, etc) constant. Then we know any change in the reading is due to thermal effects on the system. If we are measuring something like tilt or displacement, we have to be sure that we are calibrating the electronics, not signals from thermal expansion of metals and materials that make up our testing jig.
I scoured EBay and the surplus store at our University, but only found very large and expensive units. I remembered that several years ago Dave Jones over at the EEVBlog had mentioned a cheap alternative made from a peltier device wine cooler. I dug up his video (below) and went to the web again in search of the device.
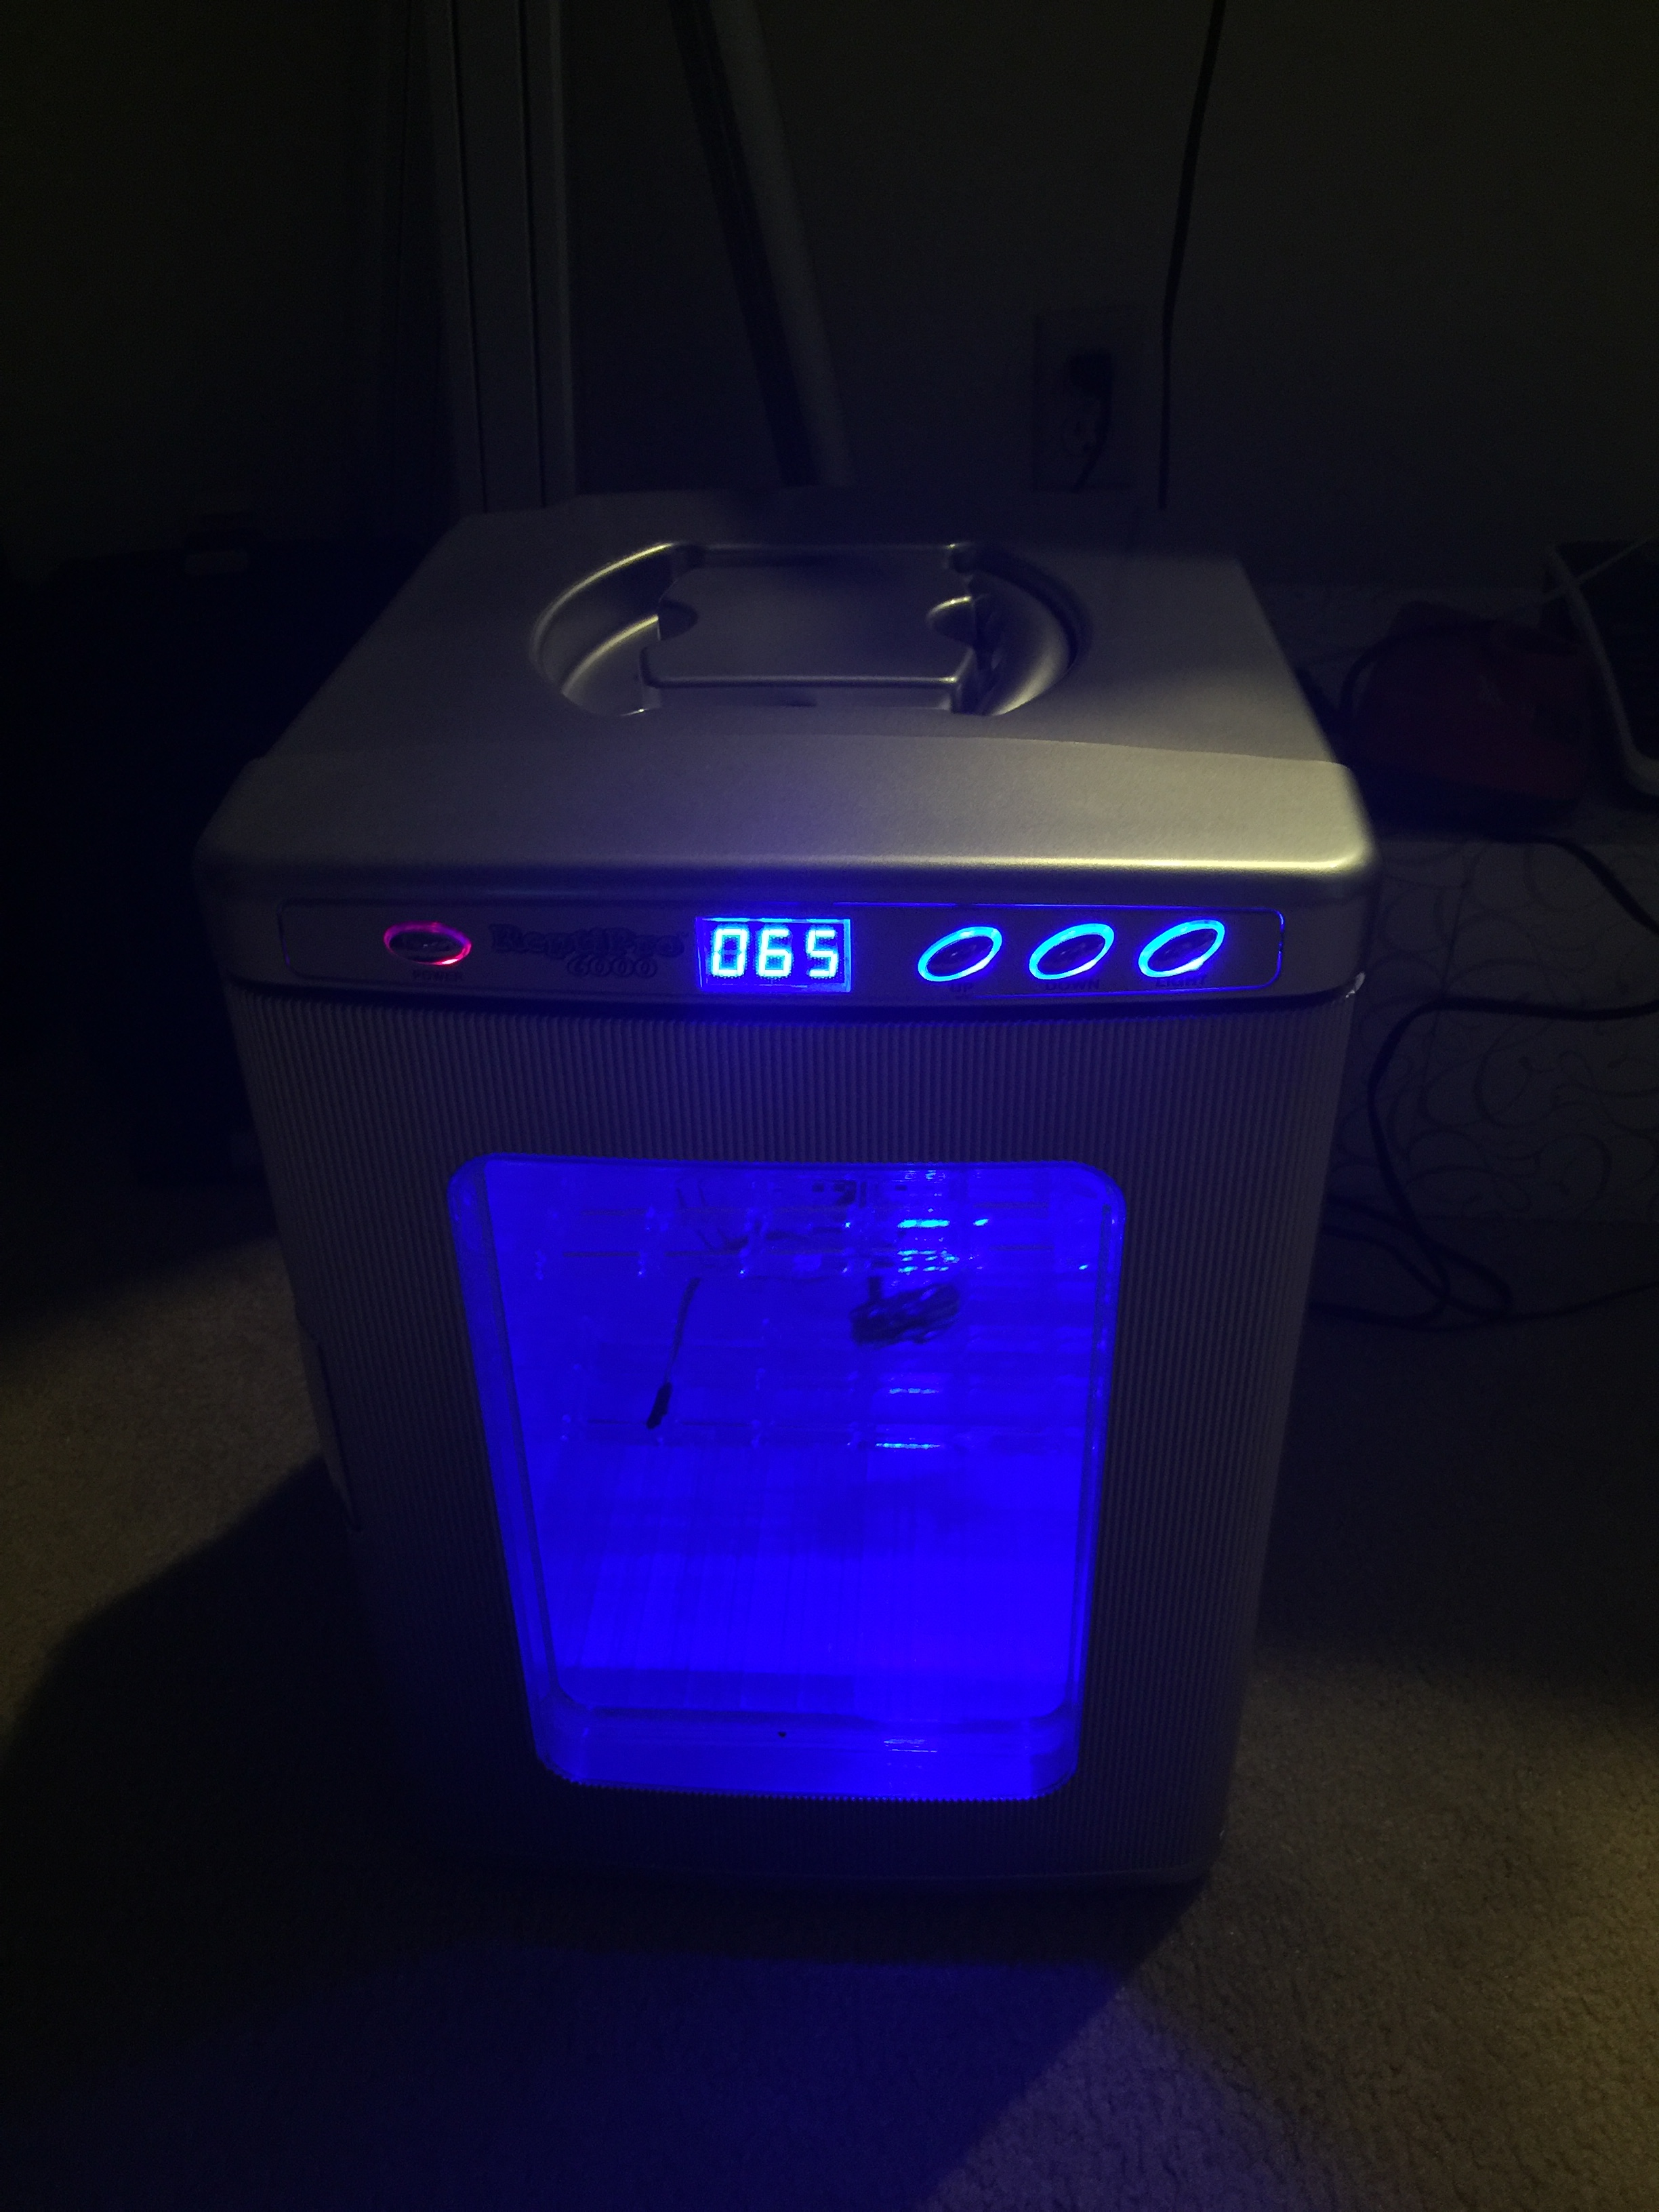
I found the chamber marketed as a reptile egg incubator on Amazon. The reviews were not great, some saying the unit was off by several degrees or did not maintain the +/- 1 degree temperature as marketed. I decided to give it a shot since it was the only affordable alternative and if it didn't work, maybe I could hack it with a new control system and use the box/peltier element with my own system. In this post I'm going to show you the stock performance of the chamber and some initial tests to figure out if it will do the job.
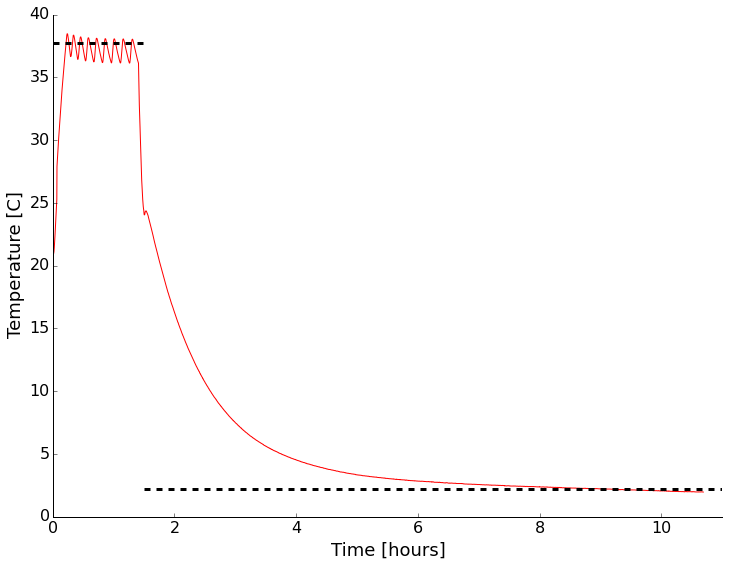
As soon as it arrived I setup the unit and put an environmental sensor in (my WxBackpack for the Light Blue Bean used back in the drone post) inside. I wanted to see if it was even close to the temperature displayed on the front and how good the control was with no thermal load inside. There was a small data drop-out causing a kink early in the record (around 30 C). It looks like the temperature is right on what I had set it to with the quoted +/- 1 degree range. There is some stabilization time and the mean isn't the same as the set point, but that makes sense to me, you don't want to overheat eggs! This looks encouraging overall. I also noticed that the LED light inside the chamber flickered wildly when the peltier device was drawing a lot of power heating/cooling the system. I then opened the door and set the unit to cool. After reaching room temperature, I closed the door and went to bed. It certainly isn't fast, but I was able to get down to about 2C with no thermal load. That was good enough for me. Time to add a cable port, checkout the LED issue, and test with some water jars for more thermal mass.
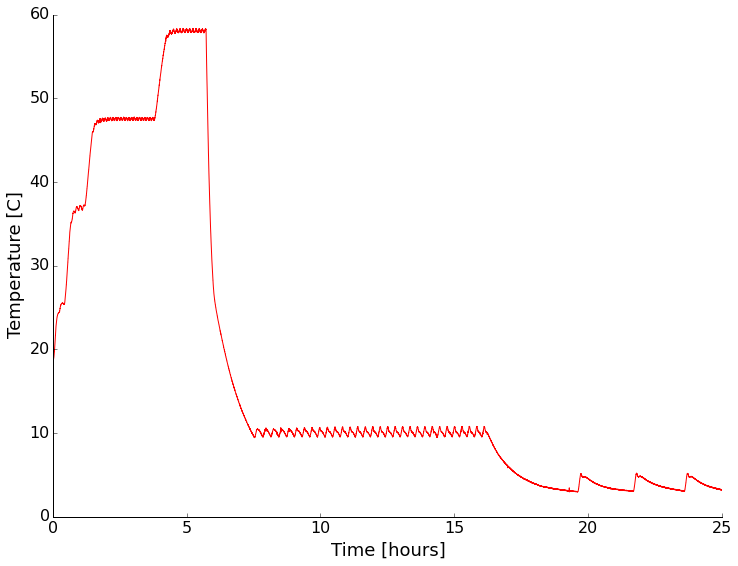
Initial test of the thermal chamber with nothing inside except a temperature logger. Set point shown by dashed line.
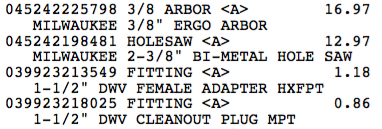
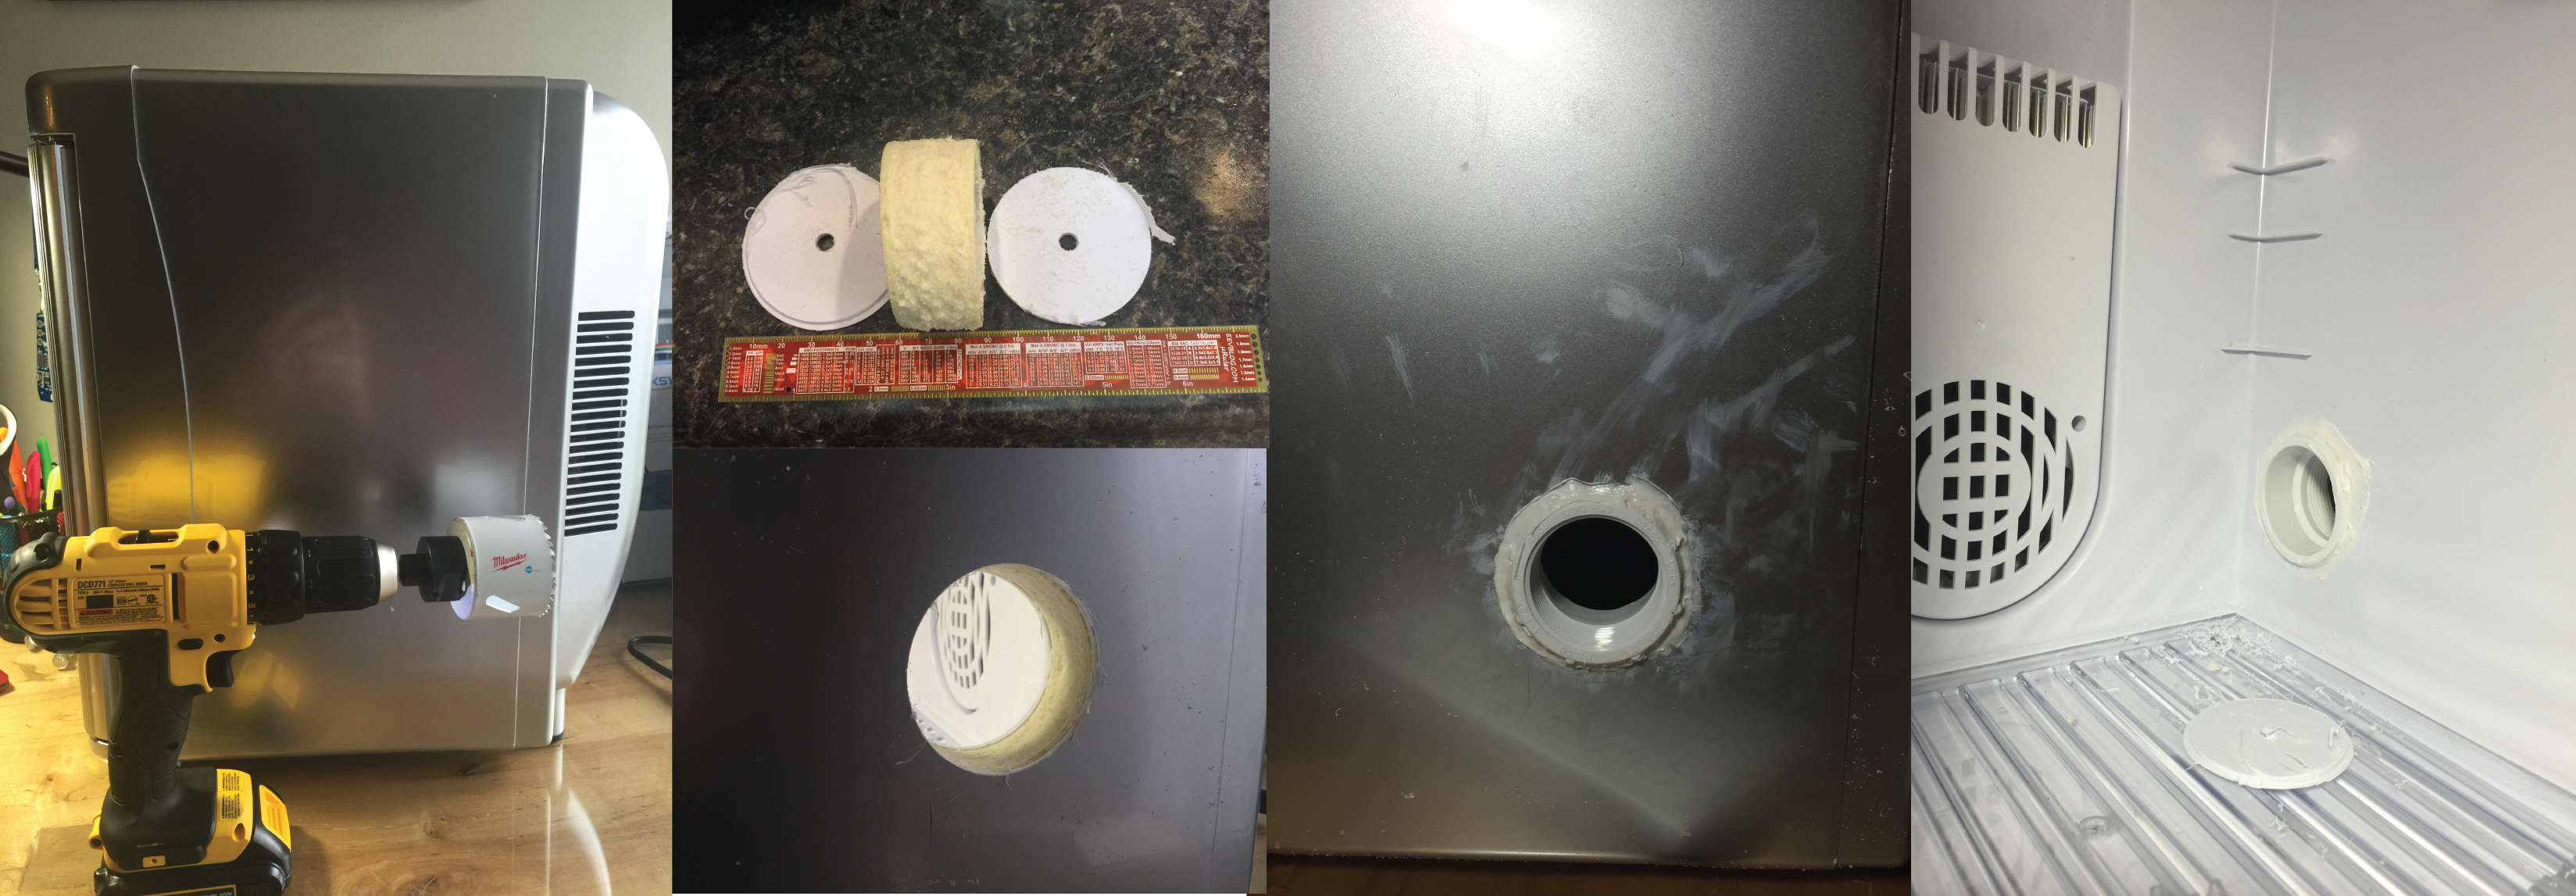
The next step was to add a cable port to be able to get test cables in and out. I decided to follow what Dave did and add a 1.5" test port with a PVC fitting, a hole saw, and some silicone sealant. Below are a few pictures of drilling and inserting the fitting. I used Home Depot parts (listing below). I didn't have the correct size hole-saw. That's happened a lot lately, so I invested in the Milwaukee interchangeable system. I got a threaded fitting so I can put a plug in if needed. the time honored tradition is to put your cables through the port and stuff a rag in though. This works as well as a plug generally, but it's nice to have the option.
Before, during, and after cable port placement. The center of the hole is 7 3/8" back from the front door seal, and 5 1/8" up from table top level. I used gel super glue to quickly fix the fitting to the plastic layers and foam. After that dried, I used silicone bath adhesive/sealant to seal the inside and outside. The edge of a junk-mail credit card offer made smoothing the silicone easier.
While working inside the chamber I pulled out the LED board and noticed a dodgy looking solder joint. I reflowed it. I also pulled the back off the unit to make sure there were no dangerous connections or anything that looked poor quality. Nothing jumped out.
I put the whole thing back together and put a sensor in to monitor the environment and tested again. This time I tried a few different set points with and without containers of water inside the chamber. First with nothing but the sensor setup inside:
For both heating and cooling the performance under no thermal load (other than the sensor electronics) was pretty good. Cooling is rather slow and more poorly controlled than heating though.
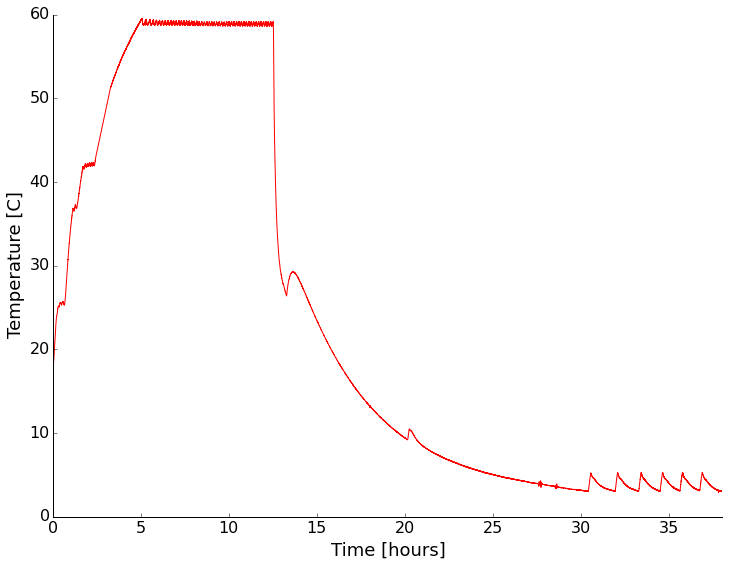
Next I put sealed containers of water on the shelves of the chamber to add some thermal mass and see if that changed the characteristics of the chamber any. It did slow the temperature change as expected, but appears to have had little other effect (I didn't wait long enough for stabilization on some settings).
With a water load the chamber had similar performance, but was slower in getting to temperature as expected.
It looks like at temperatures above ambient the chamber has a stability of +/- 1 degree. Below ambient it becomes a couple of degrees. The absolute reading drifts a bit too. Setting the chamber to a given reading always resulted in stabilization within about a degree of the setting though.
I think this will be a nice addition to my home lab. While the unit isn't incredibly accurate, I will be recording the device temperature anyway, so that works for me. It'd be nice to cool down more quickly though, so I may facilitate that with some dry ice. Stay tuned as I'll be testing instruments in there sometime in the next month or so.
P.S. - The LED light still flickers in a way that indicates unstable power/connection. Not a deal breaker for me since I don't really need the light, but something to remember.
I end up doing a lot of debugging, in fact every single day I'm debugging something. Some days it is software and scripts that I'm using for my PhD research, some days it is failed laboratory equipment, and some days it's working the problems out of a new instrument design. Growing up working on mechanical things really helped me develop a knack for isolating problems, but this is not knowledge that everyone has the occasion to develop. I'm always looking for ways to help people learn good debugging techniques. There's nothing like discovering, tracking down, and fixing a bug in something. Also, the more good debuggers there are in the world, the fewer hours are waisted fruitlessly guessing at problems.
I'd heard about a debugging book that was supposed to be good for any level of debugger, from engineer to manager to homeowner. I was a little suspicious since the is such a wide audience, but I found that my library had the book and checked it out; it is "Debugging: The 9 Indispensable Rules for Finding Even the Most Elusive Software and Hardware Problems" by David Agans. The book sat on my shelf for a few months while I was "too busy" to read it. Finally, I decided to tackle a chapter a day. The chapters are short and I can handle two weeks of following the book. Each morning when I got to work, I read the chapter for that day. One weekend I read an extra chapter or two because they were enjoyable.
I'm not going to ruin the book, but I am going to tell you the 9 rules (it's okay, they are also available in poster form on the book website).
Understand the System
Make It Fail
Quit Thinking and Look
Divide and Conquer
Change One Thing at a Time
Keep an Audit Trail
Check the Plug
Get a Fresh View
If You Didn't Fix It, It Ain't Fixed
They seem simple, but think of the times you've tried to fix something and skipped around because you thought you knew better to have it come back to sting you. If you've done a lot of debugging, you can already see the value of this book.
The book contains a lot of "war stories" that tell tales of when a rule or several rules were the key in a debugging problem. My personal favorite was the story about a video conferencing system that seemed to randomly crash. Turns out the compression of the video had problems with certain patterns and when the author wore a plaid shirt to work and would test the system, it failed. He ended up sending photocopies of his shirt to the manufacturer of the chip. Fun stories like that made the book fun to read and show how you have to pay attention to everything when debugging.
The book has a slight hardware leaning, but has examples of software, hardware, and home appliances. I think that all experimentalists or engineers should read this early on in their education. It'll save hours of time and make you seem like a bug whisperer. Managers can learn from this too and see the need to provide proper time, tools, and support to engineering.
If you like the blog, you'll probably like this book or know someone that needs it for Christmas. I am not being paid to write this, I don't know the author or publisher, but wanted to share this find with the blog audience. Enjoy and leave any comments about resources or your own debugging issues!
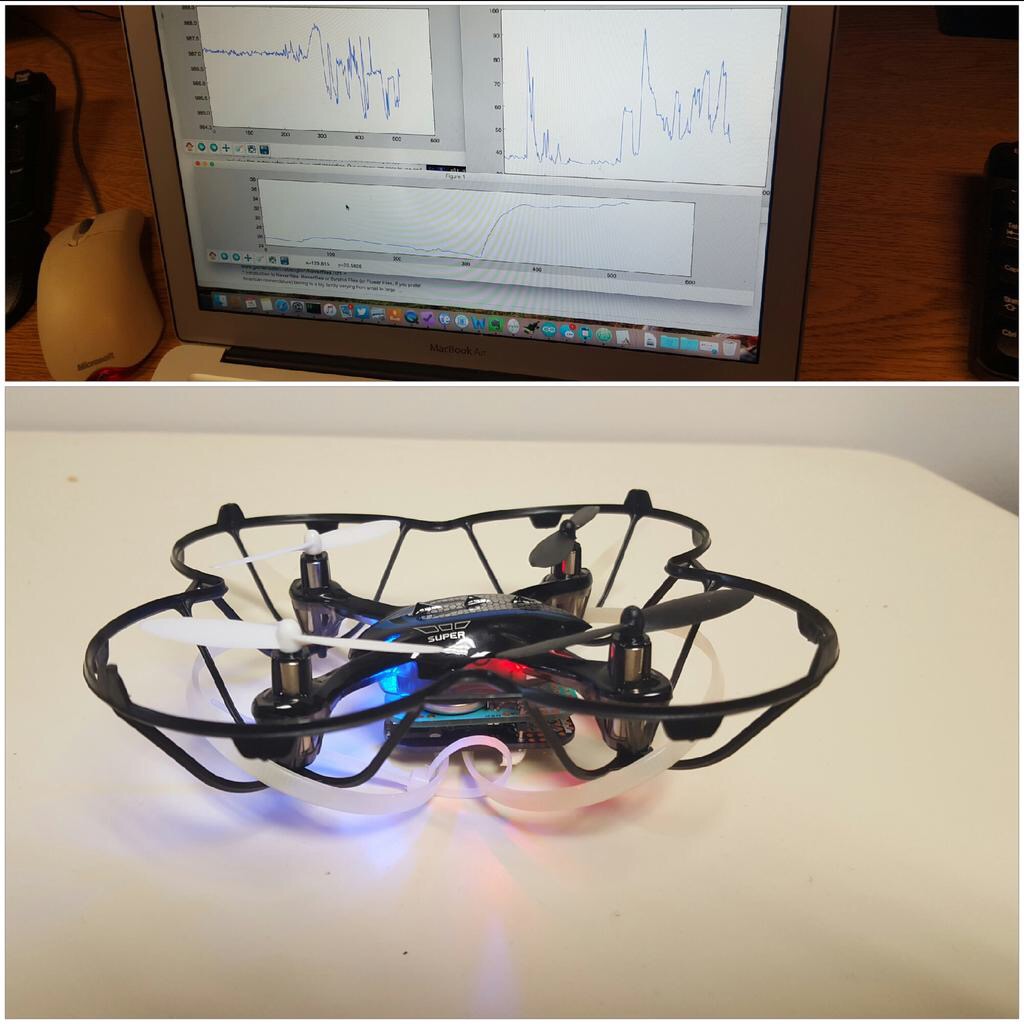
Again we have a short project post in-between the posts of the open science series (part 3 coming soon)! This time I want to share a fun little project involving cheap drones and an instrument pack that I designed on top of the Light Blue Bean module. The pack uses an HTU21D temperature/humidity sensor and a BME180 pressure sensor. I designed the board in the open-source PCB/EDA tool KiCAD. Should you want to reproduce the boards, the files to send off to a board house are available on a GitHub repository here.
I designed the pack to be a measurement device for a home, truck, or airplane of the weather enthusiast or storm chaser. Ideally it will send the data to a smartphone/tablet that then sends it out to the web or lets you do whatever you want with it. It was also a good excuse to play with the bean after hearing about it. While delivering another product to a friend, we decided to strap this sensor to a small and cheap ($33) drone and see what happened. We got some vague data, but the drone didn't get over a few meters high due to the high load. Zip ties provided some protection on takeoff/landing.
Our initial test flight with some quick plots in the background.
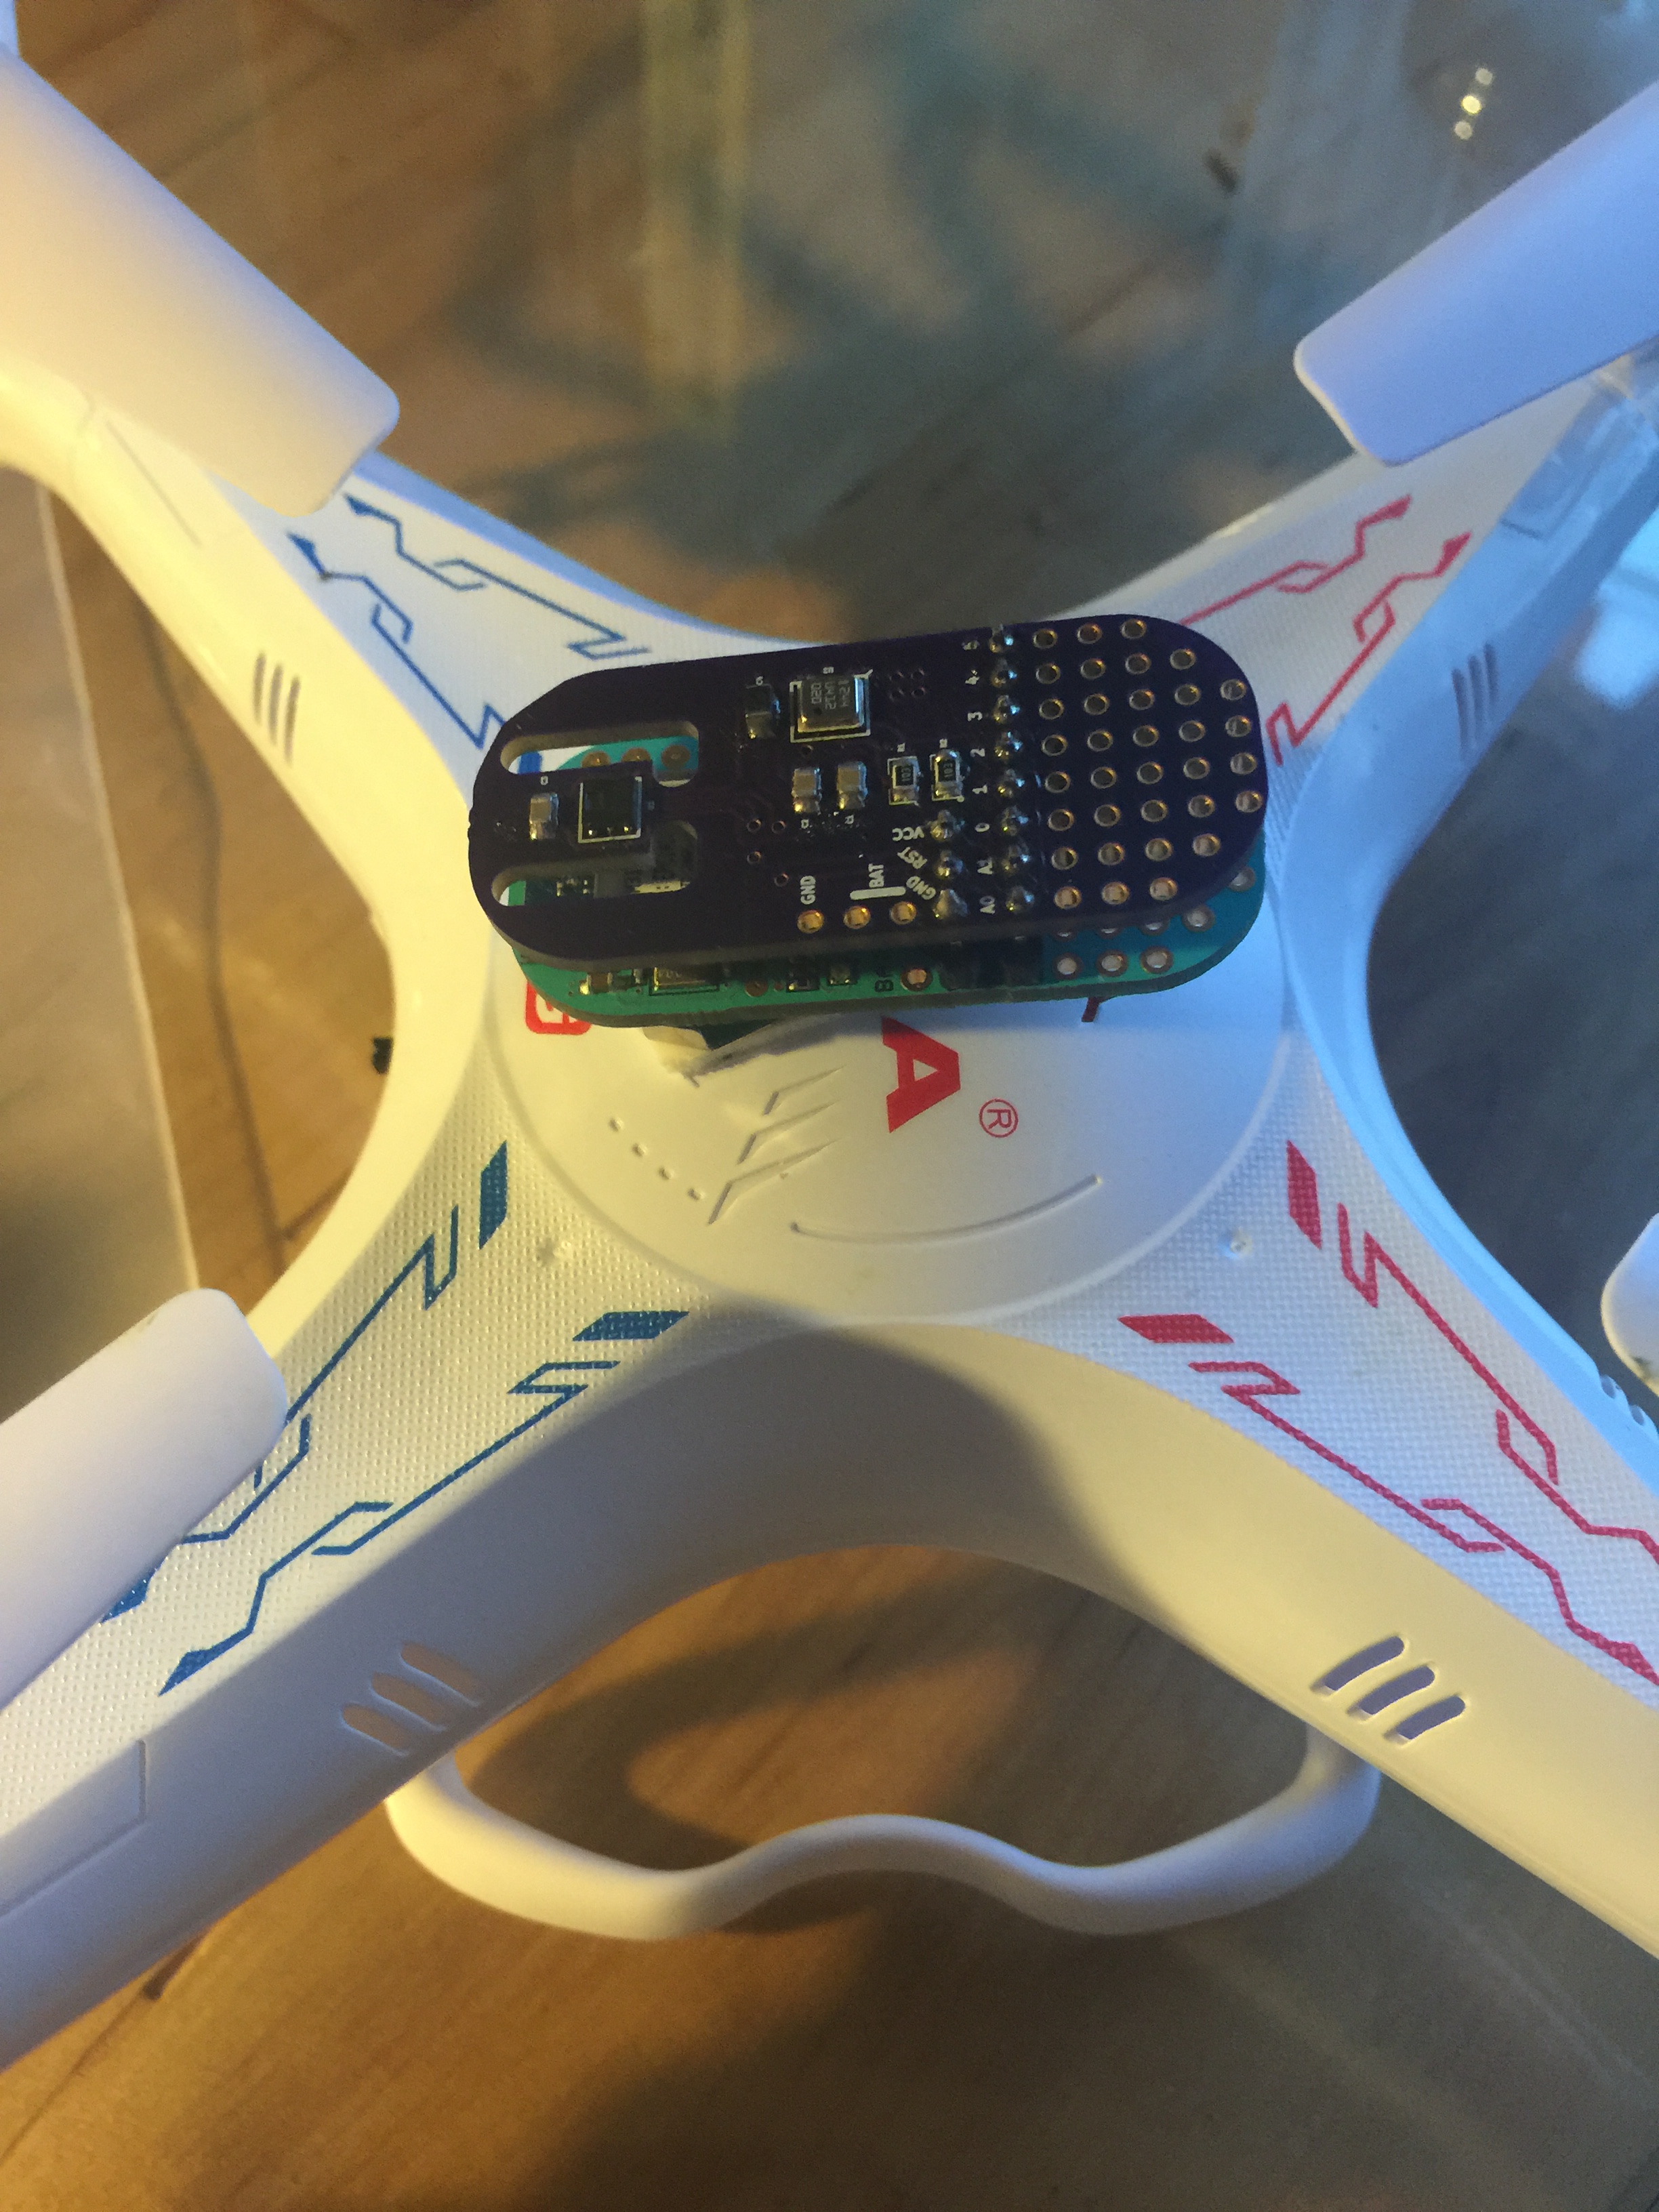
After playing we though it would be fun to do this on a drone with some more power. I grabbed a $55 drone (Syma X5C) on eBay and gave it a shot. After a couple of test flights I just couldn't get the bluetooth link to stay connected at the distances I wanted (50m).
My breakout and the bean attached to the top of the drone body.
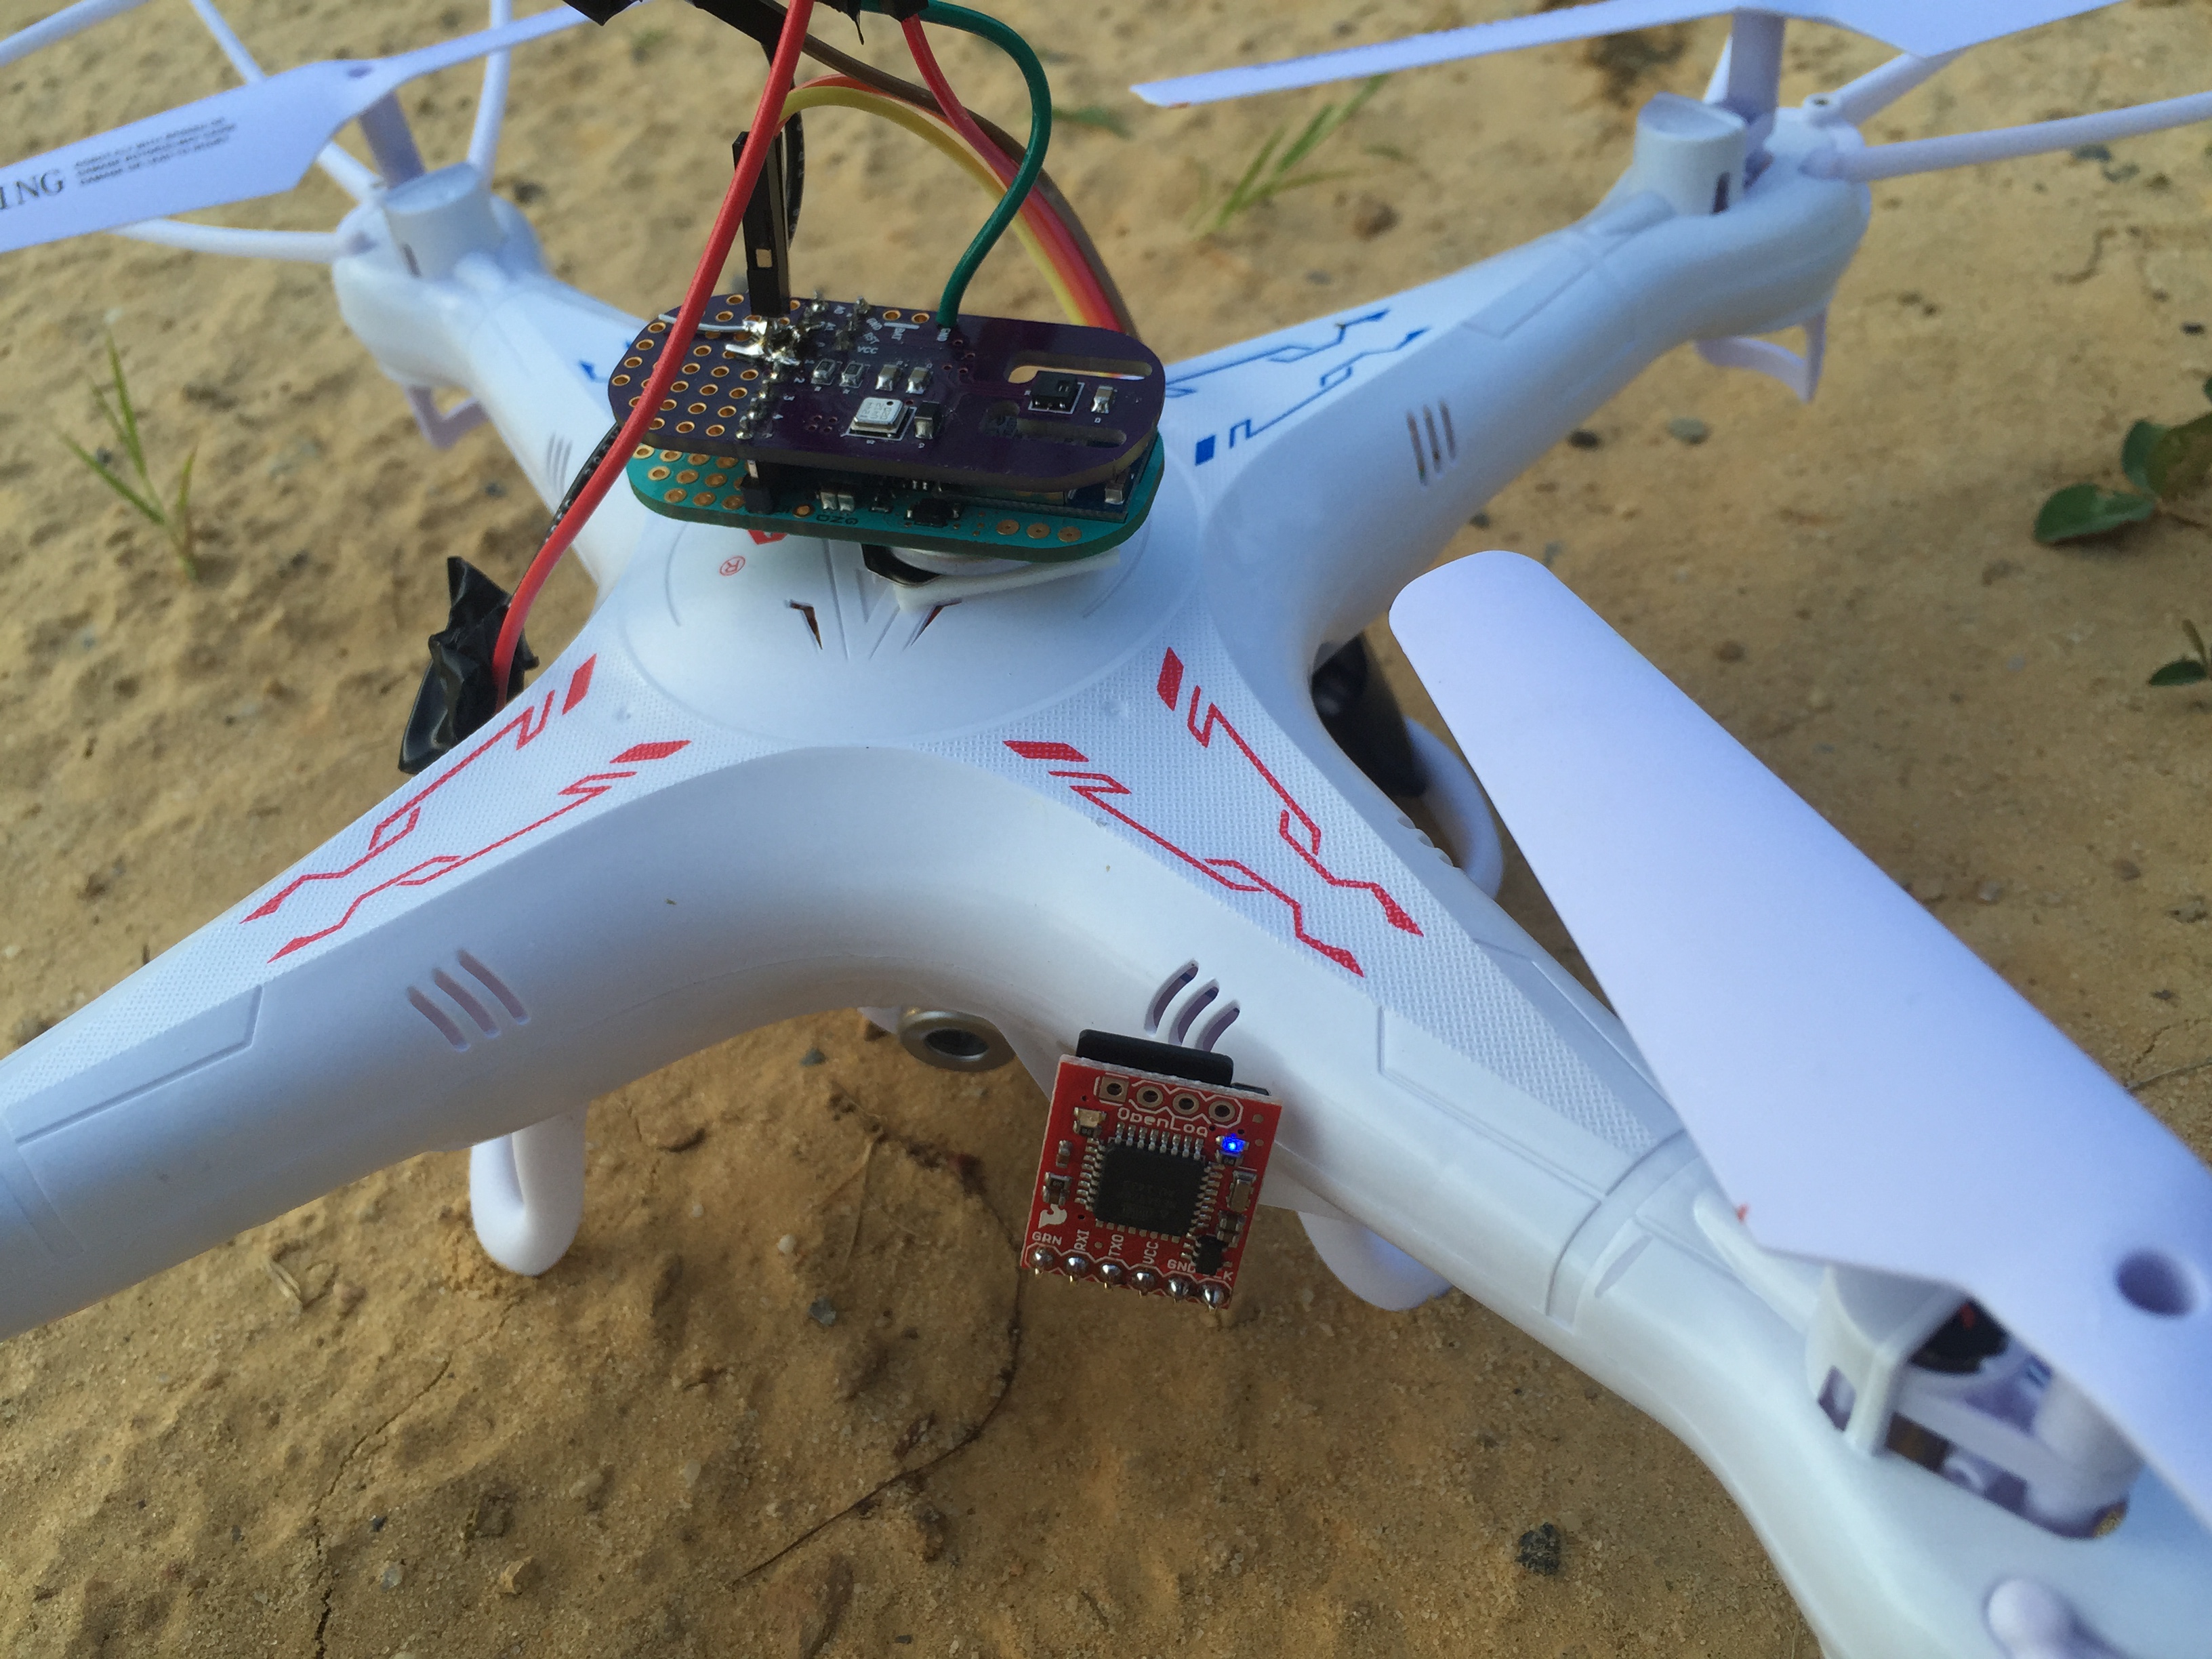
I added a kludge that wrote data to an SD card using the OpenLog. It was extra weight since I needed two more coin cell batteries, but the drone turned out to be able to carry it to 45 m once or twice. Then the drone looses signal and shakily falls out of the sky until I can get control again. While inspiring me to drool over more advanced drones, I did get some interesting data! Some of the plots are rather small in web-view, but click on them to expand. I just didn't want a bunch of individual figures making the post scroll forever.
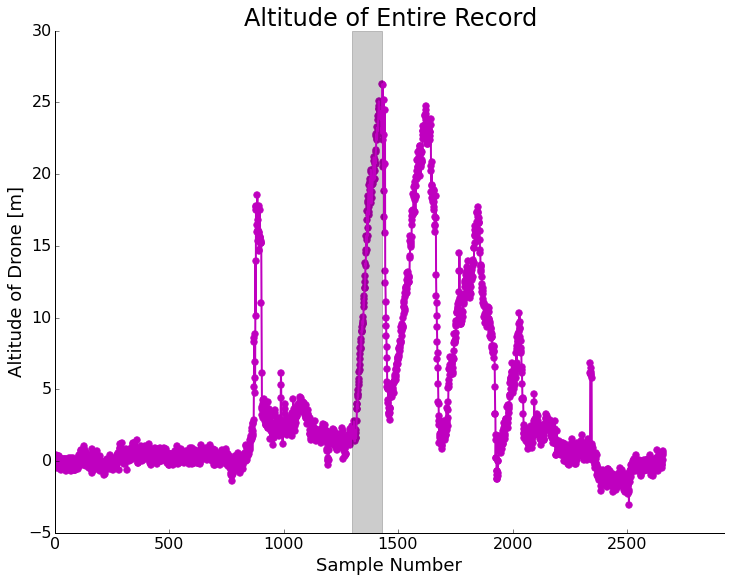
First I'll show my first SD logged flight(s). Below is the altitude plot (derived from the barometric pressure sensor on-board).
A few up/down flights of the drone. The ascent in the grey box will be examined in detail.
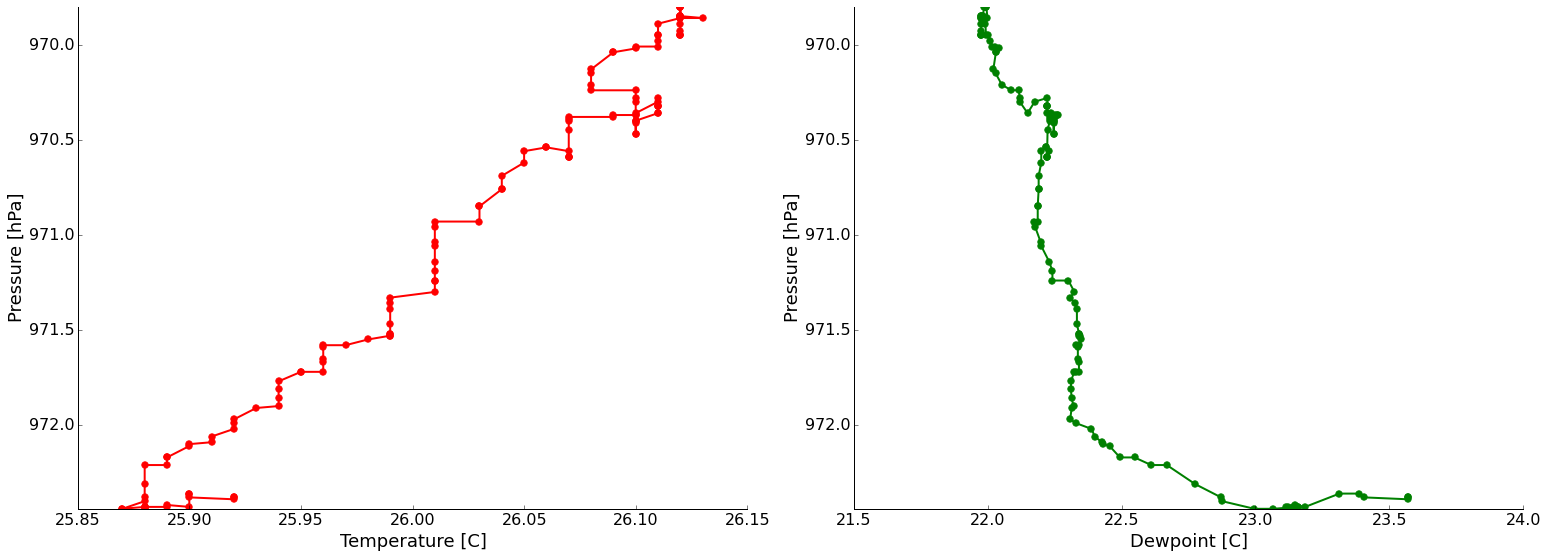
If we take the highest and most constant climb rate ascent (gray box) and look at the temperature/dewpoint data we see rather clean results!
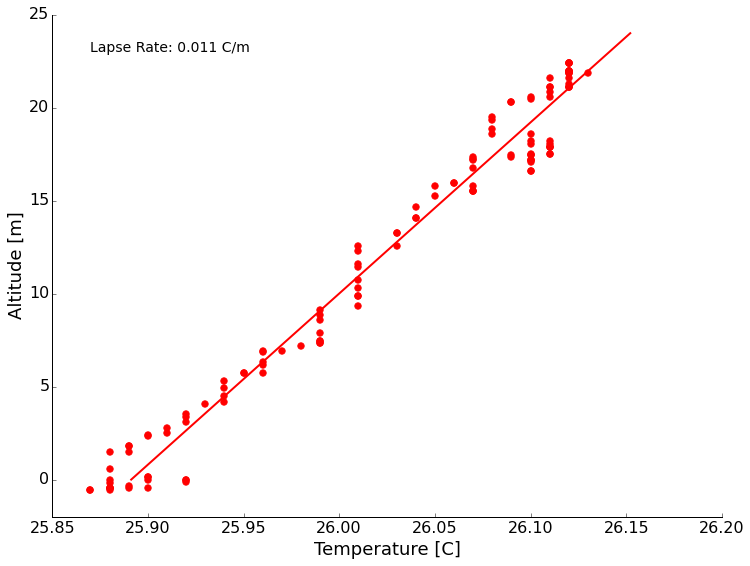
It was a dead still evening, just before sundown. Without any mechanical mixing, we see radiation from the ground producing a temperature inversion (temperature increases with height here). We also see a nice dew point trend to drier air as we ascend. For fun, I calculated the lapse rate. This just means how fast the temperature changes with height. Plotting the data and fitting a line we get about +11 degrees/kilometer of height. A reasonable number. (Perhaps coincidentally about the negative of the typical dry adiabatic lapse rate? It's been too long and I didn't ever do much near ground meteorology. Thoughts appreciated.)
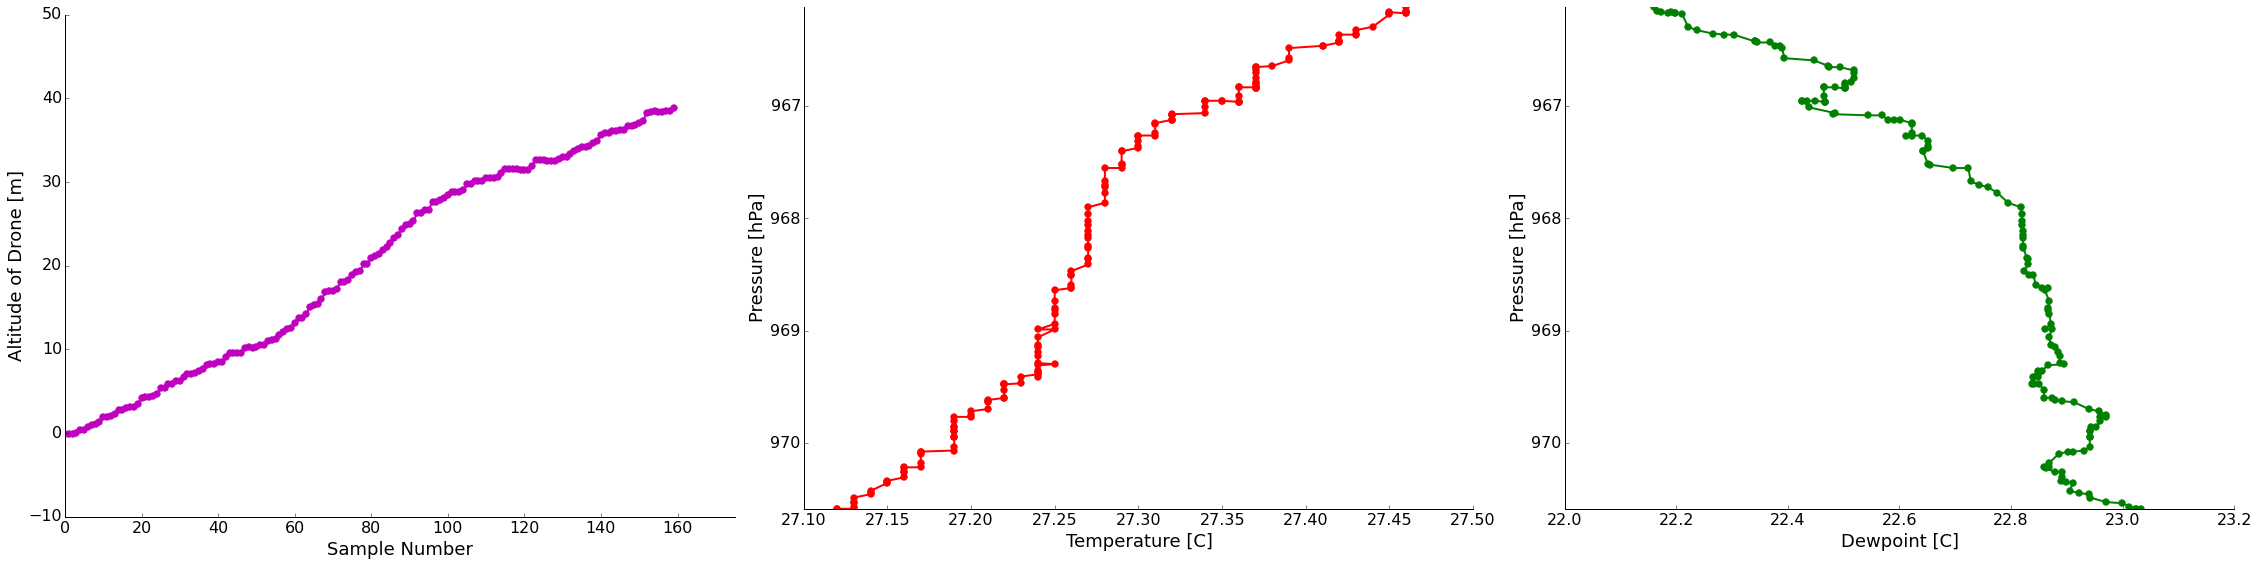
The next evening, a very similar setup without wind, I did another sounding that got up to 45 meters. On this flight I noticed that the bumps in the temperature and dew point trends match rather well with the bump in my ascent rate. Since this drone isn't programmable, I do this by hand which is tricky to judge. It probably has to do with the sensors needing a lot of settling time to equilibrate to their surroundings (a couple of seconds). Maybe flying small circles on the way up is a solution. I also have the video from this flight if you're curious what it looks like. Nothing too interesting, but the uncontrolled descents are rather exciting. I've read about hacking better antennas on this drone for more range, so that's a thought. Before I get it much further away I want to do it in a large field to decrease the risk from a runaway drone. If this proves to be interesting enough, maybe a drone update will be in order. They are pricey though!
It is finally summer and I see lots of people playing all sorts of outdoor sports. While I have never been a big sports player, it is fun to watch. There are a lot of physics involved in most sports, so maybe that is a line of posts worth investigating. I do have a post series on open source science planned that will last most of the summer, but maybe we can keep sports in mind next year?
This post is a resurrection of a post I started a couple of years ago and never got around to finishing. In an effort to tie up loose ends, here we go! How does a frisbee fly? I wondered this when we discovered that my fiancée can throw a frisbee upside down sometimes with results that flew surprisingly far. To understand what is happening we need to look at the fundamental physics of frisbee flight, make some measurements, then try to draw some conclusions. Turns out there is a lot of research on the aerodynamics of flying discs, so I'll hit the important points and leave links to let you dig down the wiki-hole with me if you wish. To start out, check out a copy of "Spinning Flight" by Ralph Lorenz at your library.
The physics of frisbee flight
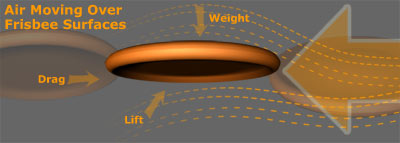
While in flight, our frisbee will experience several forces governing its movement including gravity, lift, drag, and a torque from its angular momentum. We will quickly look at each of these, but we are not going to fully model the system (though it could be fun!)
Forces on a frisbee. (Image: illumin.usc.edu)
First off, Gravity is the most obvious and intuitive of these forces. Everything is pulled towards the earth's center of mass by gravity at about 9.81m/s/s. If we just place the frisbee on the table, it will experience a force resulting from the acceleration of gravity. If we drop it, it will be accelerated downward. The velocity of falling objects has been fully investigated and we won't go into that too deeply. For now, simply assume that we could calculate the velocity of a dropped object or calculate the acceleration of an object if we know its fall rate.
Lift is what may be the most important force in this study. Believe it or not, a frisbee experiences lift following the same principles as a traditional wing or rotor blade. As the frisbee cuts through the air, some of the oncoming air goes over the frisbee, some goes under. The air streams have to meet up in the lee of the frisbee and since we cannot create or destroy air, we must have continuity and conservation. The air on top has to move faster for this to hold, it has longer to travel after all, and the air below can move more slowly. Thanks to Bernoulli's principle, we know that air moving faster will have a decreased pressure. This isn't anything new; in fact, Daniel Bernoulli published this idea in 1738! With fast air on top of the frisbee and slower air below, there is high pressure below and low pressure above the disk. From a difference in pressure we get the force of lift (more generally called a pressure gradient force).
Lift force from a pressure differential. (Image web.wellington.org)
Drag is the reason that our frisbee does not fly off into the distance. Drag is the force that slows the frisbee down as it pushes through the dense atmosphere. We could try to measure the drag through our later analysis, but that itself it a very deep task that we could spend a lot of time on.
Finally, comes the torque from the angular momentum of our frisbee. Have you tried to throw a frisbee without spinning it? In theory it would fly right? It's just a circular wing after all. Well, that turns out to be a pretty unstable way to fly your disc. Generally it will turn up, stall, and then fall like a rock. Why? Thanks to some spatial change in the lift force, the front of the disc will be lifted with slightly more force than the back, causing the disc to torque over to the back. In fact, I'll save you the trouble, you can watch my feeble attempts below. We could try to outfit our frisbee with control surfaces to help it maintain the proper angle of attack, but that is heavy, complicated, and would mean dead batteries would plague playing kids and dogs. Surely there is a more simple way?
Of course! Let's spin the frisbee when we throw it! When we throw the disc and it spins, we get gyroscopic stability and the possibility to see the cool spinning designs we print on the toy. We can determine that this torque will point vertically through the top of the frisbee. If you remember the right hand rule, you'll see that for my right-handed clockwise throw, the torque vector will point towards the ground. For the south-paws out there, your torque vector will point towards the sky. The important thing is that it will try to counteract the tendency of the lift moment to make the frisbee backflip. Granted, it will not win forever. Eventually the flight will become unstable, but we can maintain steady flight for several seconds. Depending on the force balance, we'll also expect to see the frisbee's vertical axis precess around true "up".
Taking measurements
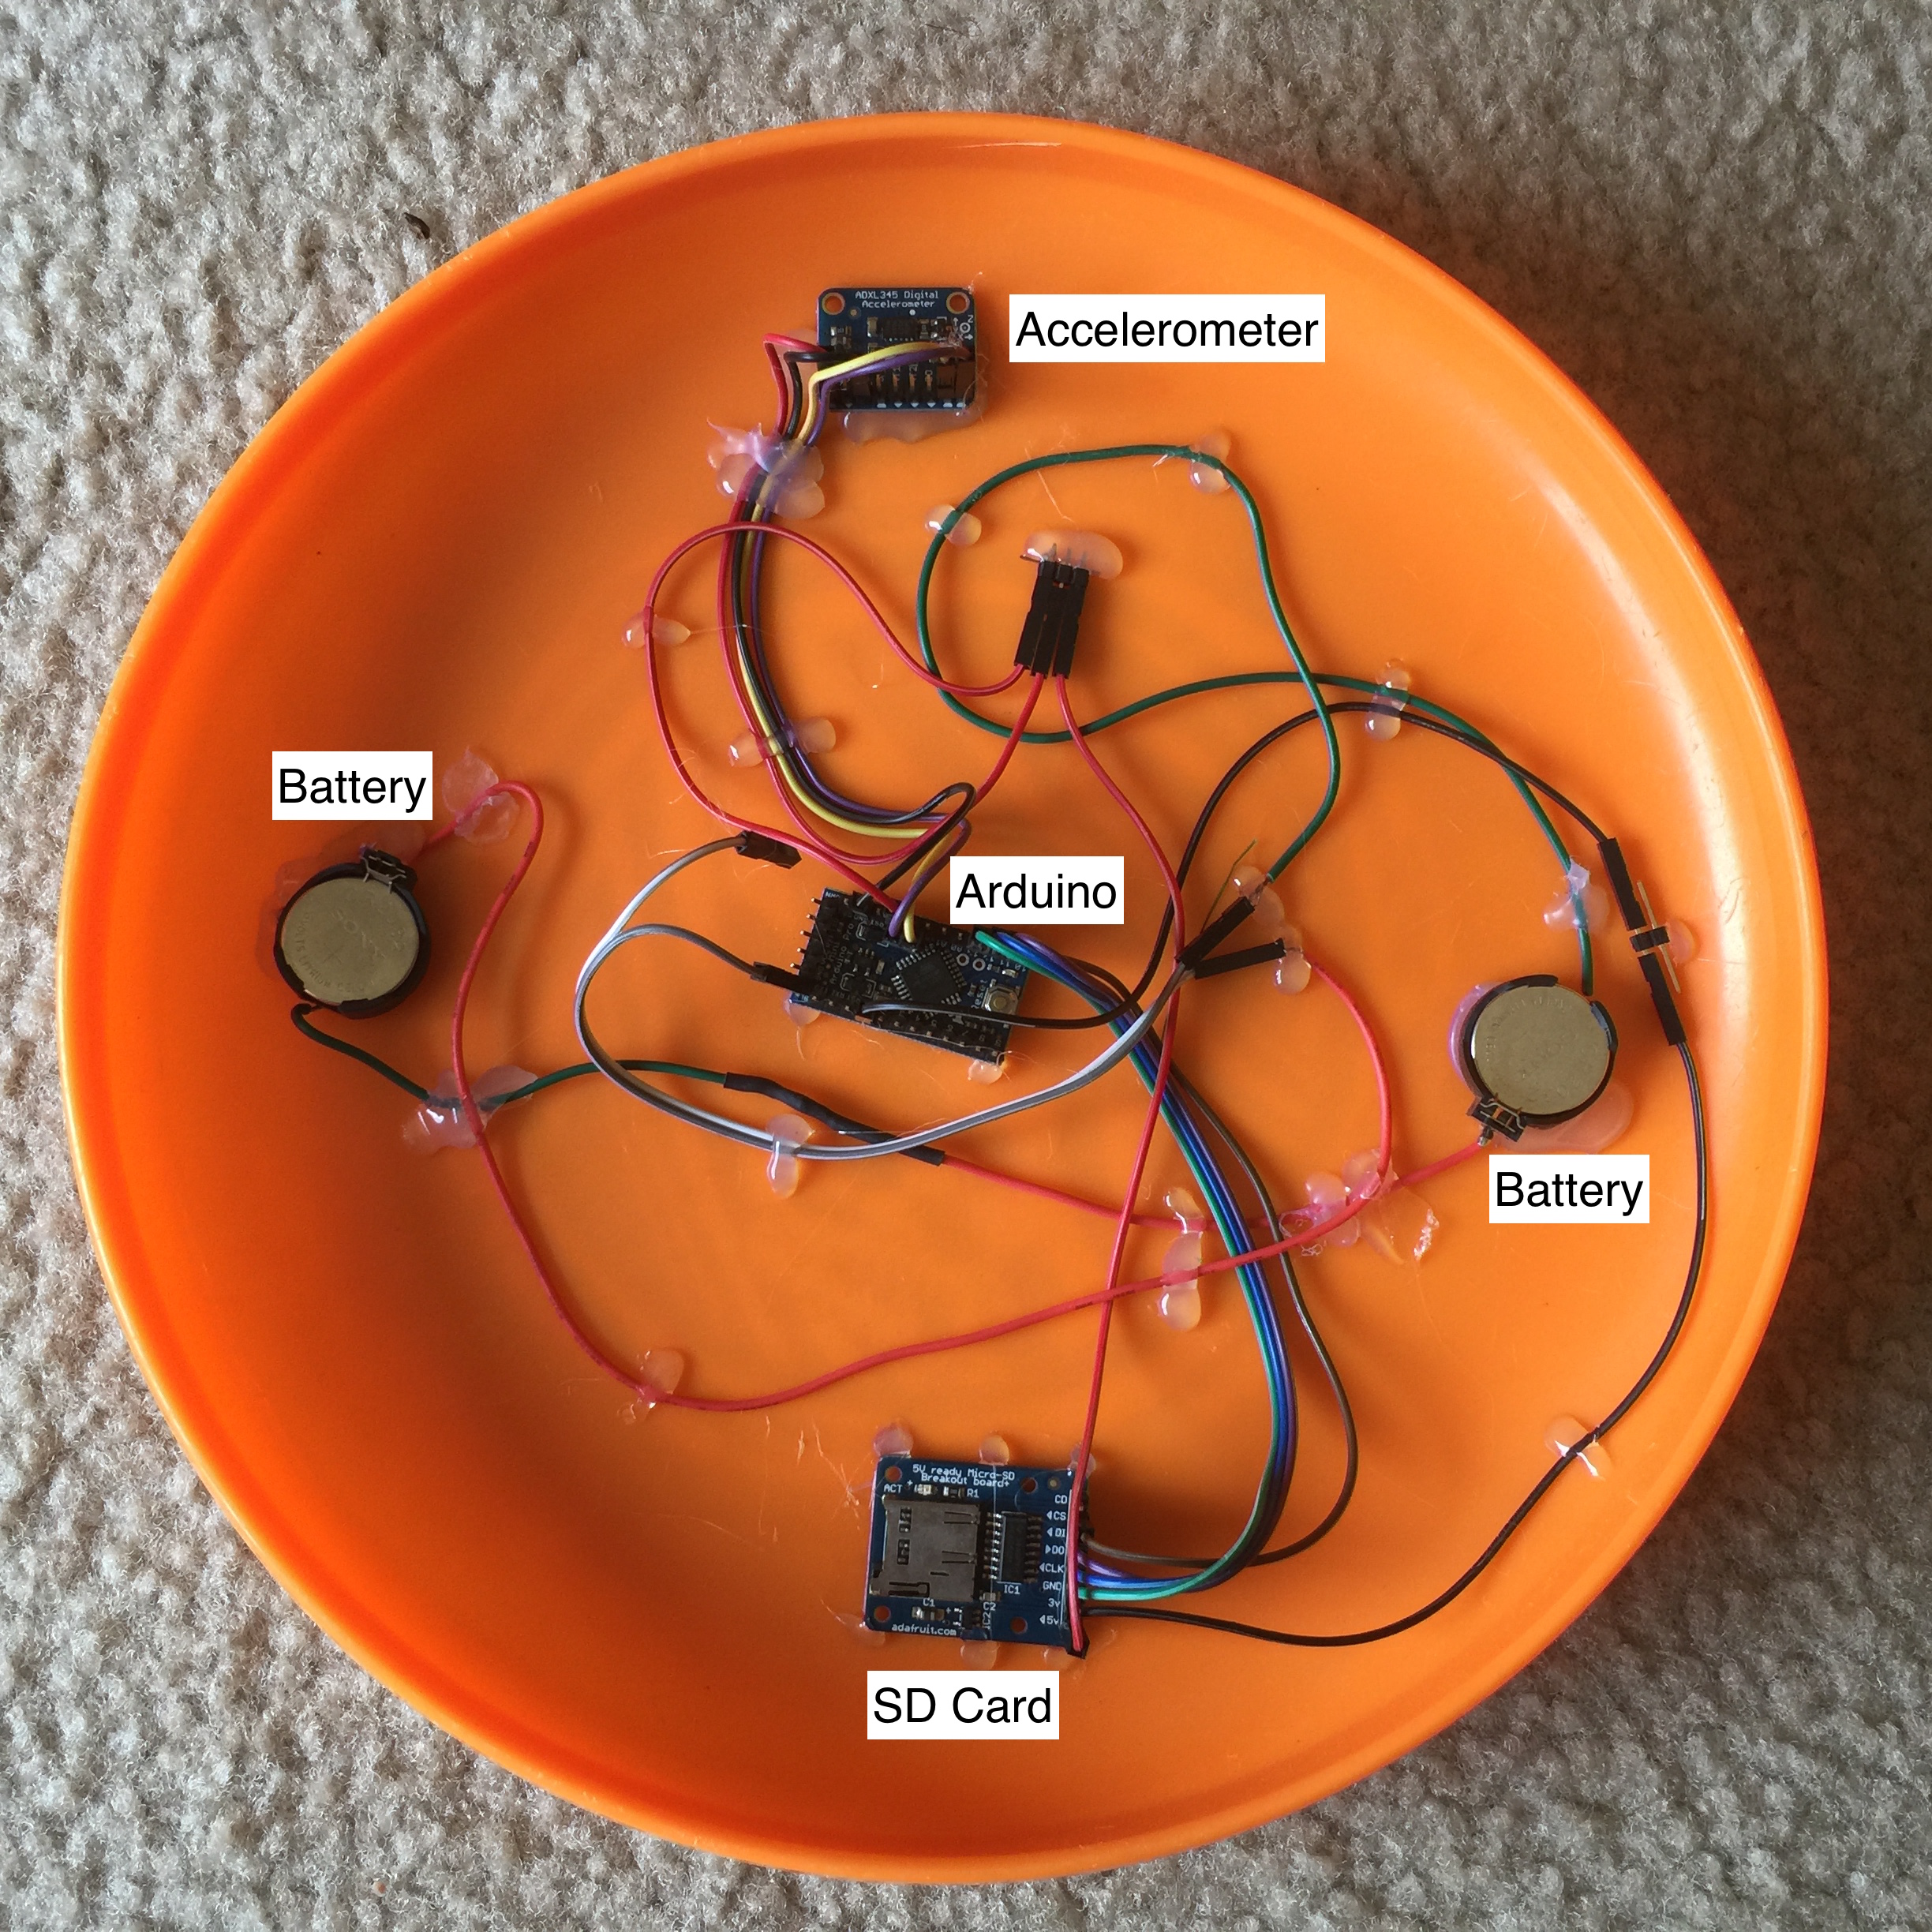
To take some measurements of frisbee flight, I created an instrumented frisbee. Turns out, I'm not the first one to do this. Lorenz made an instrumented frisbee in the early 2000's and then improved it by adding a plethorera of sensors. I decided that a simple accelerometer would be enough for my investigation. While adding angle sensors and such would be interesting, let's keep it simple for a first pass. Maybe adding a 9 degree of freedom inertial measurement unit would be fun, but that's an idea for another time. Actually, the gyroscope data from that would be incredibly useful.
I used an Arduino Pro Mini for my micro controller, an accelerometer, and SD card logger for the sensor and logging system. I ended up just trying to read the sensor in single shot mode as fast as possible. This gave a data rate of around 180-200 Hz with time-stamps in microseconds on each packet. Sure, we could make this part a little more slick, but again, the KISS principle rules for these first hacks at a problem . Power comes from a pair of CR2032 coin cell batteries. All of this was hot glued down and hopefully made as aerodynamic as possible without coweling the whole assembly. Should we wish to improve this, I would directly solder the wires to the boards instead of using header connectors and cover everything in kapton tape.
If you are interested in trying this yourself, the Arduino sketch is at the bottom of this post.
To approximate the speed of the frisbee I will have some video of the flights that we can look at to get some rough numbers to work with. These were just filmed with a DSLR camera, so this is something you can try at home! The newer iPhones are actually even faster than this camera, but I didn't have a tripod mount handy for my 6+ when I filmed this.
Data analysis
First, let's look at the film of a flight to figure out how fast the frisbee throw is on average. We could look at how long the flight was and how far is was and get an average velocity with v=d/t. That's great, but we can do one better! Through the magic of image tracking, we can get the position of the frisbee in each frame of the video and calculate the velocity profile during the flight. While probably not totally necessary, why not?
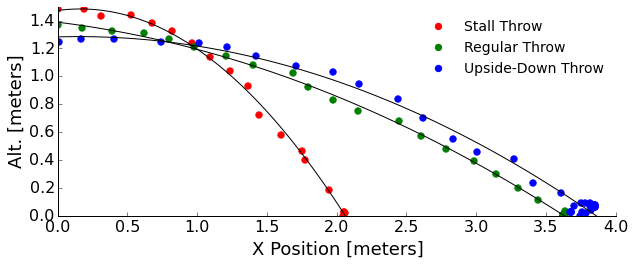
I'll use the Tracker video analysis software for this. We read in the video, setup some coordinate systems, markers, etc, and let it churn. If the frisbee veers in the third dimension (into or out of the screen) we won't get that information because we are just tracking its center in a 2D picture. Hence, I'll try to keep the throws gentle! We'll look at the stall, upside-down, and normal throws:
To keep this short, I'll tell you that the forward speed of these throws looks to top out at about 5 m/s. Again, we could go down the hole of getting drag from the slight deceleration in forward speed with time, but it really doesn't slow us much... the ground beats drag to stopping our frisbee.
We can see that the stall throw drops very quickly without really flying. In fact, it mostly is flipping end-over-end. The regular and upside-down throws look like they have a similar flight profile from the video. This means I must have not been as consistent as I had hoped with my throwing strength. We know that without the lift component that the upside-down throw should follow a more parabolic path than the regular throw. Also, my regular throw was pretty weak to keep the frisbee in the frame and minimally veering, so it didn't have enough lift to show us long periods of stable flight.
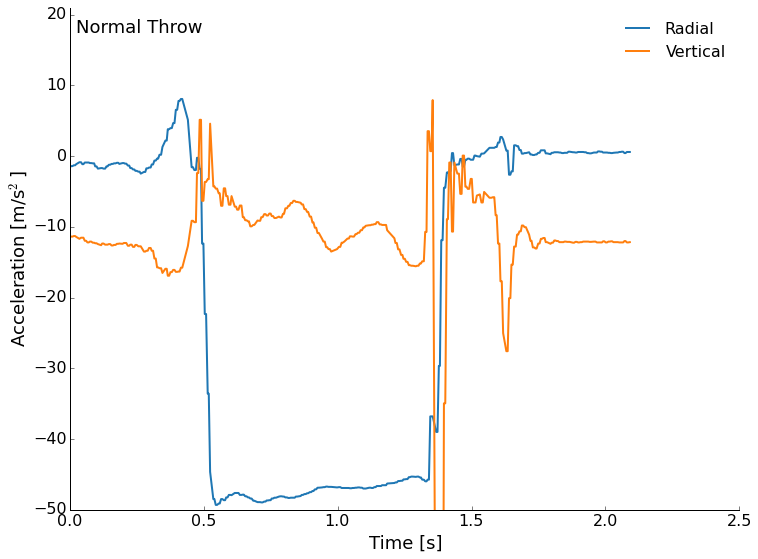
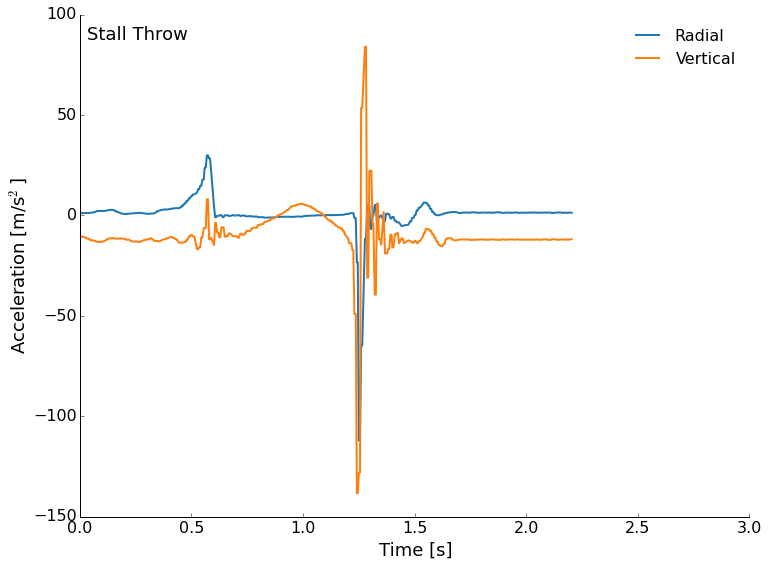
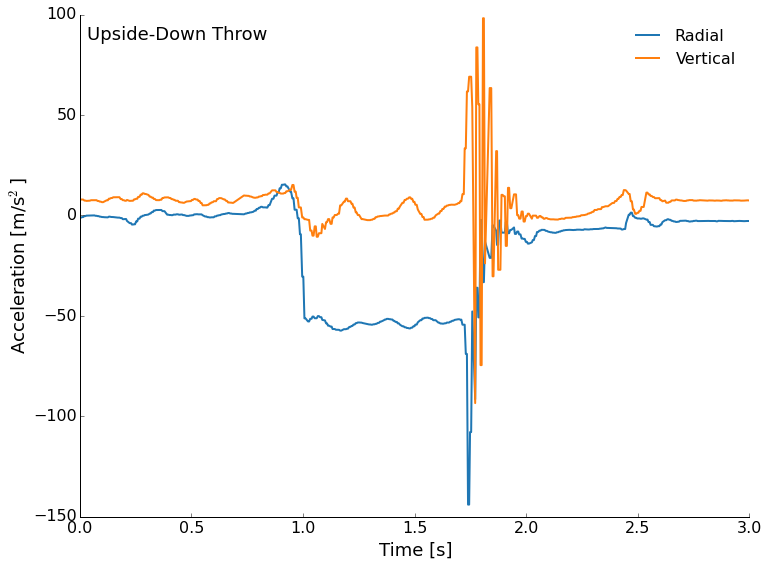
Next, let's look at the accelerometer data. The data is stored in a text file with the millisecond time stamp, and then each of the three axes acceleration measurements. I've plotted the radial (outward from the center) and vertical accelerations. Since the accelerometer was mounted near the rim of the frisbee, we will see relatively large signals from the wobble in flight.
We'll start with the normal throw this time. The accelerometer is roughly calibrated at the factory, but don't worry about the absolute values too much here. We see me pull back to throw as a upturn in the radial, then a large negative (outward) acceleration from the spinning of the disc during flight. Roughly a couple of g's here. The vertical is interesting through. We see the roughly -10m/s/s from the Earth's gravity as a prepare to throw and after the landing, but during flight we see a near zero vertical acceleration that trends downward. What is it? Lift! This is the flight of the frisbee that is gradually reduced as drag slows us and the angle of attack becomes non-ideal. We are expecting that we don't totally counteract gravity because flight is not sustained and our frisbee does not go on forever. This was a pretty gentle and short flight, but followed our expectations in terms of the forces at work. We can even see some precession in the vertical in the neighborhood of about 4 times/second.
Next, we'll look at the stall throw. This isn't spinning so we don't expect to see a lot of radial acceleration once the throw leaves our hands, but we do expect to see some lift for a short period of time, then a stall and fall. That is what we get, too! The spike in the blue curve at 0.5 seconds is my push to accelerate the frisbee, then there are few other radial accelerations recorded (except the impact). There should be some small accelerations from the flip of the disc, but they are tiny here. The vertical trend up and down just before 1 second is the frisbee flipping over once. The only real lift is just a tiny fraction of a second before the front is lifted up. After that, we are really just in free-fall.
Finally, the elusive upside-down throw. The frisbee starts out upside-down, so the acceleration of gravity now shows as positive (look after the landing for example). We still see radial acceleration from the spinning and we also see a reduction in the vertical acceleration. This can't be lift, but is probably some axis mis-alignment on the sensor. We still see precession as the torque tries to keep the disc horizontal.
What did we learn?
We learned about all of the forces at play in the flight of a frisbee, lift, drag, etc. We measured some flight paths and acceleration profiles. These were not quite as clear cut as I had hoped though. We still saw that flying right side up works pretty well, but upside down "flight" is basically spin-stabilized falling with a lot of forward momentum. Throwing with no spin quickly results in a pitch-up and stall.
We'll see what happens with this. If people are interested we could think about adding an IMU to the setup with better positioning and balance. We could also just put a light on a frisbee and track it with a time-lapse photo. This turned out to be a fascinating look at flight, acceleration measurement, and video tracking! If you are wondering about numerical modeling, there is a really nice report from MIT that develops a good model.
#include <SPI.h>
#include <SD.h>
#include <Wire.h>
#include <Adafruit_Sensor.h>
#include <Adafruit_ADXL345_U.h>

/* Assign a unique ID to this sensor at the same time */
Adafruit_ADXL345_Unified accel = Adafruit_ADXL345_Unified(12345);

const int chipSelect = 4;

File dataFile;

void displaySensorDetails(void)
{
sensor_t sensor;
accel.getSensor(&sensor);
Serial.println("------------------------------------");
Serial.print ("Sensor: "); Serial.println(sensor.name);
Serial.print ("Driver Ver: "); Serial.println(sensor.version);
Serial.print ("Unique ID: "); Serial.println(sensor.sensor_id);
Serial.print ("Max Value: "); Serial.print(sensor.max_value); Serial.println(" m/s^2");
Serial.print ("Min Value: "); Serial.print(sensor.min_value); Serial.println(" m/s^2");
Serial.print ("Resolution: "); Serial.print(sensor.resolution); Serial.println(" m/s^2");
Serial.println("------------------------------------");
Serial.println("");
delay(500);
}

void displayDataRate(void)
{
Serial.print ("Data Rate: ");

switch(accel.getDataRate())
{
case ADXL345_DATARATE_3200_HZ:
Serial.print ("3200 ");
break;
case ADXL345_DATARATE_1600_HZ:
Serial.print ("1600 ");
break;
case ADXL345_DATARATE_800_HZ:
Serial.print ("800 ");
break;
case ADXL345_DATARATE_400_HZ:
Serial.print ("400 ");
break;
case ADXL345_DATARATE_200_HZ:
Serial.print ("200 ");
break;
case ADXL345_DATARATE_100_HZ:
Serial.print ("100 ");
break;
case ADXL345_DATARATE_50_HZ:
Serial.print ("50 ");
break;
case ADXL345_DATARATE_25_HZ:
Serial.print ("25 ");
break;
case ADXL345_DATARATE_12_5_HZ:
Serial.print ("12.5 ");
break;
case ADXL345_DATARATE_6_25HZ:
Serial.print ("6.25 ");
break;
case ADXL345_DATARATE_3_13_HZ:
Serial.print ("3.13 ");
break;
case ADXL345_DATARATE_1_56_HZ:
Serial.print ("1.56 ");
break;
case ADXL345_DATARATE_0_78_HZ:
Serial.print ("0.78 ");
break;
case ADXL345_DATARATE_0_39_HZ:
Serial.print ("0.39 ");
break;
case ADXL345_DATARATE_0_20_HZ:
Serial.print ("0.20 ");
break;
case ADXL345_DATARATE_0_10_HZ:
Serial.print ("0.10 ");
break;
default:
Serial.print ("???? ");
break;
}
Serial.println(" Hz");
}

void setup(void)
{
Serial.begin(9600);
Serial.println("Accelerometer Test"); Serial.println("");

/* Initialise the sensor */
if(!accel.begin())
{
/* There was a problem detecting the ADXL345 ... check your connections */
Serial.println("Ooops, no ADXL345 detected ... Check your wiring!");
while(1);
}

/* Set the range to whatever is appropriate for your project */
accel.setRange(ADXL345_RANGE_16_G);
// displaySetRange(ADXL345_RANGE_8_G);
//accel.setRange(ADXL345_RANGE_4_G);
// displaySetRange(ADXL345_RANGE_2_G);

/* Display some basic information on this sensor */
displaySensorDetails();

/* Display additional settings (outside the scope of sensor_t) */
displayDataRate();
//displayRange();
Serial.println("");
Serial.print("Initializing SD card...");
// make sure that the default chip select pin is set to
// output, even if you don't use it:
pinMode(SS, OUTPUT);

// see if the card is present and can be initialized:
if (!SD.begin(chipSelect)) {
Serial.println("Card failed, or not present");
// don't do anything more:
while (1) ;
}
Serial.println("card initialized.");

char filename[15];
strcpy(filename, "ACCLOG00.TXT");
for (uint8_t i = 0; i < 100; i++) {
filename[6] = '0' + i/10;
filename[7] = '0' + i%10;
// create if does not exist, do not open existing, write, sync after write
if (! SD.exists(filename)) {
break;
}
}

dataFile = SD.open(filename, FILE_WRITE);
if( ! dataFile ) {
Serial.print("Couldnt create ");
Serial.println(filename);
while(1);
}
Serial.print("Writing to ");
Serial.println(filename);
}

void loop(void)
{
/* Get a new sensor event */
for(int i=0; i < 100; i++){
sensors_event_t event;
accel.getEvent(&event);
dataFile.print(millis());
dataFile.print(",");
//log_float(event.acceleration.x,999,8,5);
dataFile.print(event.acceleration.x,5);
dataFile.print(",");
//log_float(event.acceleration.x,999,8,5);
dataFile.print(event.acceleration.y,5);
dataFile.print(",");
//log_float(event.acceleration.x,999,8,5);
dataFile.print(event.acceleration.z,5);
dataFile.println("");
}
dataFile.flush();
}