Category Archives: Disaster

Nepal Earthquake Ground Motion Around the World

The recent earthquake in Nepal is truly a tragic event. Currently it has claimed over 5000 lives and the more remote regions will not be reached for days to weeks. It is really very hard to comprehend the intensity of ground motion for such an event. If you want to know more technical details about the event, I encourage you to look at the official USGS event page and Chuck Ammon's blog post. We also will talk about earthquake details on the "Don't Panic Geocast" tomorrow (Friday).

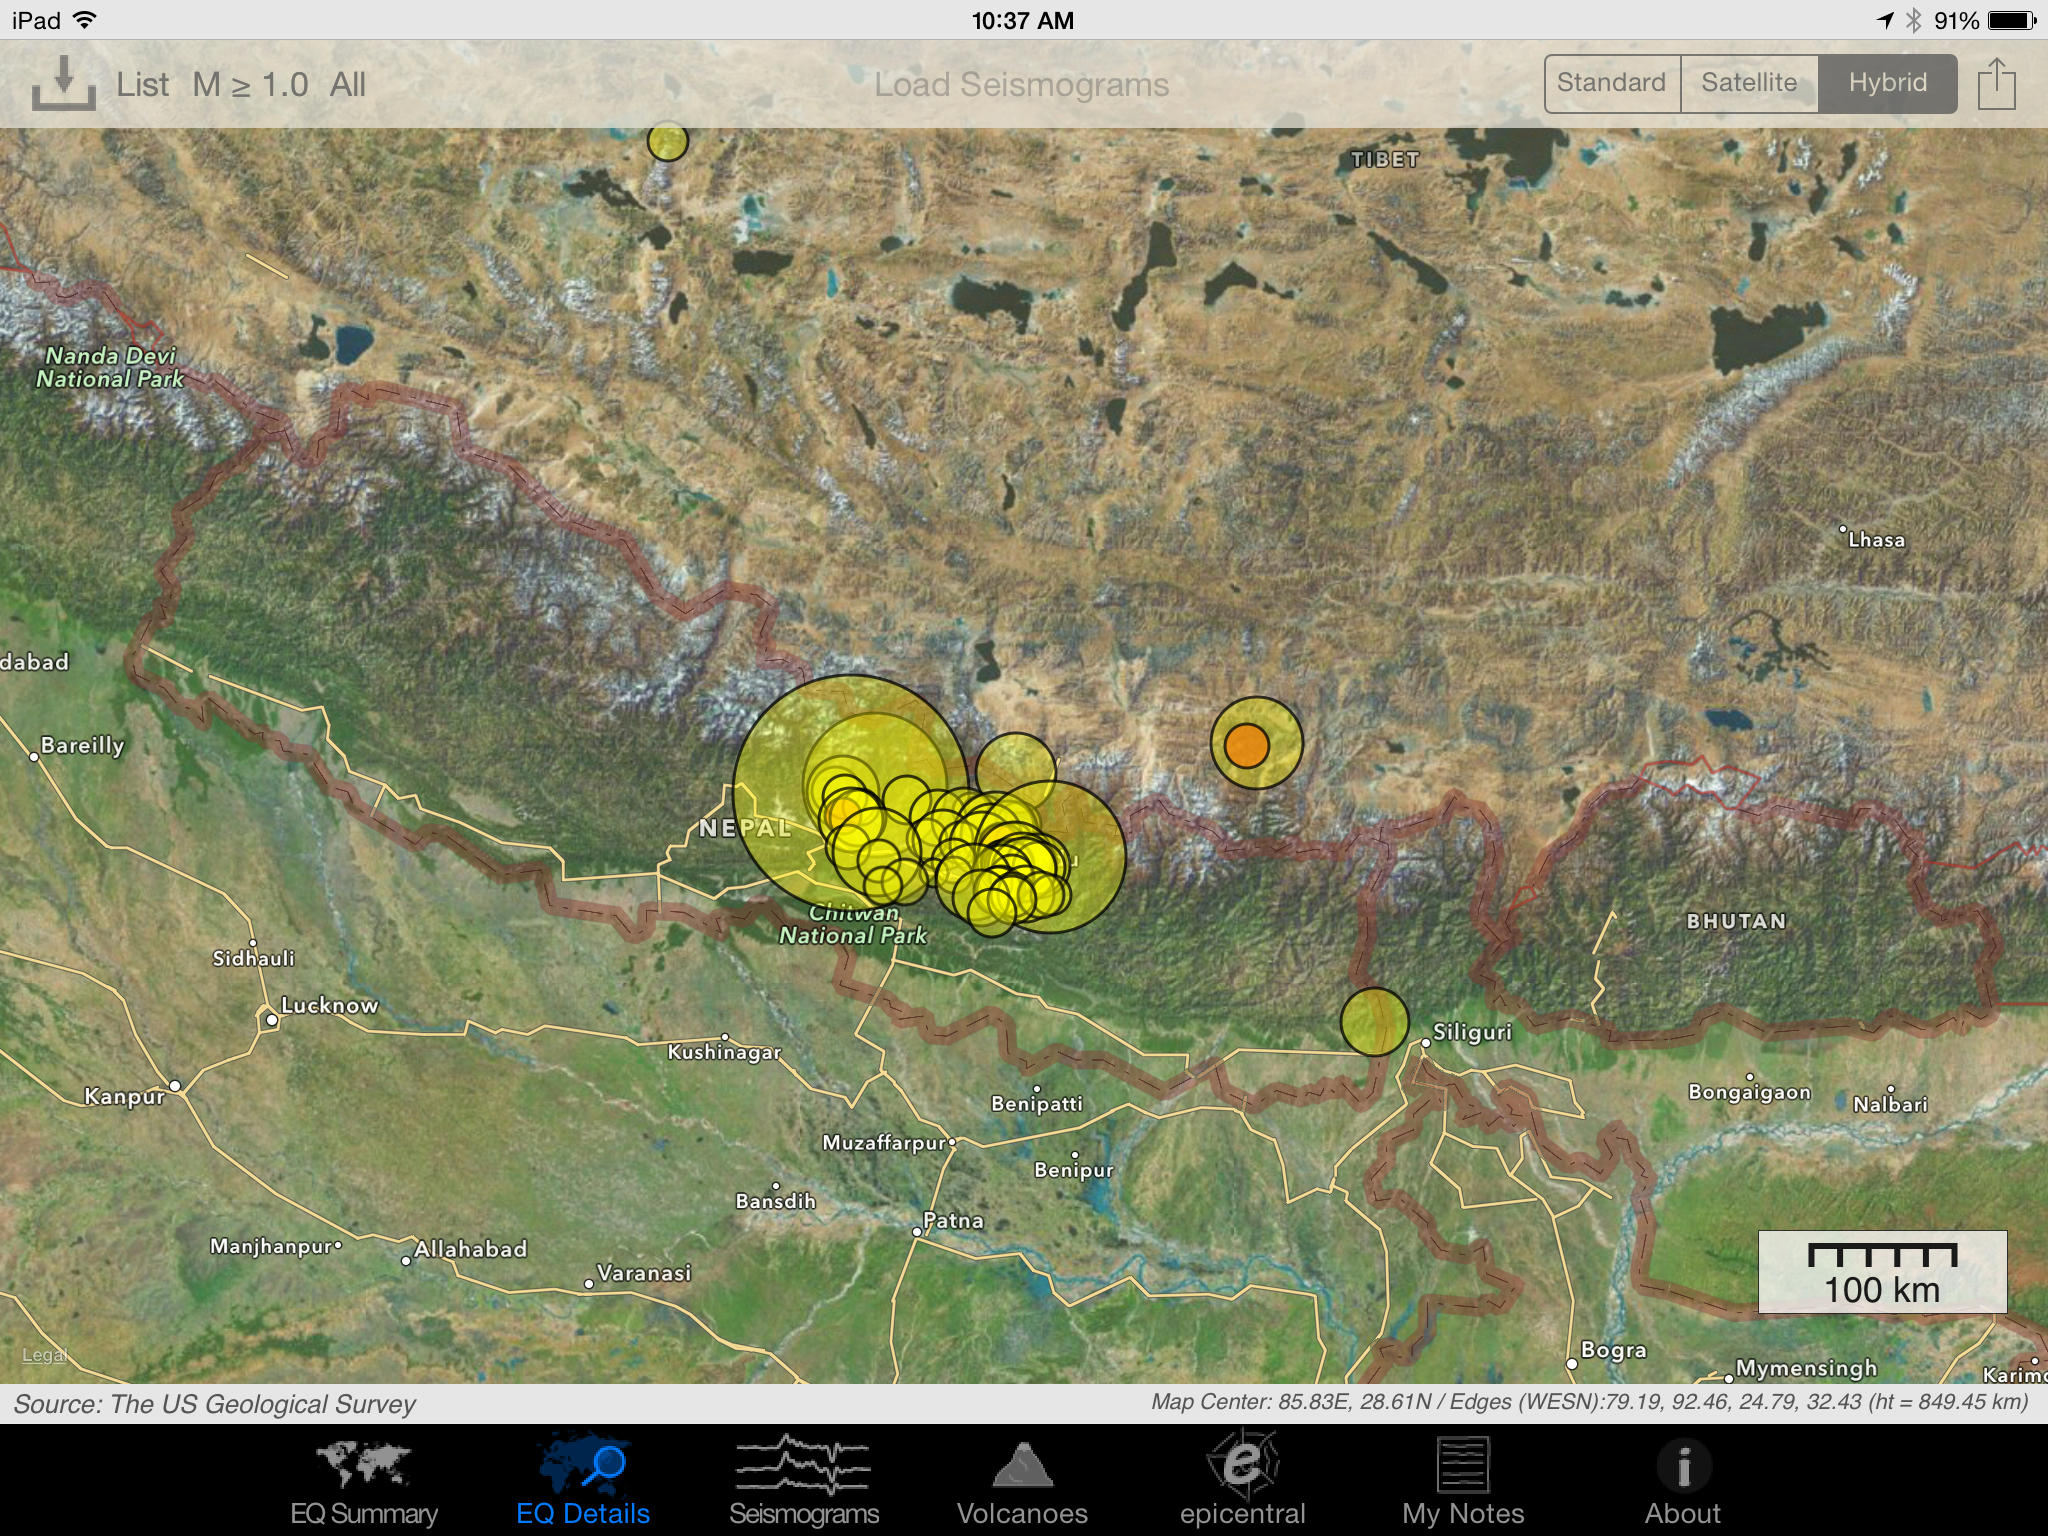
For now I wanted to share some animations of the ground motion associated with the event. I tweeted some of these earlier in the week and got a great response, so I wanted to collect them all in one place with some maps. First off a quick map of the main shock and many aftershocks (circle area goes with the magnitude, color the age).

2015-04-30 10.37.19

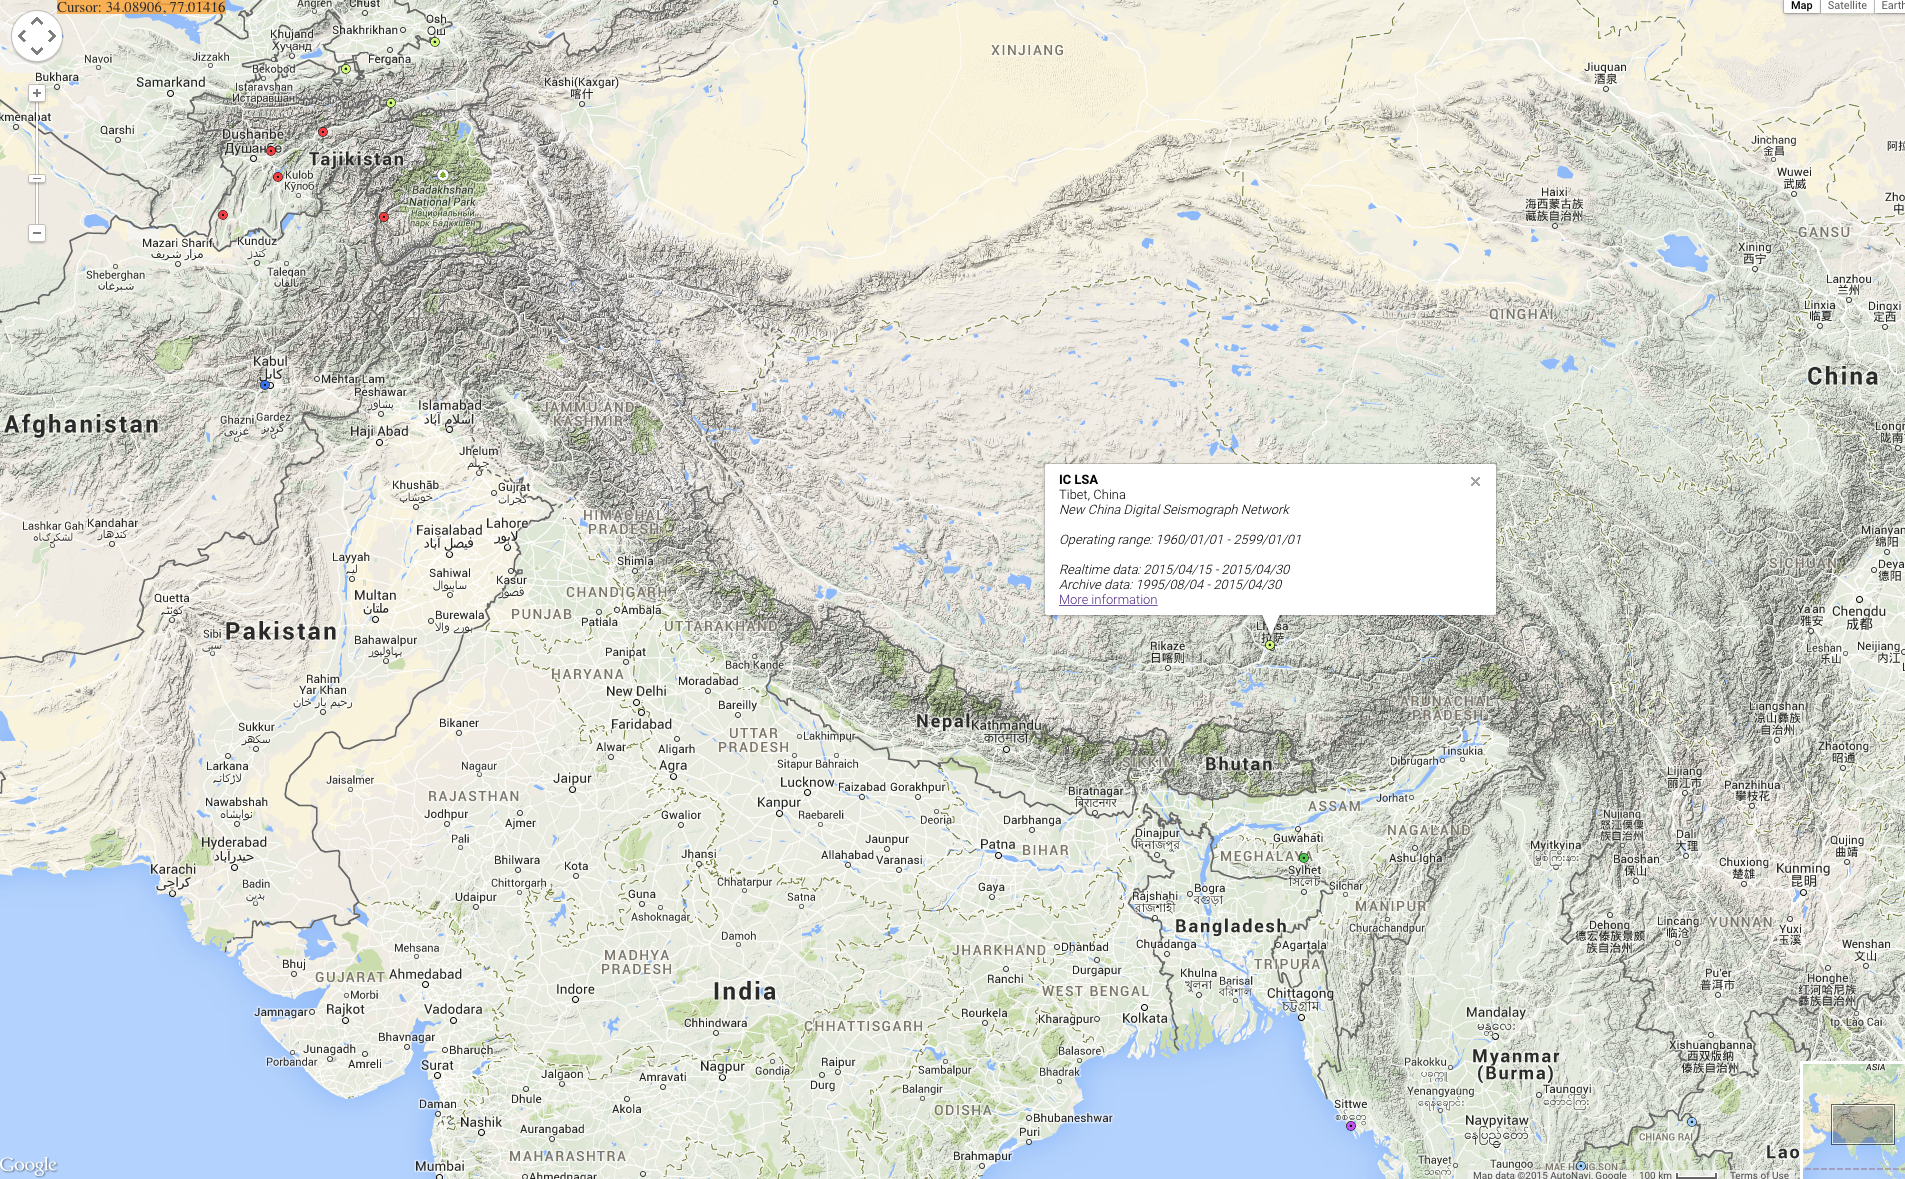
Let's start with a ground motion visualization from a station in Tibet, China. This station "clipped". This means the instrument hit the limits of the motion it could measure. This particular station is about 650 km (400 miles) from the earthquake. There is another instrument that measures strong motion closer to the earthquake, but the data had some holes that made animation very difficult. (I guess that's another feature to add to the program!)

Screen Shot 2015-04-30 at 10.40.56 AM

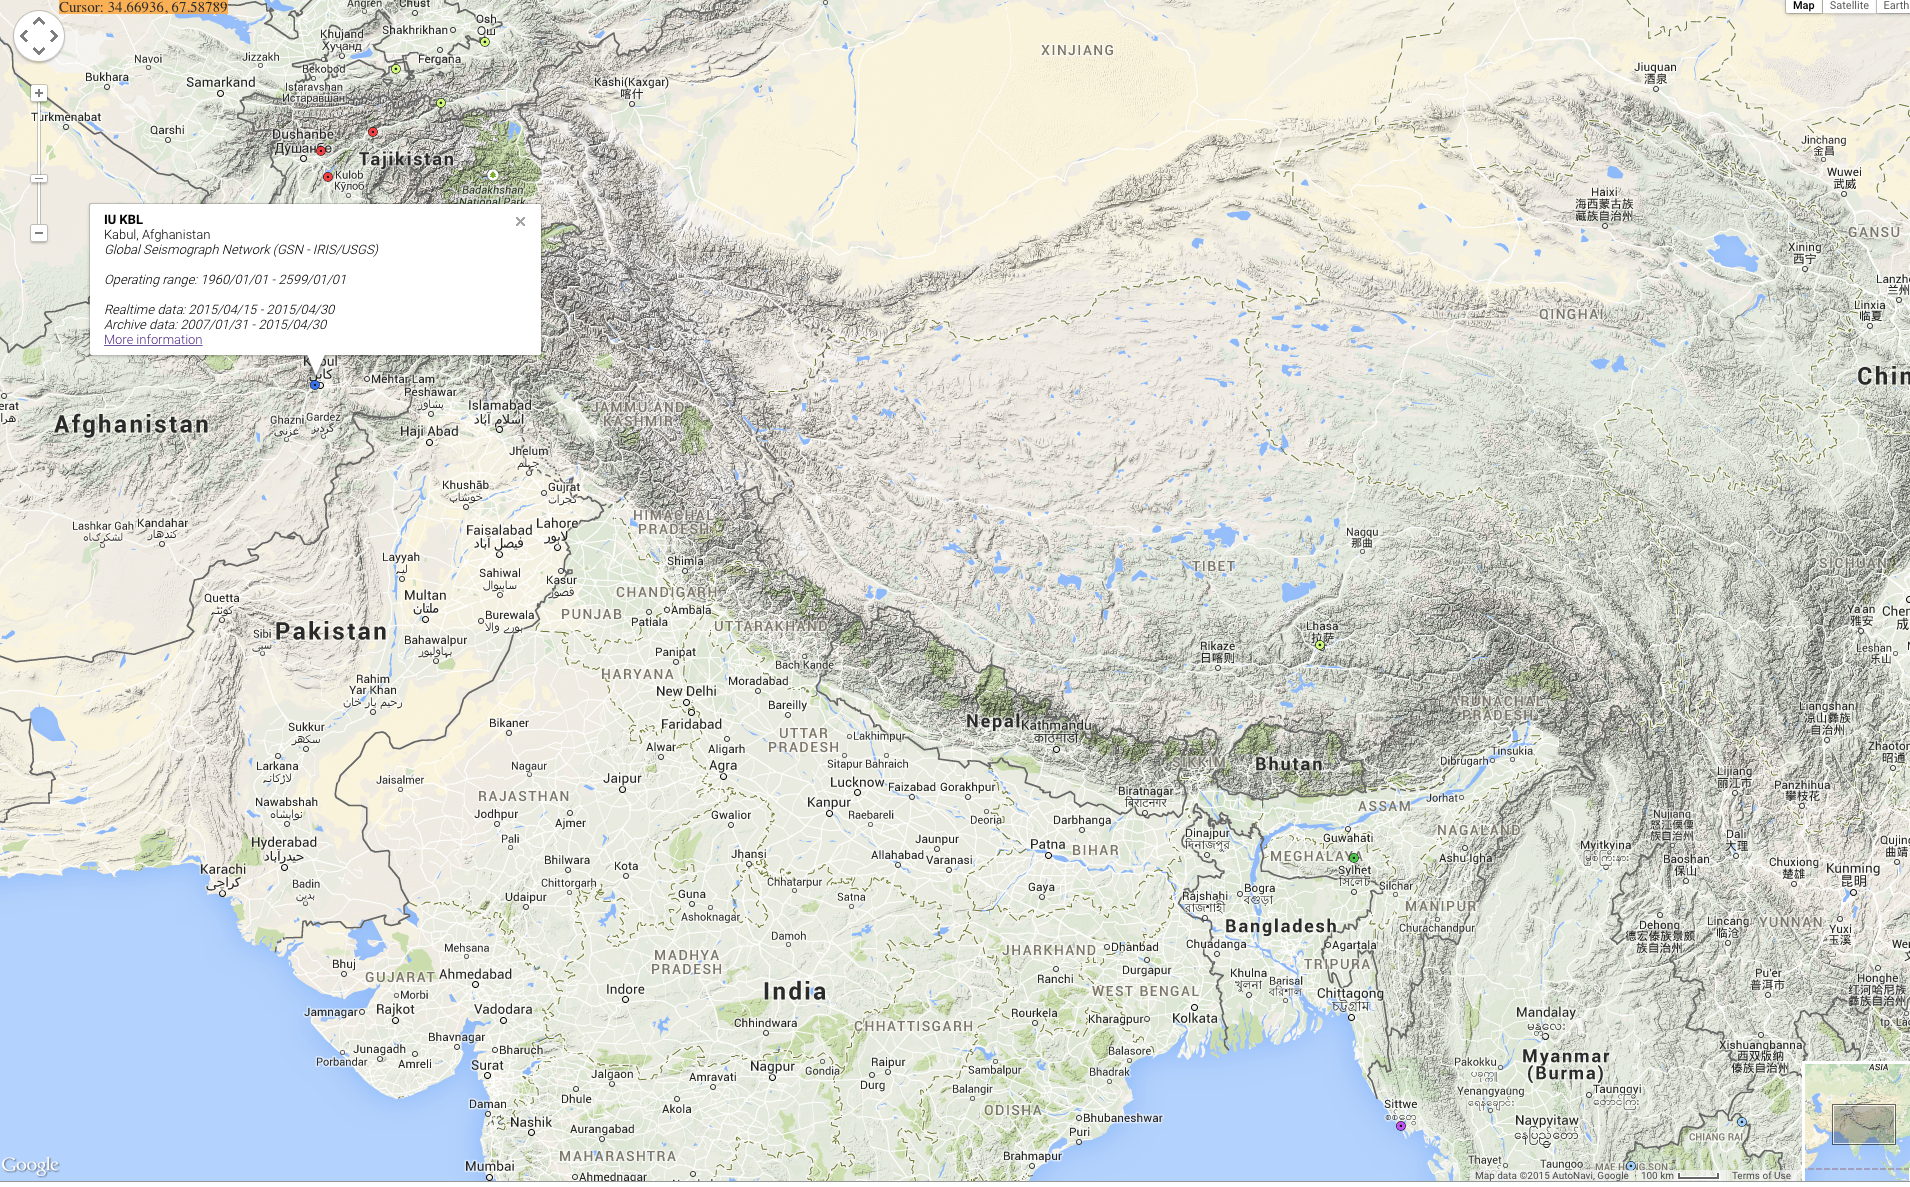
Next, we look a little further away at Kabul. While the shaking wasn't very strong (much smaller accelerations), we begin to see more interesting waveforms as phases are getting separated by traveling a greater distance of 1650 km (1025 mi).

Screen Shot 2015-04-30 at 10.41.07 AM

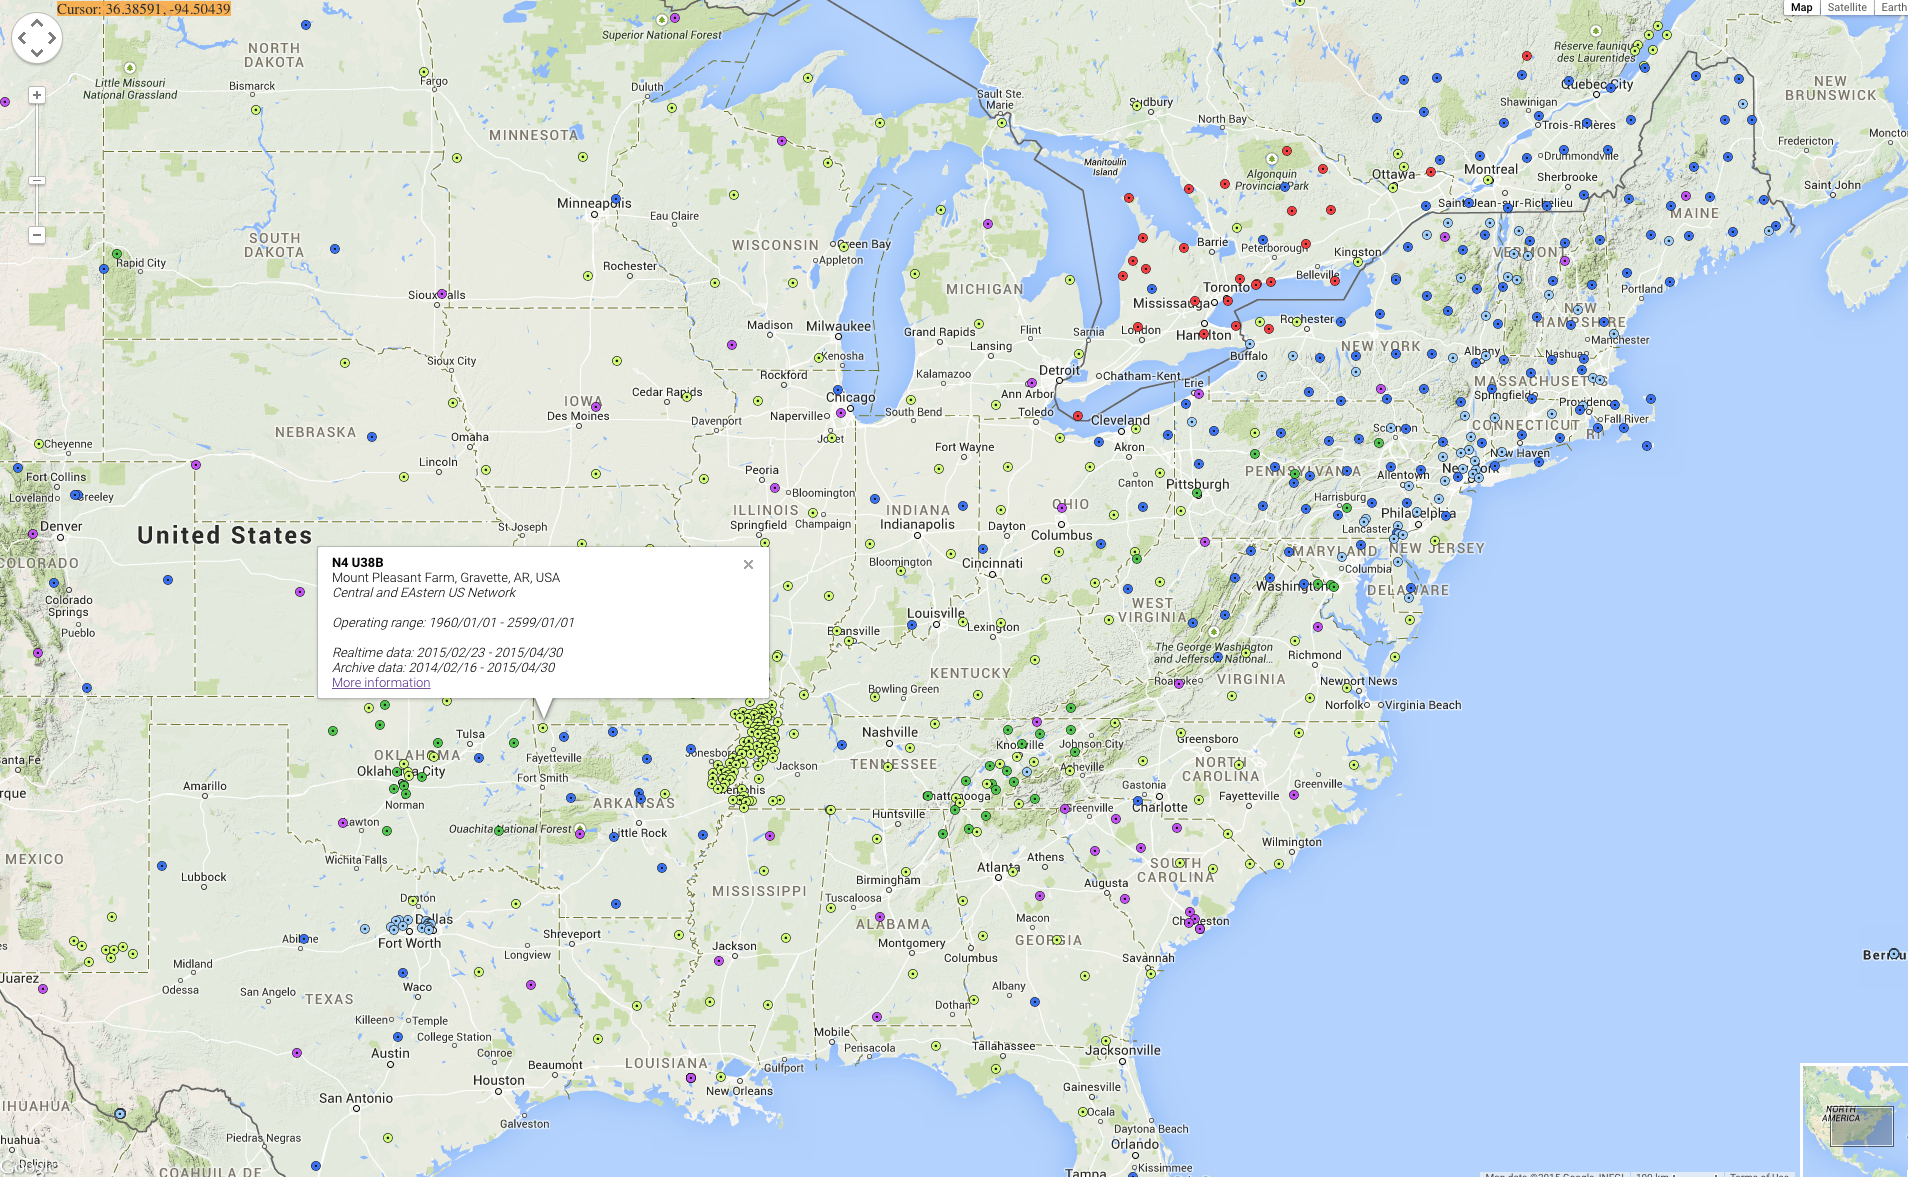
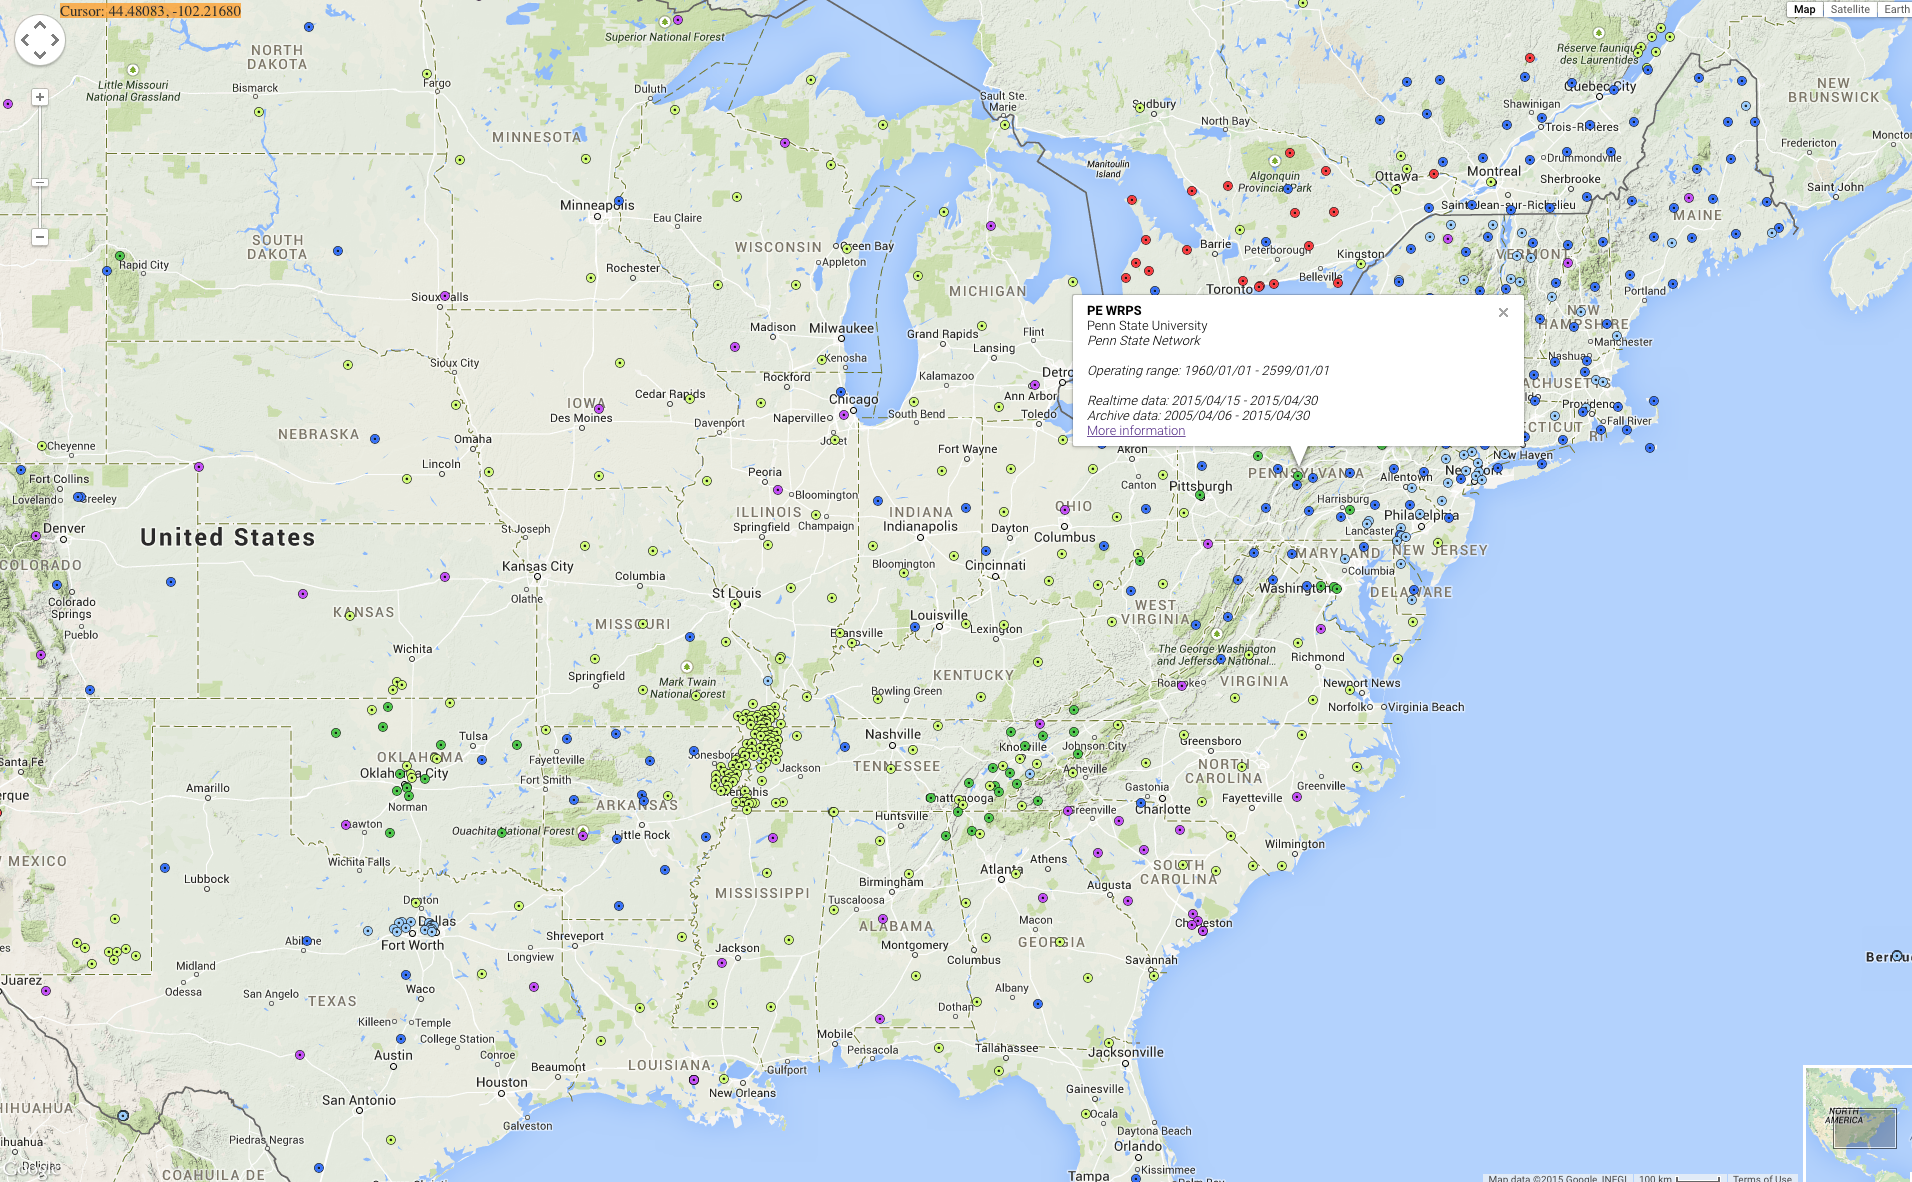
If we move much further away to the U.S., we see a very long record of motion. I made two animations for the U.S., one near where I grew up in Arkansas and one from the instrument in the basement of the geology building here at Penn State. There are some really great Rayleigh waves (the circular motion) around 3:51 in the Arkansas video and 3:18 in the Pennsylvania video.

Screen Shot 2015-04-30 at 10.41.36 AM

Screen Shot 2015-04-30 at 10.41.44 AM

I hope you find these videos interesting! There is a lot of possible post material in each one, but I wanted to be sure to get them out in a timely and collected way. The program to make these is completely open source on GitHub: https://github.com/jrleeman/SeismoVisualize and was inspired by the visualization of Mike Cleveland and Chuck Ammon.

Napa Valley Earthquake - Aug. 24, 2014

As I'm sure you've heard/read by now, there was a moderate earthquake in the Napa Valley region of California earlier today. At 3:20 AM a fault ruptured producing a magnitude 6.0, the largest for that area since 1989. So far the damage pictures I've seen coming out of the area show moderate to severe structure damage on older structures and lots of toppled book shelves and wine racks.

This earthquake has nearly a textbook slip pattern or focal mechanism. The plot below is often called the "beach ball plot" and is a way to represent how the fault moved. Without going into the details of how we construct a plot like this, we can simply interpret what we see. This plot shows a traditional strike-slip motion. This means that the plates slid past each other laterally with little motion up and down on the fault. This doesn't mean that there will be no up and down motion as the seismic waves propagate though!

Focal Mechanism Solution (usgs.gov)

Focal Mechanism Solution (usgs.gov)

We can also interpret from this beach ball that the strike-slip motion was right-lateral. If we were standing out in the ocean looking towards the other side of the fault inland California, we would see things shift to the right. This makes sense with the tectonics there as the pacific plate is grinding northwest past the North American plate. The locked plates bend and deform storing elastic strain energy, then finally fail, snapping into a state of lower stress. I've shown this elastic property of rocks before, but we have yet to really discuss the earthquake cycle in detail. Maybe one day soon I'll do some demonstrations about that though!

The final piece of the earthquake story I want to show you is a movie of the ground motion experienced at a seismometer in the Marconi Conference Center, Marshall, CA. This video shows what we would see if we could track a piece of the ground in 3D and watch it's motion as different seismic waves go by. There is lots of information in this plot, but for now just notice the large amounts of motion!  This is three minutes of data with 4 ground positions recorded per second in real time, then sped up.

As always, if you do happen to live in an earthquake prone area, be sure to have a plan, have an emergency kit, and always be prepared for any natural disaster!


It's All About the Waves - 2014's First Magnitude 7+ Event in Chile

There's been a decent amount of chatter amongst Earth scientists that it has been a long time since the last magnitude 7 or greater earthquake.  In fact, there hadn't even been one in 2014 until last night.  The earthquake is currently rated an 8.2 (mww) and occurred in a well known seismic gap that has been published on a decent amount in recent years.  The last major earthquake in North Chile was an 8.6 in 1877! Many smaller earthquakes in the area over the last weeks have kept everyone on their toes.

This location in Chile marks a major plate boundary where the Nazca plate is subducting, or being pushed under the South American plate.  The idea of subduction is that the two plates are being forced together and one ends up getting pushed underneath the other.  In this case, the cold and dense oceanic crust gets pushed underneath the less dense continental crust.  As we would expect, this means that the earthquakes occur on a very shallow angle thrust.  Moment tensor solutions can tell us about the fault by analyzing many seismograms.  Turns out that the moment tensor solution looks like about a 12-18 degree dip on the fault, not out of line with our prediction.  There are a lot more of the advanced scientific products such as the moment rate function here.  It looks like the rupture lasted for around 100 seconds and slipped a maximum of 6.5 meters (21 ft.) at a depth of near 30 km (18.6 miles).  The earthquake started a little more shallow though, about 20 km (12 miles) down.

There have been many aftershocks with the event, some sizable.  At the bottom of the post I've provided a channel list that I'm using to watch the aftershock sequence on the EpiCentral app (for iPad).  What I want to show are the buoy data though!  When a large earthquake of this type occurs, waves are generated in the ocean and the folks at the Pacific Tsunami Warning Center go into action.  There were some significant waves near Chile (about 2m/6.5 ft.).  It looks like, for the time being, most other locations such as Hawaii may be in the clear.  As I'm writing this the remnants of the waves should reach Hawaii in the next few hours.  Below is a rough travel time map from NOAA.

ChileTsunamiTravelTime

A list of the observations from the  warning center can be found in their most recent statement.  We can actually access the buoy data and look at the wave propagating across the ocean though!

When waves propagate across the water (or many other media) they often experience a phenomena called dispersion.  The idea is that waves are actually made of many frequency components, or notes if you will.  Because of some physics funny business, the longer period (lower frequency) waves will actually travel faster than the short period (high frequency) waves.  We can see this in the data below.  I'm showing two stations for sealevel.  They have different types of sensors, but that's not too important.  Be sure to click on the plot to see it full size (the link will open in a new window/tab)!

Wave_dispersion

We see exactly what theory predicts, long period waves coming in first, followed by progressively shorter period waves.  We also see that stations further out don't see the high frequency waves.  This is another phenomena in which the medium filters out high frequency waves over the travel.  We would say that the high frequency waves have been strongly attenuated.

That's all for now! Thank you for sticking with me through some interesting observations of predictions from math and physics!

Channel List:
C;GO01; --;BHZ;VERTICAL,CHUSMIZA, CHILE
C;GO01; --;BHE;EAST-WEST, CHUSMIZA, CHILE
C;GO01; --;BHN;NORTH-SOUTH, CHUSMIZA, CHILE
IU;LVC; 00;BHZ;VERTICAL, LIMON VERDE, CHILE
IU;LVC; 00;BHE;EAST-WEST, LIMON VERDE, CHILE
IU;LVC; 00;BHN;NORTH-SOUTH, LIMON VERDE, CHILE
C;GO02; --;BHZ;VERTICAL,MINA GUANACO, CHILE
C;GO02; --;BHE;EAST-WEST, MINA GUANACO, CHILE
C;GO02; --;BHN;NORTH-SOUTH, MINA GUANACO, CHILE

The Harlem Shake: Seismometer Records NY Building Explosion

Early this morning a large boom resounded throughout east Harlem as what is believed to be a gas explosion occurred at 1644 Park Avenue.  The five story building that was at that location, and its neighbor building, collapsed as a result of the explosion.  There were even reports of the shaking jamming doors in nearby structures.

The Lamont-Doherty observatory posted the following on Twitter, showing a plot of the event recorded on the Central Park station.  I haven't looked around to see if I can find it on any other stations to do a similar exercise as the Russian meteorite explosion, but I doubt there is enough data.

Screen Shot 2014-03-12 at 3.53.16 PM


As always, don't forget to follow the observatory (@LamontEarth) and me (@geo_leeman) on twitter!

Remembering Challenger: 28 Years

722342main_challenger_full_full

It's been 28 years since the Space Shuttle Challenger (STS-51-L) broke apart just over a minute after launch.  Disasters like Challenger and Columbia remind us that space exploration really is a complicated and risky business.  Should we stop because something is risky? Absolutely not, but we should also not let such things become routine and fall out of the public view.

Remembering the Challenger Crew

The NASA family lost seven of its own on the morning of Jan. 28, 1986, when a booster engine failed, causing the Shuttle Challenger to break apart just 73 seconds after launch.

In this photo from Jan. 9, 1986, the Challenger crew takes a break during countdown training at NASA's Kennedy Space Center. Left to right are Teacher-in-Space payload specialist Sharon Christa McAuliffe; payload specialist Gregory Jarvis; and astronauts Judith A. Resnik, mission specialist; Francis R. (Dick) Scobee, mission commander; Ronald E. McNair, mission specialist; Mike J. Smith, pilot; and Ellison S. Onizuka, mission specialist.

Via NASA

20 Years Since Northridge

FEMA_-_1807_-_Photograph_by_Robert_A._Eplett_taken_on_01-17-1994_in_California

Today marks 20 years since the famous Mw 6.7 Northridge earthquake.  In the early morning hours the earthquake hit the San Fernando Valley region of California and caused massive destruction.  In the 20 seconds of shaking there were around 60 deaths and over 8,700 injuries.

While the magnitude is strong, it really isn't that impressive.  What is impressive about this event is the accelerations and velocities involved.  The ground acceleration was up to 1.8g (~54 feet/second^2) and the peak ground velocity was the highest ever recorded at just over 6 feet/second (1.83m/s)!

Without going into all the details of the earthquake that are easily available, I would rather provide a news clip of the evening after the event and ask a question.  If you live in an earthquake prone region, do you have a disaster plan?

As you can see in the video, when gas mains are snapped and fires start there are only minutes to evacuate.  Take some time and put together a survival bag as well as talk to your family (especially children) about what to do during a disaster.  Even if you don't live in an area with significant earthquake hazard this is important to do with the upcoming severe weather season.  Some helpful links are provided at the bottom!

Links

American Red Cross Survival Kit
Ready.gov Survival Kit
CDC Earthquake Health Information
FEMA Ready.gov  Earthquake Information
Earthquake Safety at Work

Texas Fertilizer Plant Explosion Shakes the Ground

Another quick post of some interesting data concerning the explosion at the fertilizer plant in Texas.  Yesterday (4/17/13) there was a large explosion at approximately 7:50 pm local time.  As of early this morning reports showed around 179 people hospitalized, 24 in critical condition, and 5-15 fatalities.  Currently 3-5 firefighters and one law enforcement officer are unaccounted for.  Over 60 homes were damaged by the very large blast.

The best video I've seen so far is attached below, the explosion happens around 30 seconds in.  Also below is the initial emergency services traffic.


Finally, we can look at data from the Amarillo seismic station (US.AMTX).  I've pulled down the data and filtered it to show all frequencies above 1Hz.  We expect the explosion to produce mostly high frequency signals and attenuate, or lose strength, quickly (why I didn't see the explosion on any other stations such as US.WMOK in Oklahoma).  It looks like there are 6 main pulses of energy (possibly tanks failing?) very quickly and the large explosion in a period of around 10 seconds.

If you want to look at the data yourself I've made the SAC file available here or you can download the data from IRIS and duplicate the filtering with the following OBSPy code:

EDIT: The USGS posted a transportable array station that was closer to the event (seismogram below) that shows both the fast ground waves and the slower air blast.  They classify this as a magnitude 2.1 event on the event page, but it's really a larger explosion than that hints at as magnitude is only based upon ground motion.

Surviving a Crash - The Black Box Then and Now

After an airliner crashes there is a search for survivors (of which you have about a 1:100 chance of being among) and the search for the ever important in infamous 'black box'.  The black box records critical flight data that helps accident investigators determine what caused the crash and if there are problems with the airplane model that need to be corrected.  This was the case of the stripping jack screw in the tail of the MD-83 that caused the crash of Alaska Air 261 in 2000.  The black box has undergone many transformations over the years, but it has always had to be a durable machine that can preserve data through  the dramatic forces of a crash, water immersion, and inferno like fires of jet fuel and airframe materials.

Some of the earliest flight data recorders used photographic film rolls that had lines exposed on them by light reflected of sets of mirrors.  The mirrors were deflected different amounts according to aircraft parameters resulting in a 'strip chart' on the film.  This was easy to develop, but was only a one time use as the film had to be replaced after exposure.  The first data recorders just recorded a few simple channels of data and were common only on test flights due to their cost.

Later black boxes, like the one featured in the video below, used metal strips with the data scratched into the metal by a sharp stylus.  These records survived the fire and shock much better than film, but were still single use.  Keep in mind this is still all done with 'old fashioned' technology as there was no solid state memory in these days.  The next step was voice recording.  What were the pilots talking about before the crash?

Video on Analog Recorder

In the 1950's spy gadgets were the rage in the intelligence community and they required some of the same properties that aircraft flight data recorder designers desired: compact, durable, simple.  Wire recording was the answer.  Magnetically encode data on a spool of wire and use a ground based playback/decoding system.  It wasn't long before both the flight data and the cockpit voice data were being recorded on the same wire reel.  This reel could be erased and used again.

Modern flight data recorders and required to store at least 88 parameters by law (US) and they are solid state.  There are a few cases where the data has been unreadable to due destruction of the unit, but new units that propel themselves from the crash may solve that problem.  The new recorders also transmit a beacon signal making them easier to find for about a month.  Some of the smart units are even capable of observing when inputs are changing rapidly and collecting data more often as this is when things are likely to go wrong.

The purpose of this trip through the history of the flight data recorder was not only to show the evolution of a remarkable and very useful device, but to show how engineering problems can be solved without a microchip.  Are the recorders now better than those of the film days? Of course, but it required some out of the box thinking to build the mechanical recorders of the early days of aviation.

Deepwater Horizon and Hydrates

By now all are well aware of the well blowout in the gulf at the 'Deepwater Horizon' site.  Thus far several attempts have been made to curb the flow of crude into the gulf, but none have worked.  One of the first attempts was to use a dome structure to cover the rupture and direct the oil to a waiting barge.  This dome quickly filled with gas hydrate and was made much more buoyant by the hydrate (density of hydrate is less than that of water, especially sea water).  Attached is a picture of the 4-story dome courtesy telegraph.co.uk.  I feel it is important to point out a few things about hydrate the media has either left out or stated incorrectly.

First, what is gas hydrate? The most common buzz word I've seen is 'crystalline gas' or 'solid gas'.  These are contradictions.  We know there are three basic states of matter: solids, liquids, and gasses. (There are also plasmas, Bose-Einstein condensates, string-net liquids, and so on.) You can see that a 'solid gas' is simply incorrect! Gas hydrates are cages of water molecules with a guest molecule of gas trapped inside.  There are different types of cages for different sizes of guest molecules.  Though the material can look like ice it is fundamentally different.

Under the ocean there is quite a lot of methane hydrate.  We have known about hydrate for some time and it's important for past climate change, possible energy production, and as a potential hazard for sea slopes and drilling operations.  Dr. Robert Bea of UC Berkeley has suggested that Halliburton cementing the well only 20 hours before the explosion on the rig is important.  When cement is hardening is releases heat. This heat of crystallization could have heated the hydrate up.  The hydrate weakened the concrete and as it was melting released its gas, causing a surge of pressure to the rig.

Hydrates have been a problem to the industry before, clogging pipelines and apparatus.  Hydrates only form under certain pressure and temperature conditions, so the areas can simply be kept out of P-T ranges where hydrate would be stable.  This is easier said than done, and sometimes inhibitors are injected.  Chemicals such as methanol decrease the stability of hydrate.

So what is the plan now? Currently an attempt to place a new, capped section of pipe on is underway.  The difficulty with any plugging operation is the pressure at which the fluid is shooting out.  If this fails a smaller dome has been built in hopes that it will remain warmer and hydrate will not be stable. There are also measures in place to inject hydrate inhibitors, though this could have unknown environmental impacts.  Currently oil continues to gush out at about 210, 000 gallons/day.  Below is an image from NOAA (May 11) showing the spread of oil then some links to follow.  Numerical modeling of the spread has done surprisingly well as has put rapid mathematical modeling in the spotlight also.

Afterthought:
I received a question about why the flow rate estimates were so widely varied.  In the video of the flow you can see both oil and gas phases coming out of the pipe. If it were just one phase, knowing the scale and frame rate of the pipe would be sufficient to get an accurate estimate. It could be that as oil is releasing pressure more hydrate is dissociating and causing the bursts of mixed gas making the flow hard to figure.


LINKS:
Video of Oil Leak
NOAA Page on the Accident (Updated Daily)
LA Times Article on Dr.Bea's Idea

Chernobyl

Chernobyl nuclear unit number four blew up 24 years ago today.  Officially the disaster killed about 31 people, but we all know that the death toll is much higher.  Today I'd like to briefly discuss the very basic premise of the accident, what actions the Soviets took, and what we can learn from this accident.
The accident occurred during a test that really should have already been preformed.  In the event of the plant losing external power it would take backup generators about a minute to get up to speed and start coolant circulating again.  This was dangerous and the engineers believed that they could use the inertia of the already spinning turbines to generate enough power to run the plant for about 45 seconds.  The details are well documented, but in the end the power spiked, control rods jammed, and the reactor went out of control.  
These RMBK reactors are inherently unstable at low power levels, and the operators did not understand reactor physics well enough to understand what the instrumentation was telling them.  The control rods only reached just over 2m into the reactor before they seized.  The reactor was 7m deep.  
There were two explosions, a steam explosion, followed closely by an explosion from nuclear excursion.  All of this is well explained elsewhere, but at the time the causes were unclear.  In fact, several of the operators thought a tank of hydrogen had exploded, even though they could see chunks of graphite on the ground outside.  
Almost immediately radioactive dust was showering from vents in the plant and many crew received lethal doses and a 'nuclear tan' very quickly.  They were simply replaced with workers from the other reactors.  Some were sent i to lower the control rods manually, only to find that none of that existed anymore.  They instead saw fire hoses dangling unmanned, the firefighters had already fallen after standing right above the core of the unit.   
The government lied in many cases to the workers and public.  One community was given masks and iodine but didn't distribute them to prevent a panic.  The supplies went to waste.  After that liquidation crews were brought in.  The robots were unreliable and failed quickly.  The government sent soldiers onto the reactor with little protection, they were called 'bio-robots'.  The human side of the story is excellently captured in the book Voices from Chernobyl: The Oral History of a Nuclear Disaster, available here.  The book is also available in many libraries and I highly recommend it, though some of the stories are graphic. Pictured above is the reactor after the explosion, it was enclosed in a hastily built sarcophagus, which is now unstable and must be rebuilt.  The condition of the tunnels dug under the plant by 'bio-robots' is also unknown.  The next picture is of a robot bulldozer being tested.  These were used to bury the cities, but failed to work well and were often replaced by humans.  Some photos from the zone also show spots, recording the massive radiation release.  
So what can be learned from this accident? The obvious results are more training, containment domes, and better reactor design.  The other lessons are about government and public education.  Let's focus on the less controversial public education issue.  Many people refused to leave the zone because nothing was wrong.  They couldn't understand the power of the atoms, the sky was blue, and there was a fire in the distance; why should it mean anything to them? This is why the public needs a basic science education, but now I fear the US has gone too far and induced a fear of the atom.  Nuclear power is a technology to be respected, not feared.  With proper construction, safety measures, and current technology there is no reason to fear an accident in the US.  Waste products are another issue entirely.  
In closing I encourage you to do some research and learn about this disaster.  Also remember all the brave 'bio-robots' that were sent to the station to die while attempting to contain the situation.  You can watch this short video for some photographs from the area.  A documentary about the accident is also available on youtube. 
(None of the photographs are mine, all sourced from Wikipedia)