There's been a decent amount of chatter amongst Earth scientists that it has been a long time since the last magnitude 7 or greater earthquake. In fact, there hadn't even been one in 2014 until last night. The earthquake is currently rated an 8.2 (mww) and occurred in a well known seismic gap that has been published on a decent amount in recent years. The last major earthquake in North Chile was an 8.6 in 1877! Many smaller earthquakes in the area over the last weeks have kept everyone on their toes.
This location in Chile marks a major plate boundary where the Nazca plate is subducting, or being pushed under the South American plate. The idea of subduction is that the two plates are being forced together and one ends up getting pushed underneath the other. In this case, the cold and dense oceanic crust gets pushed underneath the less dense continental crust. As we would expect, this means that the earthquakes occur on a very shallow angle thrust. Moment tensor solutions can tell us about the fault by analyzing many seismograms. Turns out that the moment tensor solution looks like about a 12-18 degree dip on the fault, not out of line with our prediction. There are a lot more of the advanced scientific products such as the moment rate function here. It looks like the rupture lasted for around 100 seconds and slipped a maximum of 6.5 meters (21 ft.) at a depth of near 30 km (18.6 miles). The earthquake started a little more shallow though, about 20 km (12 miles) down.
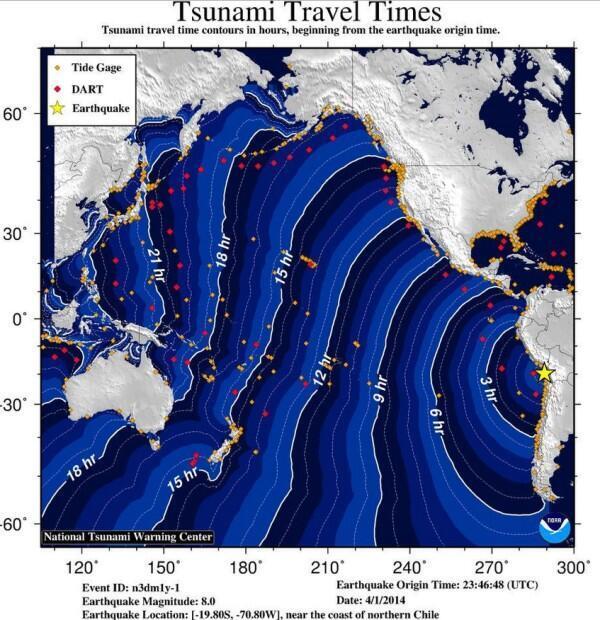
There have been many aftershocks with the event, some sizable. At the bottom of the post I've provided a channel list that I'm using to watch the aftershock sequence on the EpiCentral app (for iPad). What I want to show are the buoy data though! When a large earthquake of this type occurs, waves are generated in the ocean and the folks at the Pacific Tsunami Warning Center go into action. There were some significant waves near Chile (about 2m/6.5 ft.). It looks like, for the time being, most other locations such as Hawaii may be in the clear. As I'm writing this the remnants of the waves should reach Hawaii in the next few hours. Below is a rough travel time map from NOAA.
A list of the observations from the warning center can be found in their most recent statement. We can actually access the buoy data and look at the wave propagating across the ocean though!
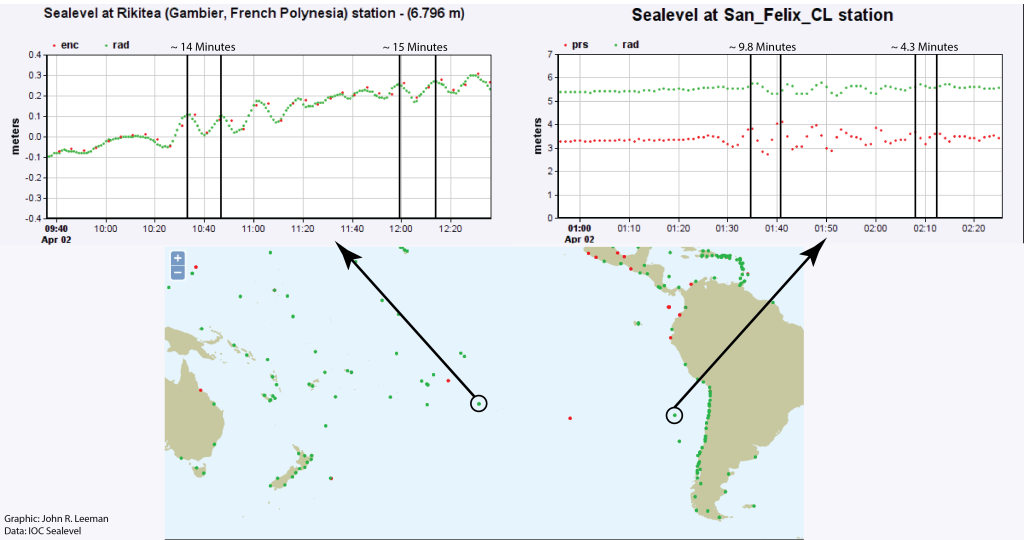
When waves propagate across the water (or many other media) they often experience a phenomena called dispersion. The idea is that waves are actually made of many frequency components, or notes if you will. Because of some physics funny business, the longer period (lower frequency) waves will actually travel faster than the short period (high frequency) waves. We can see this in the data below. I'm showing two stations for sealevel. They have different types of sensors, but that's not too important. Be sure to click on the plot to see it full size (the link will open in a new window/tab)!
We see exactly what theory predicts, long period waves coming in first, followed by progressively shorter period waves. We also see that stations further out don't see the high frequency waves. This is another phenomena in which the medium filters out high frequency waves over the travel. We would say that the high frequency waves have been strongly attenuated.
That's all for now! Thank you for sticking with me through some interesting observations of predictions from math and physics!
Channel List:
C;GO01; --;BHZ;VERTICAL,CHUSMIZA, CHILE
C;GO01; --;BHE;EAST-WEST, CHUSMIZA, CHILE
C;GO01; --;BHN;NORTH-SOUTH, CHUSMIZA, CHILE
IU;LVC; 00;BHZ;VERTICAL, LIMON VERDE, CHILE
IU;LVC; 00;BHE;EAST-WEST, LIMON VERDE, CHILE
IU;LVC; 00;BHN;NORTH-SOUTH, LIMON VERDE, CHILE
C;GO02; --;BHZ;VERTICAL,MINA GUANACO, CHILE
C;GO02; --;BHE;EAST-WEST, MINA GUANACO, CHILE
C;GO02; --;BHN;NORTH-SOUTH, MINA GUANACO, CHILE


