
As I'm sure you've heard/read by now, there was a moderate earthquake in the Napa Valley region of California earlier today. At 3:20 AM a fault ruptured producing a magnitude 6.0, the largest for that area since 1989. So far the damage pictures I've seen coming out of the area show moderate to severe structure damage on older structures and lots of toppled book shelves and wine racks.
This earthquake has nearly a textbook slip pattern or focal mechanism. The plot below is often called the "beach ball plot" and is a way to represent how the fault moved. Without going into the details of how we construct a plot like this, we can simply interpret what we see. This plot shows a traditional strike-slip motion. This means that the plates slid past each other laterally with little motion up and down on the fault. This doesn't mean that there will be no up and down motion as the seismic waves propagate though!
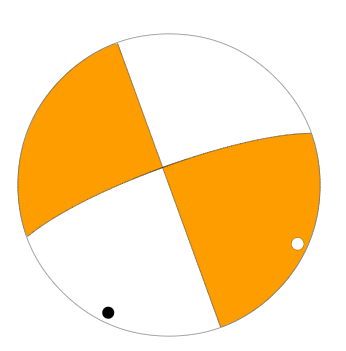
Focal Mechanism Solution (usgs.gov)
We can also interpret from this beach ball that the strike-slip motion was right-lateral. If we were standing out in the ocean looking towards the other side of the fault inland California, we would see things shift to the right. This makes sense with the tectonics there as the pacific plate is grinding northwest past the North American plate. The locked plates bend and deform storing elastic strain energy, then finally fail, snapping into a state of lower stress. I've shown this elastic property of rocks before, but we have yet to really discuss the earthquake cycle in detail. Maybe one day soon I'll do some demonstrations about that though!
The final piece of the earthquake story I want to show you is a movie of the ground motion experienced at a seismometer in the Marconi Conference Center, Marshall, CA. This video shows what we would see if we could track a piece of the ground in 3D and watch it's motion as different seismic waves go by. There is lots of information in this plot, but for now just notice the large amounts of motion! This is three minutes of data with 4 ground positions recorded per second in real time, then sped up.
As always, if you do happen to live in an earthquake prone area, be sure to have a plan, have an emergency kit, and always be prepared for any natural disaster!