Reviving a Piece of the 1970's: ISEE-3

hello.again.m

There's been a decent buzz in the space and tech communities about the "ISEE-3 Reboot Project", so I thought it would be worth mentioning here and pointing out some of wonderful techniques they are using to revive a satellite from almost 40 years ago.

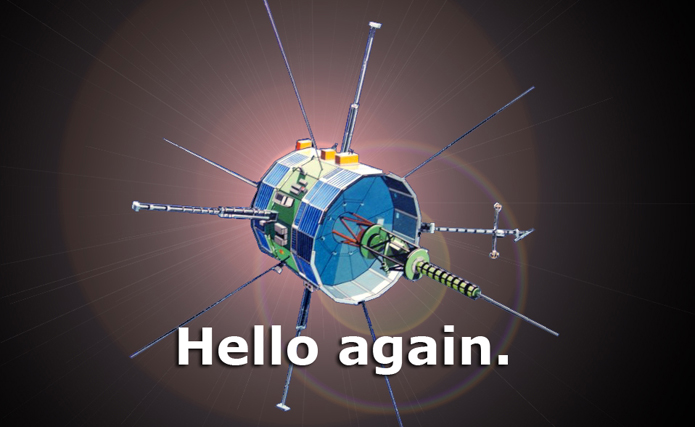
The ISEE-3 satellite is one of three satellites that made up the International Cometary Explorer (ICE) program.  There were some interesting orbital things done with this satellite after its launch in August of 1978.  It was also the first spacecraft to go through the tail of a comet!  As with all missions, this one came to an end and the satellite was not head from since 1998.  The equipment to talk to the satellite was removed and it was considered to be out of service.

ISEE-3 sits in a heliocentric orbit, meaning that orbits the sun, not the Earth.  We knew that ISEE-3 would make another stop by our planet in 2014 when it was parked in this orbit in 1986 (from what I can tell anyway).  A group of citizen scientists started the ISEE-3 Reboot project, crowd funded on the internet.  They got permission to take over the satellite and intend to use the Moon's gravity and a rocket burn to send it on another mission.  If the window of June is missed, the satellite will probably never be heard from again.

The team was able to contact ISEE-3 on May 29 using the Arecibo observatory radio telescope.   The craft was commanded to transmit engineering telemetry, basically a health screening of the systems.  The team is currently busy decoding the data (streaming in at 512 bits/sec) and planning how they will execute the rocket burn.

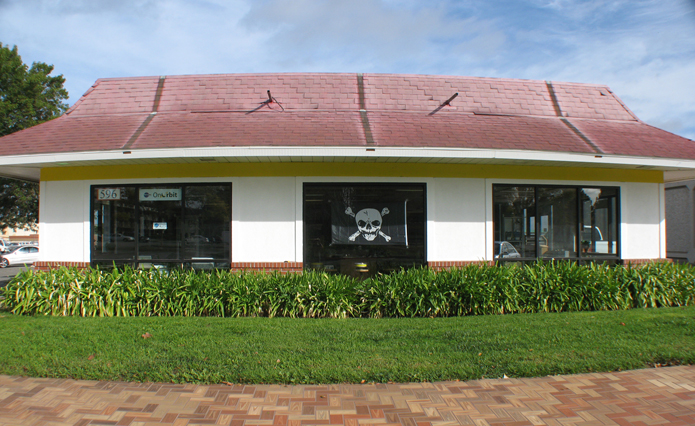
The team is running out of an old McDonalds at the NASA Ames Research Park, the makeshift mission control has been termed "McMoons" after hosting previous space based projects.

IMG_3113


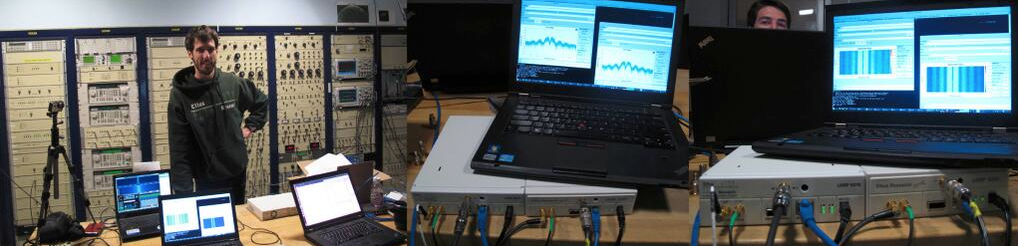
The part of this that I find amazing is the role that software defined radio is playing.  Software defined radio (SDR) is a way to use software to emulate radio equipment.  With a small USB stick I can receive many different kinds of radio signals and decode them, something that would have required racks of equipment a few years ago.  This team is using a radio termed the "USRP" that allows them to transmit and receive.  I've written about them before (here) and have used them in research.  They are amazing little units and provide a unique learning opportunity.  (Maybe I'll post something about a radar we made with one of them as a demo!)  A photo tweeted by the team shows 2 USRP units and laptops hooked into the giant dish antenna at Arecibo.

Screen Shot 2014-06-02 at 12.51.08 PM


That's all for now, but stay tuned to the team's website for updates and I'll be keeping up with the progress as well.  This is just another incredible example of how advanced hardware and software that has become relatively cheap can allow a group of savvy citizens to accomplish incredible feats!  Way to go folks!


Drawdio: Creating Music with Your Hands

Awhile back I saw a post from the folks at the MIT Media Lab on a little creation they called the "drawdio" (here).  This looked like a fun little project! It's an oscillator based on the classic 555 timer integrated circuit, but with a twist.  The twist is that you can control the frequency of the oscillation (tone of the note played by a speaker) by varying the resistance between two contacts.  These contacts seem to commonly be a pencil lead and your body, but as the MIT website demonstrates, almost anything can be used.

Schematic: Make.com

Schematic: Make.com

I decided it was time to build one of these, so I headed over the MAKE to get the plans.  I already had most of the parts (or good substitutes) on hand.  The battery holder and enclosure would have to come later.  I built the circuit with simple point-to-point wiring on perforated board.  The speaker is a salvaged part from a fax machine!

Drawdio No Case


I plugged the power supply in a touched the signal wires together.  The speaker let out a shrill tone and we were in business.  The next challenge was figuring out a case a final setup for the device.  I wanted this to be durable since lots of people at work and home would be playing with it.  The solution ended up being hot glue and a plastic crayon case.  I drilled holes in the case above the speaker for sound and added a power switch.  The final touch was terminal posts for the sense wires that control the pitch.

To make the sensor I just wrapped bare wire around a pencil body for one contact and inserted a push pin into the lead at the top for a second contact.  The goal is to complete that circuit and change the resistance between the two contacts.  The easiest way is to draw a graphite track on paper and make the circuit through your hands.  See the demo video below.

This is an incredibly fun project and can be very educational to the beginning electronics hobbyist or a way to get school children interested in STEM fields.  What are you waiting for? Go build a drawdio! (Kits available from Adafruit)

Why a Standing Desk Didn't Work for Me

Standing Desk Leeman

I spend a lot of time at work... probably more than is really healthy for me.  In an effort to mitigate any harmful effects that working has on my health, I decided to try the standing desk idea.  We've all heard about how sitting all day is very detrimental to your health (example).  Recently our department has been renovating offices and giving people the option of a small motorized adjustable height desk.  I was very excited about his until I found out that my office was not going to be renovated.  I looked at the standing desks that professors had purchased, such as the Geek Desk, but realized that those commercials desks are out of the graduate student budget.  I also had never used a standing desk before.... what if it didn't work for me?

After reading lots of articles online, I decided to build something like a standing desk on-top of my existing desk.  Following the advice over at "Only a Model", I made the IKEA pilgrimage and bought the required parts (a coffee table, a shelf, and two brackets).  I got back, cleaned off my desk, assembled the parts, and had my very own standing desk!  It was slightly shaky under the weight of two 27" monitors, but overall useable.  I thought my health problems had been successfully avoided.

I noticed that my feet began to get sore, walking down the hall at the end of the day was painful.  Reading more, it appeared that I needed a foot pad.  I bought the best that I could find, in fact it cost more than all of my standing desk parts!  The mat was incredibly comfortable and thick enough that I could take my shoes off and dig my toes in.  It still didn't solve the problem though.  I continued standing for weeks, brought in a stool to sit a few hours a day, but no gain.  Standing felt great, but not for 10-12 hours a day.

I noticed that doing tasks such as filling out paperwork that required focus, but not creativity were helped.  I wanted to get it done! Tasks like writing and coding suffered.  Not being able to lean back and think of the right words or the correct function call slowed me down.  Reading and absorbing papers was also difficult.  At the end of the day, it just wasn't working (another example).

Maybe if I only worked 8 hours a day, 5 days a week, things would have gone differently.  An adjustable height desk may have helped as well, but I doubt that I would take the time to change configurations more than once a day.  I ended up back at my sitting configuration with a new coffee table at home.

There are other options out there.  Several people in the department have recently purchased a FitDesk. These cycle desks look good for computer tasks, but are not intended to replace a full desk with their small surface area.  Probably the best option is to have multiple work spaces.  One standing position, one sitting position, and possibly something else as well.  That's possible if you have a larger office/cube, but a small office with 6 graduate students just doesn't have the room.

So what do I do? I've been trying to be better about getting up every hour or so and taking a short walk/refocusing my eyes at a long distance.  Maybe something like a foot roller would help as well.  What is your workspace setup like? Remember to make sure it is ergonomic!

Literature Inertia - Maintaining Stability or Discouraging Exploration?

Image: http://tctechcrunch2011.files.wordpress.com/

Image: http://tctechcrunch2011.files.wordpress.com/

Recently I've been thinking a lot about literature inertia and the best ways to accommodate and deal with it.  What is literature inertia? It is a phrase that a professor I had at Penn State used to describe the common theme in fields of research where things are done a certain way because that's the way they have always been done.  Everyone bases their analysis or technique on one "seminal" paper at some point in the past.  The methods in that paper are likely the first methods tried that succeeded, and everyone has used them ever since.

I can see some benefits to literature inertia.  For one, it provides a consistent way things are done or a "standard" analysis program that all scientists in the field use.  This kind of stability allows long term comparison and inter research group comparability.  That's fantastic! Maybe the method isn't exactly ideal, but it is the same everywhere and eliminates some of the variables that would otherwise be present.   Inertia of a field also means that the wheel isn't re-invented all of the time, which saves the researcher time and lets them pursue the research, not the methods.  But is that best for the advancement of science?

The downsides of literature inertia are just as significant as its advantages though.  The original methods or code that become the "standard" is likely one of the first that worked well when the research was in the discovery phase.  It is also, by necessity, a bit old.  There are likely better methods developed that could produce better results.  I also believe that the pressure to use a standard procedure is discouraging exploration.  Funding isn't commonly given to explore and test new ways of solving a solved problem! Literature inertia can also bias a field against an idea for decades.  There are some sub-disciplines that are considered to be very delicate research areas.  Working on these new and poorly understood areas runs the risk of having your career marked early as being a borderline crank.  Many reasonable ideas have been floated in these fields, but quickly shot down by those following the inertia.  Often these ideas are thrown out with little work done to legitimately check their validity.  Likewise, one true crank can make an entire area taboo for all researchers.

So what's the answer to this problem? Well, like so many things in science, it probably lies in the gray area in between.  While some stability is needed so that each researcher isn't approaching a problem from completely different directions, there should be less discouragement of exploration.  Standards are also temporary.  Nothing in research is truly permanent.  Standards will become out-dated and need replaced.  This process isn't easy, painless, or fun, but necessary if science is to remain current and relevant.

Computer data formats are one example I can think of to illustrate inertia. There are many great formats that will stick around for some time such as JSON, HDF5, NetCDF, etc.  Some labs still insist on having their own data format though! This is puzzling because the computer scientists have done a very good job of making a flexible data format that is supported by most major programming and scripting languages.  The labs using in-house formats must distribute readers (normally only in one or two languages) or share bulky text files to collaborate with others.  Why do these labs insist on their format? Because it is what they have been using for years and they don't want to invest the time and effort to change to a more open format.  Inertia, for those groups, is crippling their ability to use more recent tools.  That matters because if more tools are available to analyze data and they are easy to use, researchers will find it easier to explore their data.

Another example is inversion techniques commonly used to solve for things like earthquake location problems.  Some fields are using inversion techniques that came about in the 1950's.  These techniques work, in fact, they have been tuned over the years to work very well.  For operations on a day to day basis, that stability is important.  It is the job of researchers to try new techniques though and explore/improve.  Every technique has a weakness, and trying many is important!

I do think that many standard techniques will be challenged with a new group of researchers coming into the job market, but I am concerned about how going against literature inertia could damage long-term job prospects.  I've heard well respected traditional faculty say things like "This computer data management problem isn't a decision for you early career people or something you should be involved with."  Like wise I've also seen some excellent ideas get pushed out because it isn't the same way things have always been approached.  This attitude is likely propagated by the pressure to publish and the damping that puts on free exploration.  What do you think?


It's All About the Waves - 2014's First Magnitude 7+ Event in Chile

There's been a decent amount of chatter amongst Earth scientists that it has been a long time since the last magnitude 7 or greater earthquake.  In fact, there hadn't even been one in 2014 until last night.  The earthquake is currently rated an 8.2 (mww) and occurred in a well known seismic gap that has been published on a decent amount in recent years.  The last major earthquake in North Chile was an 8.6 in 1877! Many smaller earthquakes in the area over the last weeks have kept everyone on their toes.

This location in Chile marks a major plate boundary where the Nazca plate is subducting, or being pushed under the South American plate.  The idea of subduction is that the two plates are being forced together and one ends up getting pushed underneath the other.  In this case, the cold and dense oceanic crust gets pushed underneath the less dense continental crust.  As we would expect, this means that the earthquakes occur on a very shallow angle thrust.  Moment tensor solutions can tell us about the fault by analyzing many seismograms.  Turns out that the moment tensor solution looks like about a 12-18 degree dip on the fault, not out of line with our prediction.  There are a lot more of the advanced scientific products such as the moment rate function here.  It looks like the rupture lasted for around 100 seconds and slipped a maximum of 6.5 meters (21 ft.) at a depth of near 30 km (18.6 miles).  The earthquake started a little more shallow though, about 20 km (12 miles) down.

There have been many aftershocks with the event, some sizable.  At the bottom of the post I've provided a channel list that I'm using to watch the aftershock sequence on the EpiCentral app (for iPad).  What I want to show are the buoy data though!  When a large earthquake of this type occurs, waves are generated in the ocean and the folks at the Pacific Tsunami Warning Center go into action.  There were some significant waves near Chile (about 2m/6.5 ft.).  It looks like, for the time being, most other locations such as Hawaii may be in the clear.  As I'm writing this the remnants of the waves should reach Hawaii in the next few hours.  Below is a rough travel time map from NOAA.

ChileTsunamiTravelTime

A list of the observations from the  warning center can be found in their most recent statement.  We can actually access the buoy data and look at the wave propagating across the ocean though!

When waves propagate across the water (or many other media) they often experience a phenomena called dispersion.  The idea is that waves are actually made of many frequency components, or notes if you will.  Because of some physics funny business, the longer period (lower frequency) waves will actually travel faster than the short period (high frequency) waves.  We can see this in the data below.  I'm showing two stations for sealevel.  They have different types of sensors, but that's not too important.  Be sure to click on the plot to see it full size (the link will open in a new window/tab)!

Wave_dispersion

We see exactly what theory predicts, long period waves coming in first, followed by progressively shorter period waves.  We also see that stations further out don't see the high frequency waves.  This is another phenomena in which the medium filters out high frequency waves over the travel.  We would say that the high frequency waves have been strongly attenuated.

That's all for now! Thank you for sticking with me through some interesting observations of predictions from math and physics!

Channel List:
C;GO01; --;BHZ;VERTICAL,CHUSMIZA, CHILE
C;GO01; --;BHE;EAST-WEST, CHUSMIZA, CHILE
C;GO01; --;BHN;NORTH-SOUTH, CHUSMIZA, CHILE
IU;LVC; 00;BHZ;VERTICAL, LIMON VERDE, CHILE
IU;LVC; 00;BHE;EAST-WEST, LIMON VERDE, CHILE
IU;LVC; 00;BHN;NORTH-SOUTH, LIMON VERDE, CHILE
C;GO02; --;BHZ;VERTICAL,MINA GUANACO, CHILE
C;GO02; --;BHE;EAST-WEST, MINA GUANACO, CHILE
C;GO02; --;BHN;NORTH-SOUTH, MINA GUANACO, CHILE

The Harlem Shake: Seismometer Records NY Building Explosion

Early this morning a large boom resounded throughout east Harlem as what is believed to be a gas explosion occurred at 1644 Park Avenue.  The five story building that was at that location, and its neighbor building, collapsed as a result of the explosion.  There were even reports of the shaking jamming doors in nearby structures.

The Lamont-Doherty observatory posted the following on Twitter, showing a plot of the event recorded on the Central Park station.  I haven't looked around to see if I can find it on any other stations to do a similar exercise as the Russian meteorite explosion, but I doubt there is enough data.

Screen Shot 2014-03-12 at 3.53.16 PM


As always, don't forget to follow the observatory (@LamontEarth) and me (@geo_leeman) on twitter!

KickSats - An Interview with Zac Manchester

Another AGU related post, but this time one that offers a future opportunity for participation! While walking around the vendors areas I approached a space company and began talking with a student at their booth. He turned out to be Zac Manchester, the main driver of the KickSat campaign. We chatted for a bit and I thought this would make a great post as well as letting you know about an upcoming opportunity to help telemeter data down.

Zac Manchester showing off an example satellite at the AGU Fall Meeting.

Zac Manchester showing off an example satellite at the AGU Fall Meeting.

You can find out some about the project from KickSat.net. After the meeting Zac was kind enough to answer some questions for the blog. There will be a future post as well where I'll share my personal ground station setup and then posts during reception of the data in Feburary. It's fun to see these tiny satellites that are just a printed circuit board with a solar cell and no battery. Amazing design and great use of a Texas Instruments microchip with a built in radio! Zac actually repurposed these chips as they are designed to be used in wireless key entry systems in cars. Fantastic!

What inspired you to start the KickSat program?
Mostly desperation. Our research group at Cornell has been working on
"ChipSat" scale spacecraft for a number of years and we got to a point
where we felt we were ready to actually fly some in space. We were
able to get a free launch through a NASA program called ELaNa, but we
still needed some money to build the flight hardware. KickStarter was
still pretty new at the time (2011), but I had heard of it through
some friends. After thinking it over a lot and not really having many
other options, we decided to go for it.

What was the most difficult challenge during the project?
The most difficult technical challenge was probably the communications
system. We're trying to simultaneously receive signals from over 100
tiny satellites, each with only about 10 mW of power, from 500 km
away, all on a very low budget.

How will the satellites be deployed and where can we find tracking data?
The Sprites will be deployed out of a 3U CubeSat "mothership" (called
KickSat), which is being launched on a SpaceX Falcon 9 in late
February or early March. The Sprites will be deployed 7 days after
launch vehicle separation and we will have tracking data available on
our website (kicksat.net).

When is launch?
Officially February 22, 2014, but that will likely be subject to delays. This is now set for March 16, 2014.  You can check for updates by looking for spacecraft "SpaceX CRS 3" on  SpaceFlight Now.

How long will the satellites be in orbit?
KickSat, the 3U CubeSat "mothership" will stay in orbit for a few
months, while the Sprites will reenter in a few days, probably less
than a week, after they are deployed.

How can educators and radio operators receive the data? How should be send in any data we receive?
We'd love to have participation from as many radio amateurs as
possible. Information on how to set up a ground station, receive
signals, and submit recorded data will be posted on kicksat.net in the
coming weeks.

That's it! Thank you for reading and be sure to check out any follow up posts.  I'll be setting up my ground station over the next week.

Passion - Are You Looking Forward to Friday or Monday?

Image: mashable.com

Image: mashable.com

Recently our department had Dr.Roel Snieder of the Colorado School of Mines over for a visit, colloquium talk, and a seminar.  Dr. Snieder has written multiple books, including one that is given to all first year graduate students in our department "The Art of Being a Scientist."  While I highly recommend this book, I wanted to write a post or two concerning some things Dr. Snieder said during his brown-bag seminar on the art of being a scientist.

One question that everyone in attendance wanted to know about was choosing your passion.  What is the niche that you want to fit into and work at during your career? This is something I often struggle with since I'm interested in a wide variety of questions.  It's easy to give lots of things a little thought, but choosing one or two topics to deeply address over an extended time is rather difficult!

Dr. Snieder related a story about working in Holland.  He wasn't very satisfied with where he was.  One day a colleague asked him a question that pushed him to change his situation: "Are you looking forward to Friday or Monday?"  The point isn't to make weekends miserable, but are you excited to come in on Monday and work on something you are passionate about.  If not, you probably are looking forward to the end of the week and are ready to get away.  Generally we don't run from our passion.

Deciding what your personal passion is depends on your background, experiences, etc and can change over time.  No matter what it is, there will be some boring and unpleasant activities.  For example, I'm passionate about my research, but sitting next to an experiment at 1AM waiting for it to finish isn't exactly exciting.  So to follow your passion you must first know what it is, which for someone like me involves making lots of lists, mind-maps, flow charts, and notes to store other ideas for future times.

Another component involves choosing who you work with.  In graduate school things are relatively flexible and collaborations can come from anywhere.  I really enjoy reaching out into other fields and trying to learn new perspectives on our data.  Almost daily I talk to professors in seismology, glaciology, engineering, or even water science to learn about new things going on in their fields (and read other literature).  It's common to see a connection or how to apply something from those fields in our work.  (Not to mention that nerds such as us love to talk shop.)  Passion is also important to convey to our students, a type of co-worker, especially with the loss of passion in undergraduate education.

In conclusion I'll ask a question that we were asked... Why are you here? Right now, in this room (or reading this post).  What are you passionate about?

Never Confuse Chip Pinouts Again!

chip_labels


UPDATE: John Meacham commented below letting us know that he has updated the package.  It can now be installed with it's new features by installing the packages I mention below and then:

>>  sudo apt-get install libfile-slurp-perl
>> apt-get install darcs
>> darcs get http://repetae.net/repos/clabel

This is a topic of interest to a rather limited group, but one well worth posting I believe.  Those who build electronic circuits regularly know the pain of constantly swapping back and forth between datasheets when trying to remember which pin of an integrated circuit does what.  It's different for almost every chip and can slow down prototyping when you're on the fly or don't have internet access.  John Meacham over at Not A Number  decided to remedy this problem after noticing that 6mm tape from a Brother label printer fit perfectly on top of his chips!

You can find his Perl script over here, but I wanted to elaborate on how to get it working and my experience with it thus far.  I ended up running the code on an Ubuntu virtual machine with Parallels.  I had lots of problems getting the libraries needed to run on Mac OSX, but the Linux install took just a few minutes.

First, download and unzip the files from John's website.  There is a read-me telling you how to run the scripts, but we don't get there just yet.  First we must install the GD module for pearl and the cups-bsd for printing utilities.  To do so, follow these two commands:

>>  sudo apt-get install libgd-gd2-perl
>>  sudo apt-get install cups-bsd

Since we're going to make our own custom labels as well, we'll need two more packages.  The barcode and YAML packs.  Just run:

>>  sudo apt-get install libconfig-yaml-perl
>>  sudo apt-get install libgd-barcode-perl

Okay, now we need to install our printer.  Just plug in your Brother printer and follow the normal steps to install it just like any other device.  Ubuntu automatically found the drivers for me and set it up.

Next I just printed out a 555 timer IC label to get started.  My printer is called labelprinter, so the command was:

>>./print_png.prl -Plabelprinter -w 6 out/555.png

The label printed out! Now I did notice that sometimes there is some garbage at the beginning of the label, but I trimmed that off with scissors anyway.  I do wish there was a way to prevent the printer from feeding and cutting after every label though, it wastes some label tape.  There may be a way to modify the scripts.

While there are a few included labels, you'll want to make your own eventually.  This is done with YAML.  Let's make a label for the 74LVC244A octal buffer/driver.  First we'll look at the datasheet (here) and get the pinout.  Below is the screen-shot of the datasheet spec.

pinout

We must write a YAML file to describe this pinout:

74hc165:
name: 74hc165 - PISO register
pins:
- /PL
- CP
- D4
- D5
- D6
- D7
- /Q7
- GND
- Q7
- DS
- D0
- D1
- D2
- D3
- /CE
- Vcc

The / before the pin will add the overbar to indicate the active state of the pin.  The YAML code is added to the file chips.yaml and we run the script:

>>   ./chip_label.prl -c 74LVC244A

We now have a new label to print and affix to our chips! 74lvc244a

There we go! Sorry this was a bit lengthy and technical, but this tool is incredibly useful for anyone involved with prototyping!

Remembering Challenger: 28 Years

722342main_challenger_full_full

It's been 28 years since the Space Shuttle Challenger (STS-51-L) broke apart just over a minute after launch.  Disasters like Challenger and Columbia remind us that space exploration really is a complicated and risky business.  Should we stop because something is risky? Absolutely not, but we should also not let such things become routine and fall out of the public view.

Remembering the Challenger Crew

The NASA family lost seven of its own on the morning of Jan. 28, 1986, when a booster engine failed, causing the Shuttle Challenger to break apart just 73 seconds after launch.

In this photo from Jan. 9, 1986, the Challenger crew takes a break during countdown training at NASA's Kennedy Space Center. Left to right are Teacher-in-Space payload specialist Sharon Christa McAuliffe; payload specialist Gregory Jarvis; and astronauts Judith A. Resnik, mission specialist; Francis R. (Dick) Scobee, mission commander; Ronald E. McNair, mission specialist; Mike J. Smith, pilot; and Ellison S. Onizuka, mission specialist.

Via NASA