Fun Paper Fridays

Image: phdcomics.com

Image: phdcomics.com

In my last post about why I think the expert generalist is crucial in today's highly inter-related world, I mentioned a practice that I've adopted of "Fun Paper Fridays."  Today I want to briefly describe fun paper fridays and invite you to participate.

The Routine
Every friday I go to a coffee shop first thing in the morning and commence my weekly review.  During this time I check the status of projects, emails, etc and make sure that things are not slipping through the cracks.  Those of you familiar with David Allen's Getting Things Done will recognize this.  In addition to reviewing my schedule, I added a self expansion project.

Each week I pick out a paper that isn't directly related to my research and read it.  The paper can be serious, just not about my work (ex: Viking Lander 1 and 2 revisited: The characterization and detection of Martian dust devils), or it can be a completely fun topic (ex: How to construct the perfect sandcastle).  That's it! Just read a paper, no notes unless you want.  You'll be surprised when in some situation you'll recall a fact, method, or comment from one of these papers and be able to apply it to a completely different scenario.

Join Me
I hope that you'll join me in this quest of broadening your knowledge horizons. If you're not involved with science, that's no problem. Just read something that you normally wouldn't. Maybe it's the Art & Culture section of a newspaper or an Article from a popular science magazine. Every Friday I'll be posting the paper I'm reading on Facebook and Twitter. Please join me and use the tag: #FunPaperFriday.

The Rise of the "Expert Generalist"

Swiss Army Knife

Image: http://www.nature.com/

I've always appreciated the value of having a very broad range of knowledge, but recently I've observed many cases that reminded me how important it is. Growing up I worked on tractors and engines and rebuilt many mechanical devices. Later I learned how to machine metal and weld. As it turned out all of those skills and the knowledge gained have been incredibly helpful in graduate school since I happen to work with large hydraulic and mechanical systems that have all custom parts!

It turns out that as our fields all become more connected through increased interdisciplinary collaboration we all must become an "expert generalist". As geoscientists, we are always faced with writing new code, logging new types of data, or becoming GIS experts. Knowing just a little about many fields opens up entirely new ways that you can start to approach a problem. If that approach looks promising then you can become an "expert" or consult with one, but this novel approach would likely have remained hidden without any knowledge of the field.

The main message of the 99u article (linked at the bottom) is:

One thing that separates the great innovators from everyone else is that they seem to know a lot about a wide variety of topics. They are expert generalists. Their wide knowledge base supports their creativity.

As it turns out, there are two personality traits that are key for expert generalists: Openness to Experience and Need for Cognition.

Let's take a look at the two qualities mentioned and see how we can apply them.

Openness to Experience
Creating new content and ideas is really just a merging of concepts that we already know into a complete framework or mental model of examining the problem at hand. That means that we need a large body of knowledge to draw from. While this sounds like a good idea in practice, it isn't easy to do. We have to be open to meeting with people and learning about concepts that may seem completely irrelevant right now. We have to read papers that are out of our fields and realize that we all work on the same field, just different parts of it.

In an effort to broaden my knowledge I've added a component to my Friday review process: the fun paper reading. Every Friday morning while organizing the end of the week and setting up the next week I find a paper that is out of my research area and read it. These papers range from the geometry of parallel parking, to lightning science, to the fluid dynamics involved with sinking bubbles in a pint of Guinness.

Need for Cognition
The second characteristic described is one that most of us already have. It is the drive to be that person always asking "why?". When driving down the road on a hot summer day and you see the road "shimmer" do you keep going or wonder what is happening? Most of us would go look it up and read all about autoconvection. While some may call this going down the Wikipedia rabbit hole, it is essential to build time into our schedules to allow this kind of free exploration.

What can we as geoscientists take from all of this? We should always be broadening our horizons, making many connections with people in all areas, and not forget that we are all working on the same problem... understanding our world.

99u: Picasso Kepler and the Benefits of Being an Expert Generalist

NSF Graduate Fellowships - Some Thoughts and Tips

While this post may not appeal to the general audience, I thought it would be useful because it is an important topic to any senior undergraduate or first/second year graduate student. Today I want to briefly tell you my experience applying for the NSF Graduate Fellowship in 2012 and 2013.  I learned a lot in the process of applying for this prestigious fellowship and hope that I can pass some of that knowledge down!

Application 2012 - No award

My first year at Penn State, I applied with the traditional three documents of research statement, personal statement, and research proposal.  I sought the edits of those who had been awarded the fellowship in the past and thought I had a convincing packet assembled.  After reading, re-reading, and re-reading, it was time to submit.  I submitted the application, then made the mistake of reading over it again a week later and finding things I wished I had changed.  Months went by and seemed to drag on until the award announcements came.  I was not selected for an award.  While I was of course disappointed, it was time to kick it into high gear and make an even better application for my next (and final) try.

Application 2013 - Award Offered

For my second application I had lots of debates with myself.  Should I change my research proposal topic? Were my personal and research statements too similar? How can I improve the writing? Should I include figures?

To settle these debates, I turned to the wealth of online information that I hadn't sought out the previous year.  I talked with those who had received the award, I read funded research proposals from various professors and researchers, and I went down to the bare bones of the document.  While I'll discuss specific tips below, I'll just say that I started earlier, took more pauses between writing sprints, and sought more people for reading.

My tips

In writing two proposals, I learned a lot about how to effectively structure my research and emphasize the specific angle of attack I'll take on a research question and why it's different.  Here are some things I found to be helpful:

MY PROCESS

  • Start Early - Think it's too soon? Wrong! You need lots of time to organize your thoughts, revise, rewrite, and think about your application.
  • Read the Announcement - Print out the announcement document and read it critically.  You can look at the 2014 announcement here.  Don't just read it, mark on it. Highlight what they specifically are looking for, underline the buzzwords and key phrases of the call.  Also, draw a big box around the application deadline and then plan to beat it by one week.  Why? Computer problems, server crashes, unexpected medical emergency, etc.  You don't know what could happen, so make sure that your application gets in early!
  • Make a FastLane Account - Go to the online application and make an account.  Get familiar with FastLane, you'll use it for most all of your NSF proposals unless they change sometime in the future! Look at the application.  Go ahead and fill in the boxes with your name, address, etc.  Now you can mark down progress on your application and have momentum to move forward with the hard work.
  • Write the Requirements for your statements out on Paper - This one is huge.   In the application, pull up the research proposal and background/personal statement "prompts."  Print them, read them many times, and finally write them down on a notepad.  Break the prompt up into small chunks and then think about how to answer each piece.  Don't worry about flow, just think.
  • Brain Dump - Now write each one of the pieces of the question on the top of a page and begin to outline the points that you will make to address it.  Again, don't worry about order or how many points you have! Just write and write and write.
  • Organize into an Outline - Take a break, a day or so, then come back to your brain dump afresh and think about how you can piece it together into one coherent story - your story.  The story of a proposed research project and the story of you and your life in science.
  • Make a Draft - It does not need to be pretty, organized, the right length, etc.  Just get complete sentences onto the page.  Do this on paper or in a plain text editor.  Don't worry about formatting, length, spacing, margins... Those are things for later in a word processor.  I like using Textastic, Sublime, TextWrangler, or Editorial.
  • Read it and Have Lots of People Read it - Don't be afraid to ask everyone to read and edit your document.  Do not ask them to re-write the document for you! Remember this needs to come from your brain, but it is fine to gather suggestions and comments.  I also went to the graduate writing center and had some great suggestions from the coach there.  As scientists, we are not used to marketing ourselves and we often think the need for our research is obvious.... That won't work.
  • Talk to Your Reference Writers - You'll need letters of reference.  These take lots of time to write, so make things easy on your mentors and writers.  They have done a lot for you and are about to help out again.  I went through the application, figured out what I thought would be important to my application reviewers and then composed an email to my writers (see below).
  • Do NOT Cram - Whitespace is a dear friend to someone who is reading many pages of documents... like your judges.  Don't pack every single word you possibly can into the pages.  Economy of words shows great thought and restraint when writing.  Edit down over and over.  Leave white space between paragraphs.  If you use figures, text wrapping is a fine way to reclaim space, but leave a sufficient margin.  Look at books and other professionally formatted documents for inspiration.

MY APPLICATIONS FROM BOTH YEARS

Here are links to documents I produced for both applications, of course don't plagiarize, but hopefully they are helpful!

NSF 2012 (No Award)
Personal Statement | Previous Research | Proposed Research

NSF 2013 (Award Offered)
Research Statement | Personal & Background Statement |
Letter to Reference Writers

LINKS

There are several other helpful webpages out about the application process.  Remember, what you read on the program site is the final word, but these pages have more useful tips.

GRFP Essay Insights (Missouri)
Alex Lang's Website
Jennifer Wang's Website
Reid Berdanier's Website
The Official NSF GRFP Page
NSF PAPP Guide Book

Remember, if you don't get the award, take the feedback you get and start improving! Try, try again and don't be afraid to seek help from mentors, writers, friends, and family.  Please leave any useful comments below. Best of luck!

Getting Up and Running with a 3D Printer

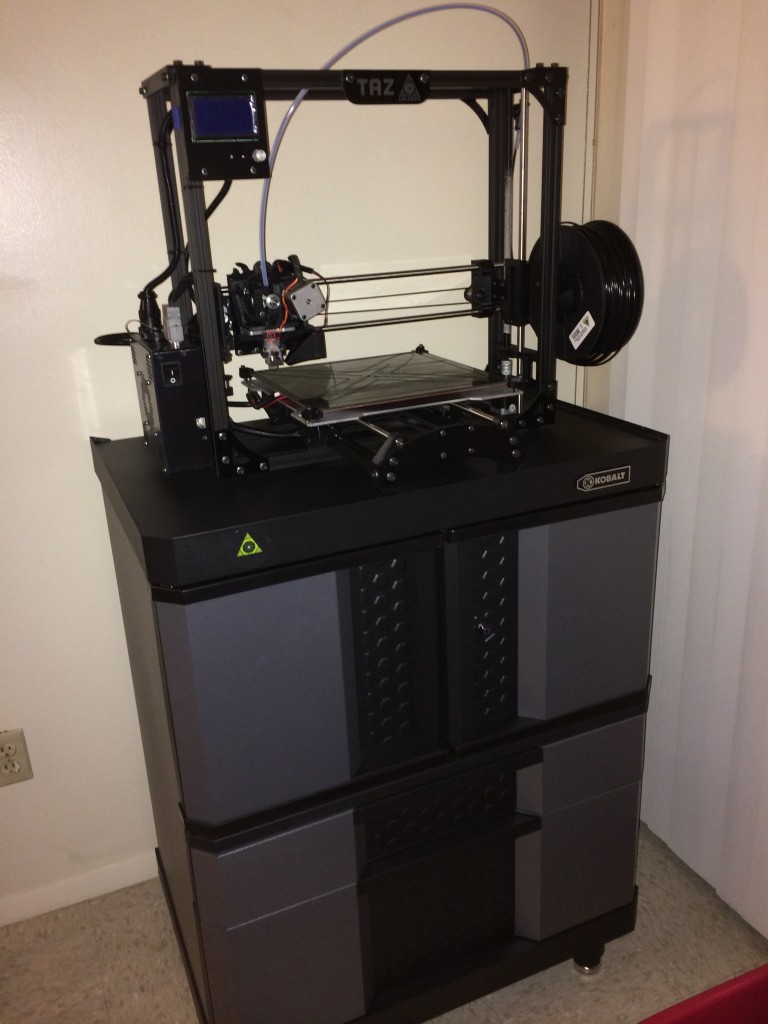
I recently received some money to purchase a 3D printer to aid my laboratory experiments. I thought that it would be good to share how I decided on the printer that I did and how hard/easy it was to setup. Currently I've only run a few simple test prints, but will be printing some mounting equipment for laboratory experiments within a few weeks.

2014-08-16 05.08.30

Choosing a Printer

When choosing a printer, there are many factors to consider. The consumer 3D printer movement is still very young, so there are many different designs available that require different amounts of tinkering to work and have vastly different capabilities. To help decide, I made a few requirements and decision points :

1. I must be able to print something that is at least 8"x8"x8". Print area is an important consideration and is one of the biggest influences on cost. With this print size I can make most prototypes, brackets, etc that we need. Larger parts can always be printed in sections and joined, but it's not the strongest or easiest thing to do.
2. Print material and method. There are printers that can print in many types of plastic and even in wood. Some printers fuse plastic in layers in an "addictive manufacturing" process. Others can fuse a liquid into a plastic with a process referred to as stereo lithography. Most consumer level machines with a large print area are the type that extrude plastic. There is a large matrix of advantages and disadvantages, but we will just leave it at this for now.
3. The final factor I considered is the development of the machine. Informally this is the "tinker factor." How much are you willing to modify and experiment with the machine to get increased versatility vs. how much do you want a machine that is a push button that just works? I've always been the tinkering type but there is a balance. Some more experimental and low cost machines are not as reliable as I would prefer, but something that is fully developed like the MakerBot line doesn't leave as much versatility. The other portion is the licensing of the software and hardware. I've always been a proponent of the free and open source movement. It's how we are going to advance science and technology. Companies like MakerBot are not fully open source and that just doesn't sit well as it prevents the community from fixing problems in a piece of equipment that was rather expensive.

With all of those considerations and lots of research, I decided on the Taz 4 printer by Lulzbot. You can purchase the printer from Amazon, but I decided to purchase through Sparkfun Electronics since they are a small(ish) business that really supports education and the maker movement. I ordered the printer within a few hours of passing my comprehensive exams and it was on the way!

Setting up the printer

I received the printer and followed all of the setup instructions. This involved assembling the axes and removing the packing protection. I've never done this before, but overall it was very straightforward and took about 45 minutes. The next steps were what made me nervous.

To get quality prints the printer surface must be level with relation to the print head track. There are various end stops and leveling screws to adjust. Using a piece of printer paper as a gap gauge, I just followed the instructions and had the print bed leveled in about 20 minutes. There is also a test print pattern that prints two layers of plastic around the base plate to let you make sure the level is right on. Everything must be kept clean and adjusted as with any precision bit of gear, but overall I was impressed with the design.

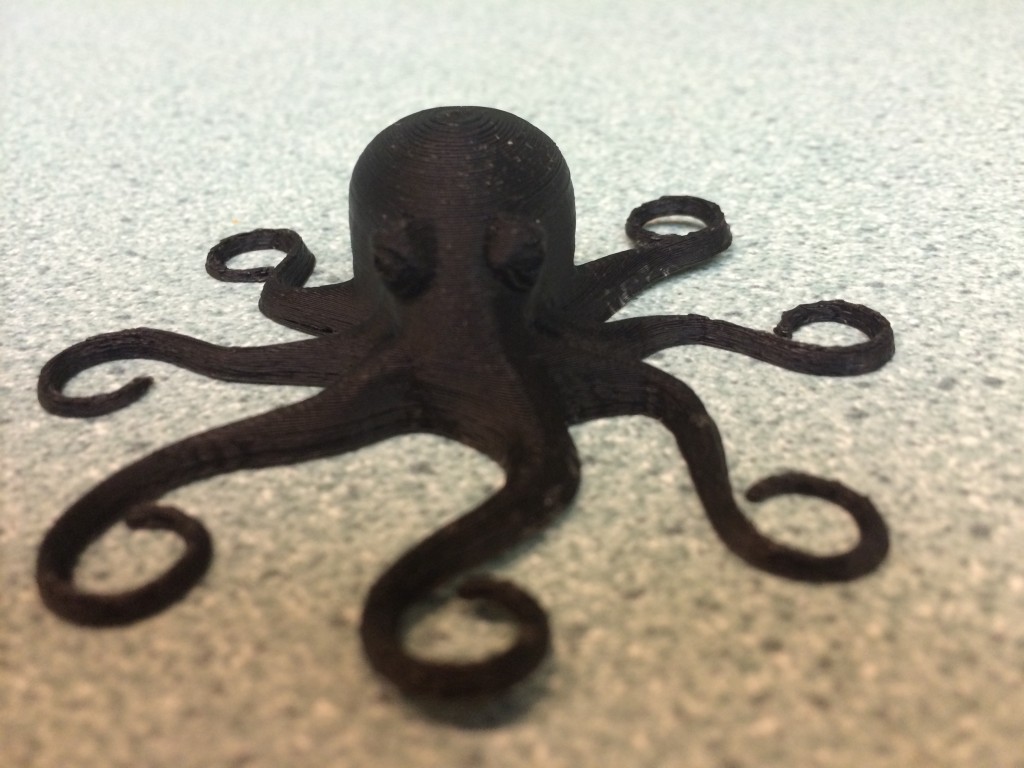
The printer ships with an octopus test print that was my first object. I loaded up the file and hit print. The printer ran for about an hour and at the end I had the print shown below!

2014-08-14 22.01.49

What's Next

I've got some plans for what to print next. Currently I'm designing some new brackets to hold sensors in place during experiments and a few new parts like shields and pulleys to improve the quality of some of our demonstration apparatuses in the lab. I'm sure some of the results will end up as their own blog posts, but you can always see what's new by following me on Twitter (@geo_leeman). I also would like to thank Hess energy and Shell energy for their support of various aspects of these projects and of course the National Science Foundation for supporting me and many aspects of my lab research. Everything I've said is of course my own opinion and does not reflect the views of any of those funding organizations. Next post we will likely return to more general topics like seeing trends in data or go back and look at more Doppler radar experiments.

Update!

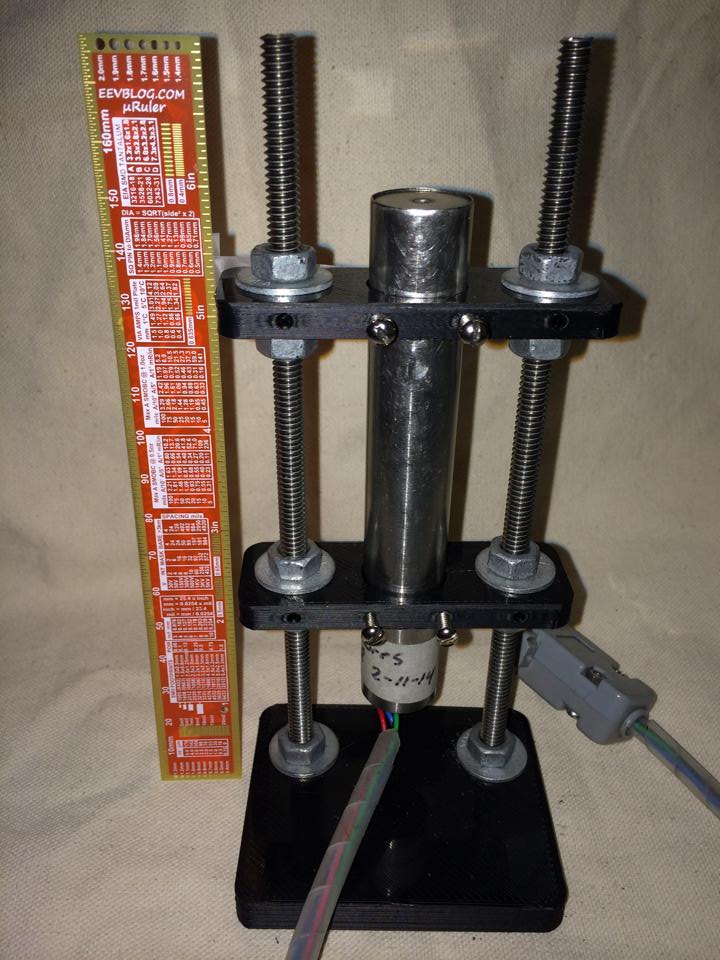
I was able to print my first laboratory parts, a set of brackets to make a magnetic holder for a displacement transducer.  I will be posting the cad files to my github account under an open license.

10347538_10152638131370731_7763062347780746327_n

Napa Valley Earthquake - Aug. 24, 2014

As I'm sure you've heard/read by now, there was a moderate earthquake in the Napa Valley region of California earlier today. At 3:20 AM a fault ruptured producing a magnitude 6.0, the largest for that area since 1989. So far the damage pictures I've seen coming out of the area show moderate to severe structure damage on older structures and lots of toppled book shelves and wine racks.

This earthquake has nearly a textbook slip pattern or focal mechanism. The plot below is often called the "beach ball plot" and is a way to represent how the fault moved. Without going into the details of how we construct a plot like this, we can simply interpret what we see. This plot shows a traditional strike-slip motion. This means that the plates slid past each other laterally with little motion up and down on the fault. This doesn't mean that there will be no up and down motion as the seismic waves propagate though!

Focal Mechanism Solution (usgs.gov)

Focal Mechanism Solution (usgs.gov)

We can also interpret from this beach ball that the strike-slip motion was right-lateral. If we were standing out in the ocean looking towards the other side of the fault inland California, we would see things shift to the right. This makes sense with the tectonics there as the pacific plate is grinding northwest past the North American plate. The locked plates bend and deform storing elastic strain energy, then finally fail, snapping into a state of lower stress. I've shown this elastic property of rocks before, but we have yet to really discuss the earthquake cycle in detail. Maybe one day soon I'll do some demonstrations about that though!

The final piece of the earthquake story I want to show you is a movie of the ground motion experienced at a seismometer in the Marconi Conference Center, Marshall, CA. This video shows what we would see if we could track a piece of the ground in 3D and watch it's motion as different seismic waves go by. There is lots of information in this plot, but for now just notice the large amounts of motion!  This is three minutes of data with 4 ground positions recorded per second in real time, then sped up.

As always, if you do happen to live in an earthquake prone area, be sure to have a plan, have an emergency kit, and always be prepared for any natural disaster!


Mythbusting: Cooling a Drink with a Wet Paper Towel

While reading one of the many pages claiming to have "15 Amazing Life Hacks" or something similar, I found a claim about quickly cooling a drink that deserved some investigation.  The post claimed that to quickly cool your favorite drink you should wrap the bottle/can in a wet paper towel and put it in the freezer.  Supposedly this would quickly cool the drink, faster than just the freezer.  My guess is that the thought process says evaporative cooling is the culprit.  This is why we sweat, evaporating water does indeed cool the surface.  Would water evaporate into the cold, but dry freezer air? Below we'll look at a couple of experiments and decide if this idea works!

We will attack this problem with two approaches.  First I'll use two identical pint glasses filled with water and some temperature sensors, then we'll actually put glass bottles in and measure just the end result.  While the myth concerns bottles, I want to be able to monitor the temperature during the cooling cycle without opening the bottles.  For that we'll use the pint glasses.  

First I had to build the temperature sensors.  The sensors are thermistors from DigiKey since they are cheap and relatively accurate as well.  To make them fluid safe, I attached some three-lead wire and encapsulated the connections with hot-glue.  The entire assembly was then sealed up with heat-shrink tubing.  I modified code from an Adafruit tutorial on thermistors and calibrated the setup.  

To make sure that both sensors had a similar response time, we need to do a simple control test.  I placed both probes in a mug of hot water right beside each other.  We would expect to see the same cooling at points so close together, so any offset between the two should be constant.  We also expect the cooling to follow a logarithmic pattern.  This is because the rate of heat transfer is proportion to the temperature difference between the water and the environment (totally ignoring the mug and any radiative/convective transfer).  So when the water is much hotter than the air, it will cool quickly, but when it's only slightly hotter than the air it will take much longer to cool the same amount.  
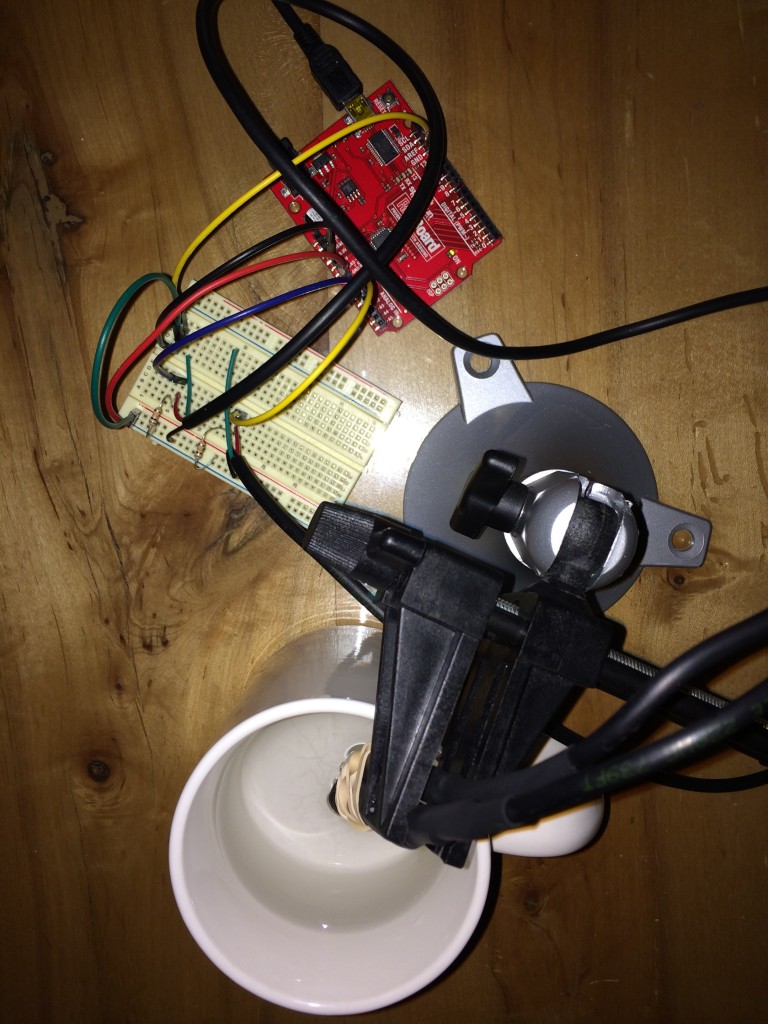
Mug Cooling Photo

Plotting the data, we see exactly the expected result.  Both sensors quickly rise to the water temperature, then the water cools over a couple of hours.  The noisy segments of data about 0.25 hrs, 0.75 hrs, and 1.75 hrs in are likely interference from the building air conditioning system.  
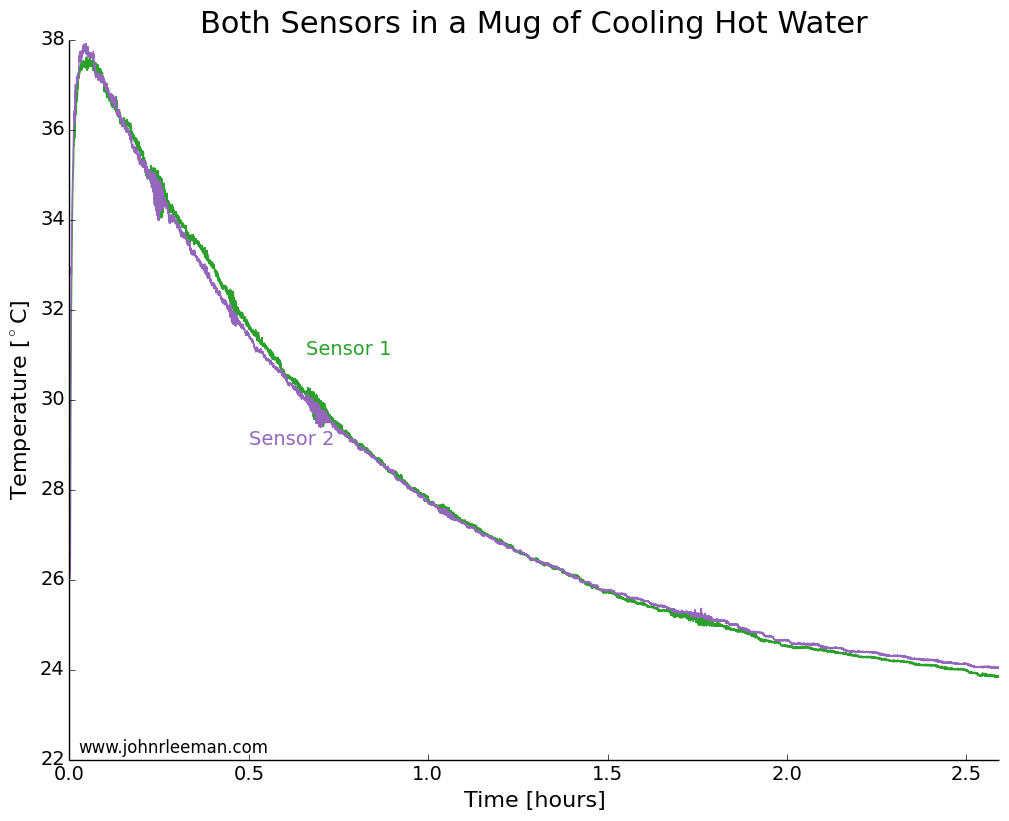
CoolingWater_AbsoluteTemps

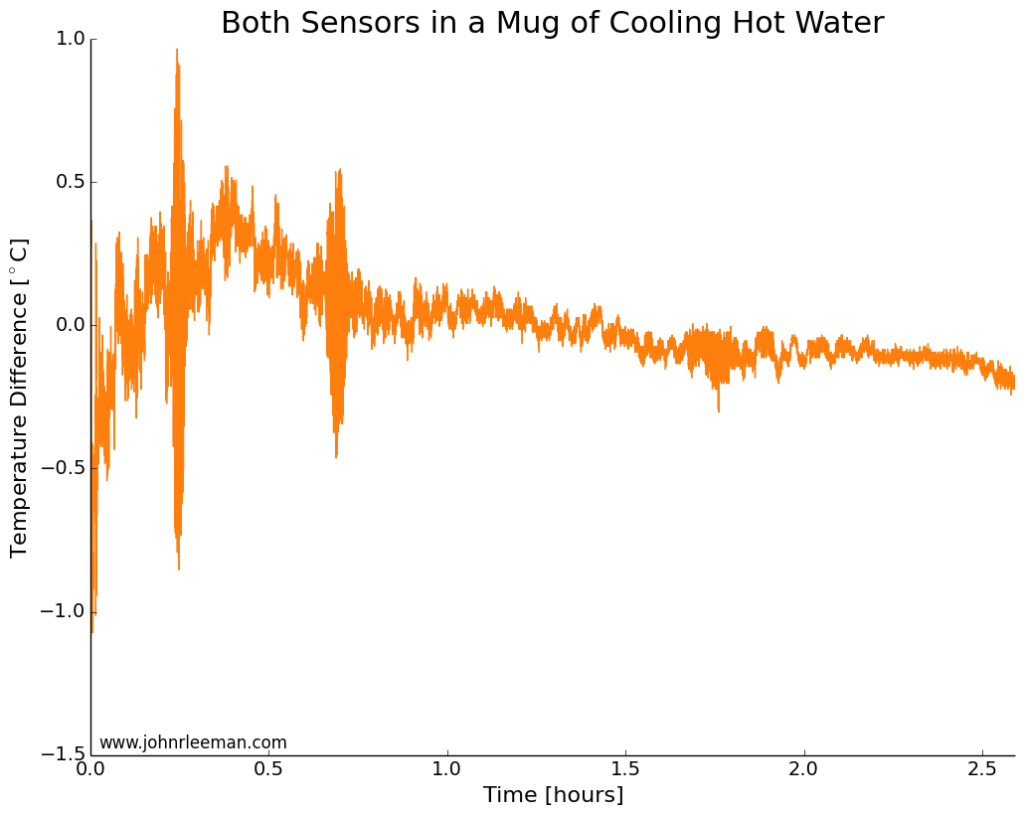
If we plot the temperature difference between the sensors it should be constant since they are sensing the same thing.  These probes look to be about dead on after calibration.  Other than the noisy segment of data, they are always within 0.5 degrees of each other.  Now we can move on to the freezer test.
CoolingWater_TempDifference

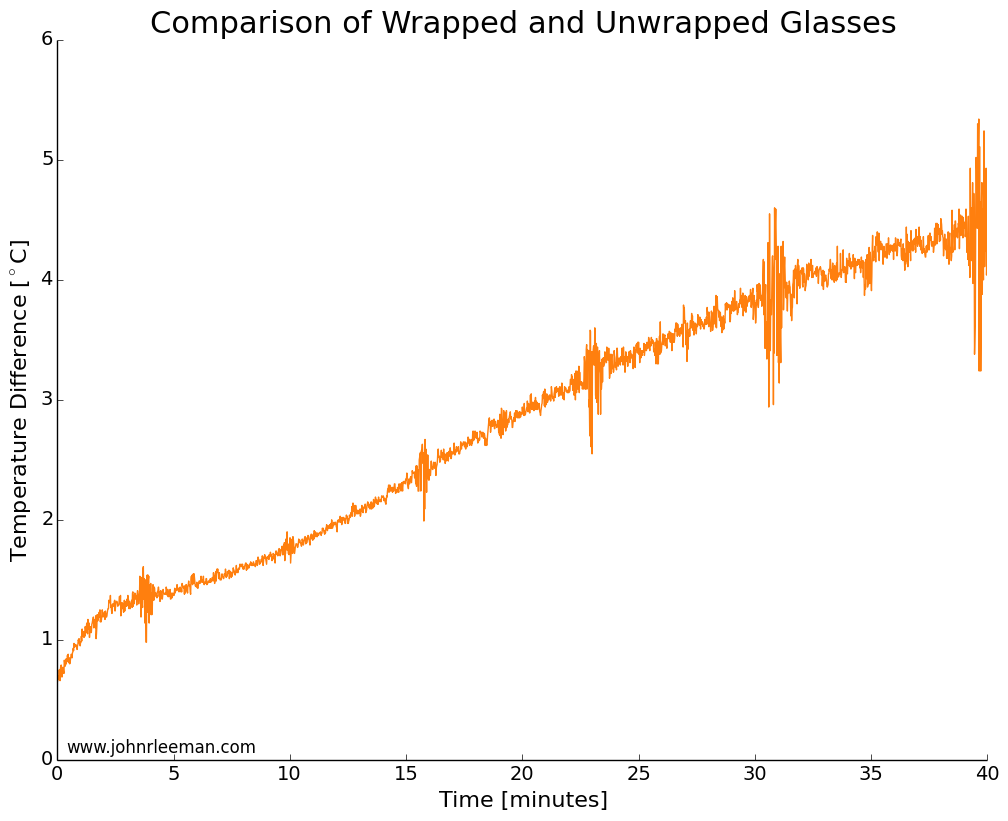
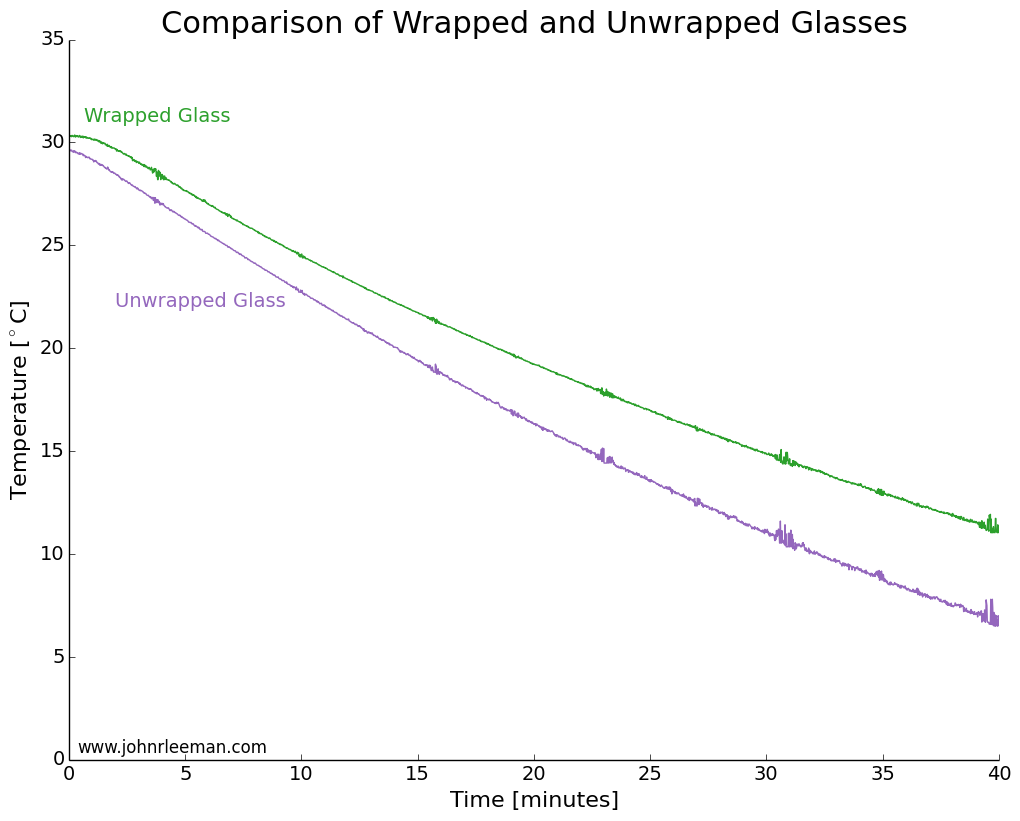
I used two identical pint glasses and made thermocouple supports with cardboard.  One glass was wrapped in tap water damped paper towel, the other left as a control.  Both were inserted into the freezer at the same time and the temperature monitored.  The water was initially the same temperature, but the readings quickly diverged.  The noisy data segments reappear at fixed intervals suggesting that the freezer was turning on and off.  The temperature difference between the sensors grew very quickly, meaning that the wrapped glass was cooling more slowly than the unwrapped glass.  This is the opposite of the myth! 
FreezingWater_AbsoluteTemps


FreezingWater_TempDifference

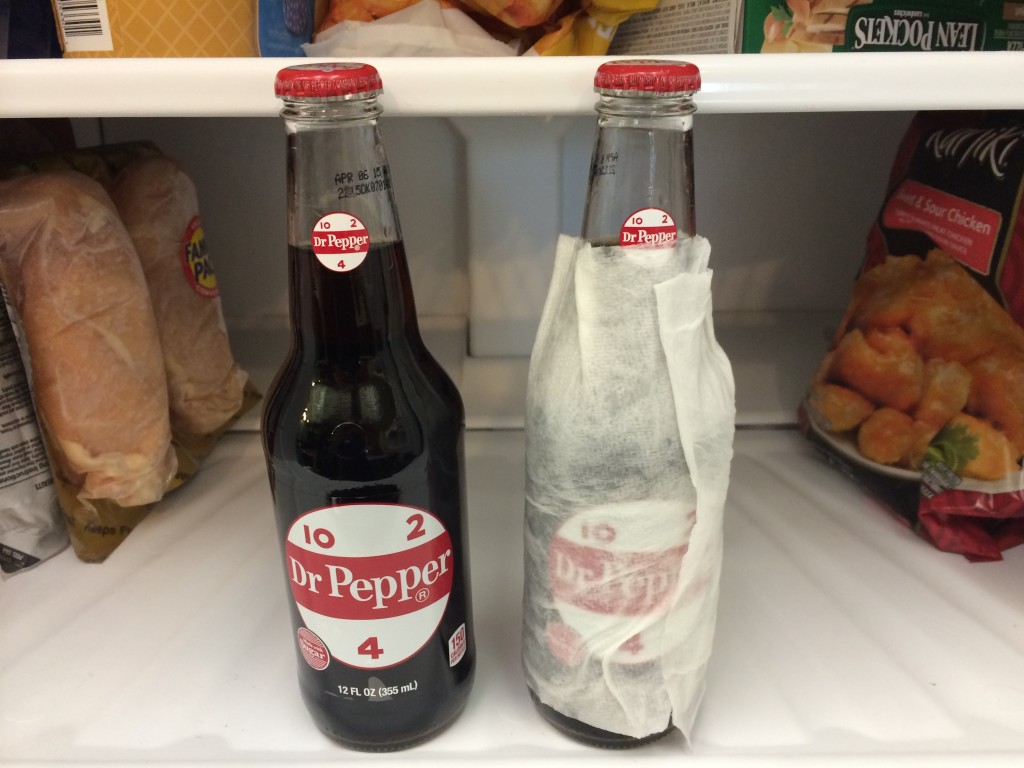
Next I placed two identical, room temperature bottles of soda in the freezer, again with one wrapped and one as a control.  After 30 minutes in the freezer, the results showed that the bottles and their contents were practically identical in temperature.  The wrapped bottle was slightly warmer, but it was within the resolution of the instruments (thermocouple and IR sensor).  I did this test multiple times and always got temperatures within 1 degree of each other, but not consistently favoring one bottle.

So what's happening here? Well, I think that the damp paper towel is actually acting as a jacket for the beverage.  Much like covering yourself when it's cold outside, the damp paper towel must be cooled, then the beverage can cool.  Adding that extra thermal mass and extra layer for the heat to diffuse through.  To provide another test of that hypothesis I again tested bottles with a control and a foam drink cooler around the base.  The foam cooler did indeed slow the cooling, the bottle being several degrees warmer than the control.
2014-08-13 17.56.28

The last question is why did the test with the glasses show such a pronounced difference, but the bottle test show no difference? My best guess is that the pint glass was totally wrapped vertically and that bottle had the neck exposed still.  Another difference could be the thickness of the towel layer and the water content of the towels.  

The Conclusion: BUSTED! Depending on how you wrap the paper towel it will either have no effect or slow down the cooling of your favorite drink.  

Let me know any other myths I should test! You can also keep up to date with projects and future posts by following me on twitter (@geo_leeman).

Arduino Code:

// which analog pin to connect
#define THERMISTOR1PIN A0
#define THERMISTOR2PIN A1
// resistance at 25 degrees C
#define THERMISTORNOMINAL 10000
// temp. for nominal resistance (almost always 25 C)
#define TEMPERATURENOMINAL 25
// how many samples to take and average, more takes longer
// but is more 'smooth'
#define NUMSAMPLES 15
// The beta coefficient of the thermistor (usually 3000-4000)
#define BCOEFFICIENT 3950
// the value of the 'other' resistor
#define SERIESRESISTOR1 9760
#define SERIESRESISTOR2 9790

int samples1[NUMSAMPLES];
int samples2[NUMSAMPLES];

void setup(void) {
Serial.begin(9600);
analogReference(EXTERNAL);
}

void loop(void) {
uint8_t i;
float average1;
float average2;

// take N samples in a row, with a slight delay
for (i=0; i< NUMSAMPLES; i++) {
samples1[i] = analogRead(THERMISTOR1PIN);
samples2[i] = analogRead(THERMISTOR2PIN);
delay(10);
}

// average all the samples out
average1 = 0;
average2 = 0;
for (i=0; i< NUMSAMPLES; i++) {
average1 += samples1[i];
average2 += samples2[i];
}
average1 /= NUMSAMPLES;
average2 /= NUMSAMPLES;

//Serial.print("Average analog reading ");
//Serial.println(average);

// convert the value to resistance
average1 = 1023 / average1 - 1;
average1 = SERIESRESISTOR1 / average1;

average2 = 1023 / average2 - 1;
average2 = SERIESRESISTOR2 / average2;
//Serial.print("Thermistor resistance ");
Serial.print(average1);
Serial.print(',');
Serial.print(average2);
Serial.print(',');

float steinhart;
steinhart = average1 / THERMISTORNOMINAL; // (R/Ro)
steinhart = log(steinhart); // ln(R/Ro)
steinhart /= BCOEFFICIENT; // 1/B * ln(R/Ro)
steinhart += 1.0 / (TEMPERATURENOMINAL + 273.15); // + (1/To)
steinhart = 1.0 / steinhart; // Invert
steinhart -= 273.15; // convert to C

Serial.print(steinhart);
Serial.print(',');

steinhart = average2 / THERMISTORNOMINAL; // (R/Ro)
steinhart = log(steinhart); // ln(R/Ro)
steinhart /= BCOEFFICIENT; // 1/B * ln(R/Ro)
steinhart += 1.0 / (TEMPERATURENOMINAL + 273.15); // + (1/To)
steinhart = 1.0 / steinhart; // Invert
steinhart -= 273.15; // convert to C(steinhart);

Serial.println(steinhart);
//Serial.println(" *C");

delay(1000);
}

Are Rocks like Springs? A Video Demonstration

Today I was getting a demo in the lab ready for a tour group and decided to try shooting a quick, unscripted bit on rocks as springs.  There are a few generalized statements in here, but overall it is a first try at a public education video.  Comments welcome!

Exploring Scientific Computing at SciPy 2014

Texas Campus

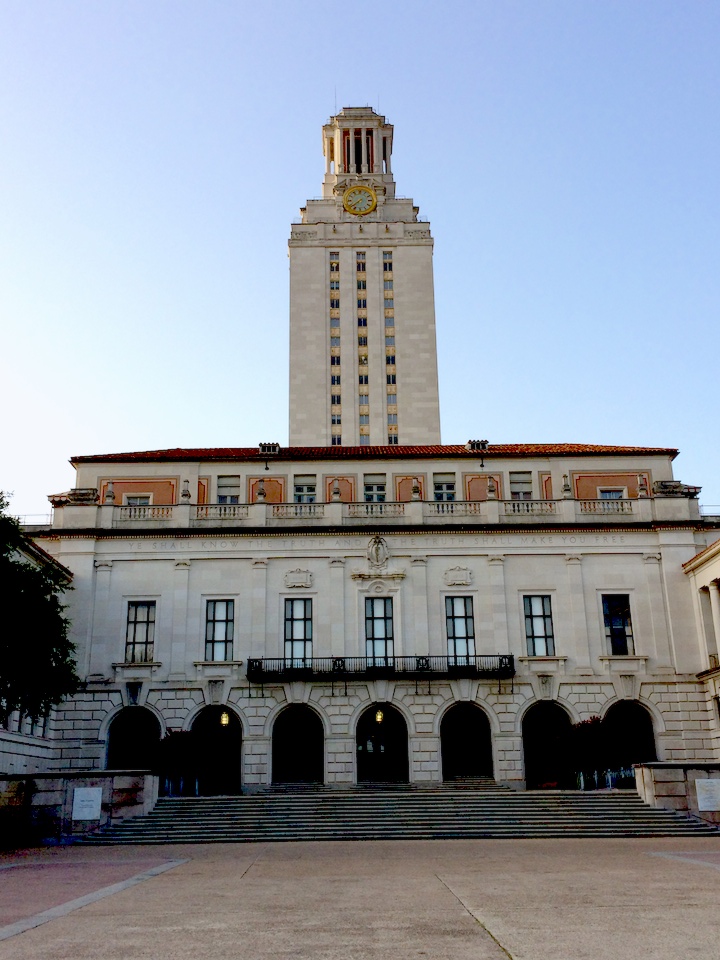
This past week I've been in Austin, TX attending SciPy 2014, the scientific Python conference.  I came in 2010 for the first time, but hadn't been able to make it back again until this year.  I love this conference because it gives me the chance to step away from work on my PhD and distractions of hobby projections to focus on keeping up with the world of scientific computing with Python.  I try to walk the fine line between being a researcher, engineer, and programmer everyday.  That means that it is easy to fall behind the state of the art in any one of those, and conferences like this are my way to getting a chance to learn from the best.

SciPy consists of tutorials, the conference, and sprints:

The first two days were tutorials in which I got to learn about using interactive widgets in iPython notebooks, reproducible science, image processing, and Bayesian analysis.  I see lots of things that I can apply in my research and teaching workflows!  Interactive notebooks are one of the last things that I was wishing for from the Mathematica notebooks.

The next three days were talks in which we got to see the newest software developments and creative applications of Python to scientific problems.  I, of course, gravitated to the geophysics oriented talks and even ran into some people with common connections.  It was during the conference that I gave my poster presentation.  I knew that the poster focused more on the application of Python to earthquake science than any earth-shaking (pun-intended) software development.  There were a few on the software side that wondered why I was there (as expected), but the poster was generally very well received.  Again I had several chance encounters with people from Google and other companies that had similar backgrounds or were just very interested in earthquakes!

The final two days (I'm writing this on the last day) were sprints.  These are large pushes to further develop the software while a critical mass of experts are in one location.  I'm still new enough to these massive open-source projections (on the development side at least) that I wasn't incredibly useful, but the reception of the developers was great!  Everyone was excited if you wanted to help and would spend as much time as needed to get you up and running.  During the sprints I've been following a fix for an issue that has recently caused problems in my plotting.  I also fixed a tiny issue (with help) and had my first pull request accepted.  For software people these are tiny steps, but for someone coming from just developing in-house purpose-designed tools.... it was an hit of the open-source collaboration drug.

Lastly, I worked on a project of my own during the evenings.  During the 2010 conference I worked with a friend to make a filter remove the annoying vuvuzela sound from the World Cup audio.  This year I've been making a fun earthquake visualization tool.  You'll be seeing it here on the blog, and may have already seen it if you follow me on twitter.  I learned a lot during this year's SciPy 2014, got to spend time with other alums of OU Meteorology, and meet some new folks.  Next on the blog we'll be back to some radar or maybe a quick earthquake discussion!

Doppler Radar at Home: Experiments with a CW Radar Part 1

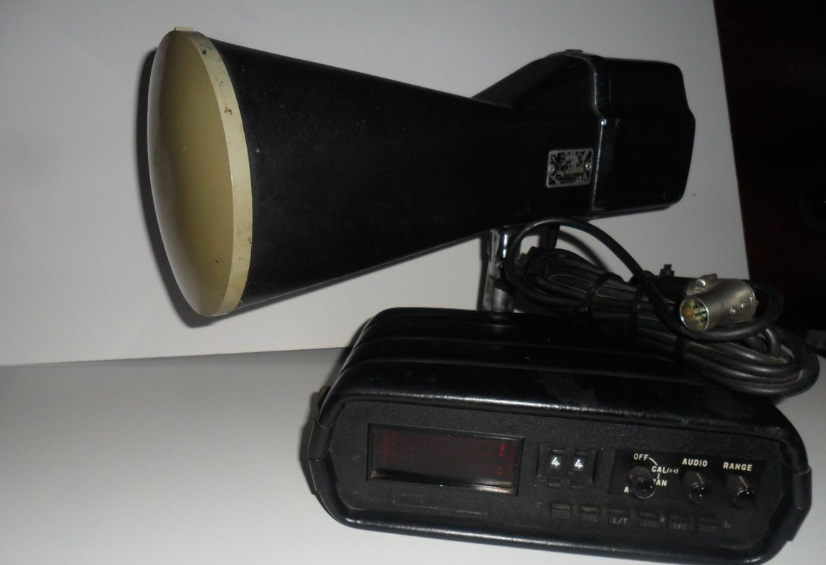
When you hear "radar", you probably think of weather radar and a policeman writing a ticket.  In reality there are many kinds of radar used for everything from detecting when to open automatic doors at shops to imaging cracks in concrete foundations.  I've always found radar and radar data fascinating.  Some time back I saw Dr. Gregory Charvat modify an old police radar on YouTube and look at the resulting signal.  I happened to see that model of radar (a 1970's Kustom Electronics) go by on EBay and managed to buy it.  I'm going to present several experiments with the radar over a few posts.  If you want to learn more about radar and the different types of radar I highly recommend Dr. Charvat's book Small and Short-Range Radar Systems.  I haven't bought a personal copy yet, but did manage to read a few chapters of a borrowed copy.

The doppler radar I purchased.  I'm not using the head unit.

The doppler radar I purchased. I'm not using the head unit.

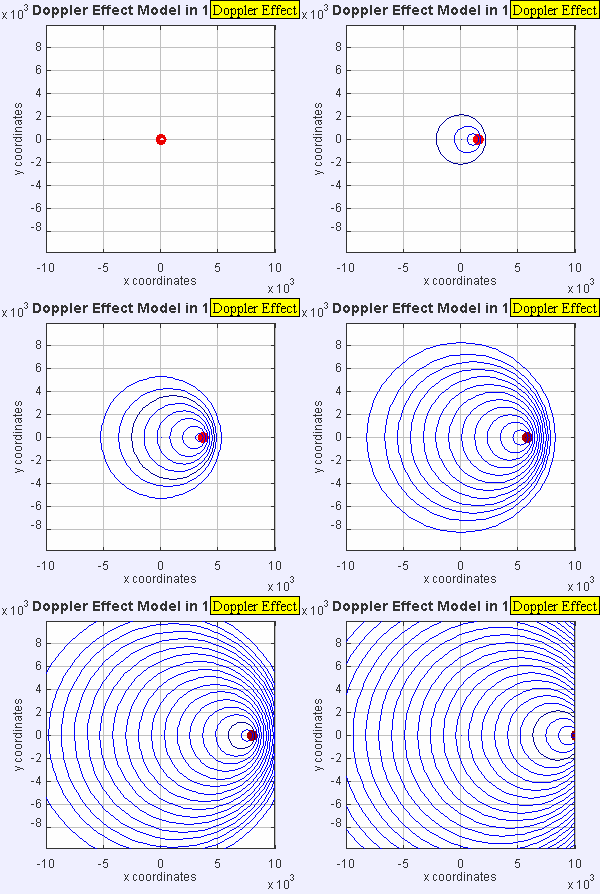
The radar I have outputs the doppler shift of a signal that is transmitted, reflected, and received.  Doppler is familiar to all of us as we hear the tone of a train horn or ambulance change as it rushes past us.  Since there is relative motion of the transmitter (horn) and receiver (your ears), there is a shift in received frequency.  Let's say that the source emits sound at a constant number of cycles per second (frequency).  Now let's suppose that the distance between you and the source begins to close quickly as you move towards each other.  The apparent frequency will go up because the source is closer to you each emitted cycle and you are closer to the source!

The doppler effect of a moving source.  Image: Wikipedia

The doppler effect of a moving source. Image: Wikipedia

This particular radar transmits a signal at a frequency of 10.25 GHz.  This outgoing signal is continually transmitted and reflected/scattered off of objects in the environment.  If the object isn't moving, the signal returns to the radar at 10.25 GHz.  If the object is moving, the signal experiences a doppler shift and the returned frequency is higher or lower than 10.25 GHz (depending on the direction of travel).  This particular radar can be easily hacked and we can record the doppler frequency out of a device called a mixer.  The way this unit is designed, we can't tell if the frequency went up or down, just how much it changed.  This means we don't know if the targets (cars) are coming or going, just how fast they are traveling.  Maybe in a future set of posts, we'll build a more complex radar system such as the MIT Cantenna Radar.  Be sure to comment if that's something you are interested in.

Since we'll be measuring speeds that are "slow" compared to the speed of light, we can ignore relativistic effects and calculate the speed of the object knowing the frequency change from the mixer, and the frequency of the radar.

Simplified doppler velocity.

I took the radar out to the street and recorded several minutes of traffic going by, including city busses.  Making a plot of the data with time increasing as you travel left to right and doppler frequency (speed) increasing bottom to top, we get what's known as a spectrogram.  Color represents the intensity of the signal at a given frequency at a certain point in time.

Speeds of several cars on my street.  1000 Hz is about 33 mph and 500 Hz is about 16 mph.

Speeds of several cars on my street. 1000 Hz is about 33 mph and 500 Hz is about 16 mph.

The red lines are strong reflectors (the cars).  Most of the vehicles slow down and turn on a side street in front of the radar.  About 30 seconds in there are three vehicles, two slow down and turn, the third again accelerates on past.  Next I'll be lining up a video of these cars passing the radar with the data and you'll be able to hear the doppler signal.  To do that I'm learning how to use a video processing package (OpenCV) with Python.

In the next few installments, we'll look at videos synced with these data, radar signatures of people running, how radar works when used from a moving car, and any other good targets that you suggest!

Gravitational Tricks: Lagrange Points and Orbiting at Puzzling Speeds

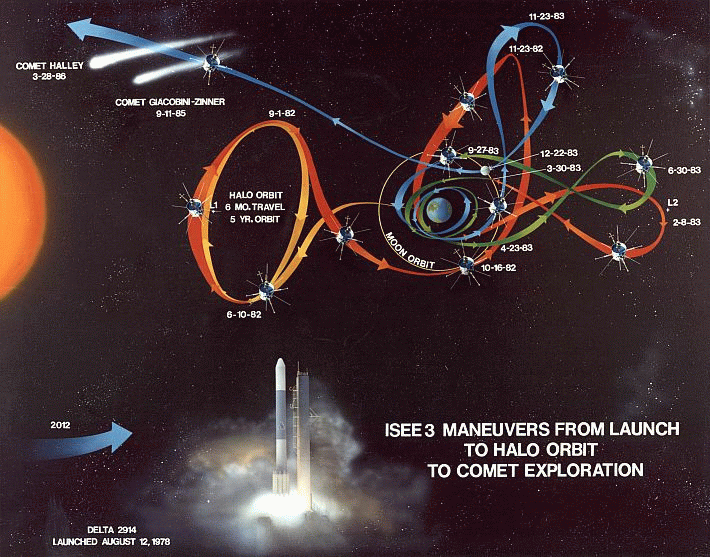
The orbital path of ISEE3 from launch to near present.

The orbital path of ISEE3 from launch to near present.

Last time I talked about a team trying to capture and reuse the ISEE3 satellite (here).  The team has received lots of telemetry lately, determined the rotation speed of the satellite, and even had an amateur radio operator receive the satellite!  While all of this is going on, they must rapidly plan out what orbit they wish to enter.  The most discussed orbit is termed ESL1, the Earth-Sun system Lagrangian point #1.  Lagrange points an interesting phenomena that I thought worth a short discussion.

When we think of orbits, traditionally we consult Kepler's laws.  These "laws" are 3 simple rules that were written down between 1609 and 1619 by Johannes Kepler.  I won't discuss them at length, because there are already many great sources to learn about Kepler's Laws and their application.  The thing we want to draw from them is that an object orbiting closer to the Sun (say Venus), will have to travel faster to satisfy the laws of nature.  In doing so it will orbit the Sun more times than the Earth will in the same amount of time.  Venus will in fact orbit the sun 1.6 times during 1 orbit of the Earth!

Let's say we place a satellite far away from the Earth, between the Earth and sun.  the satellite will orbit slightly faster than the Earth.  Over a period of time it will be on the opposite side of the Sun and we won't be able to communicate.  Eventually it will come around and lap the Earth! This isn't desirable, but we can use Lagrange points to solve this problem.

The simple laws of orbital mechanics that we have considered thus far are only valid for a simple problem with two objects (Earth and Sun or Earth and Satellite).  We have we three bodies though, the Earth, the Sun, and the satellite! Three body problems are generally sticky to solve, but we have an advantage.  The mass of a satellite is small compared to the mass of the Earth and the mass of the Sun (unless it's the Death Star).   We can ignore the small mass of the satellite as solve what is known as the restricted three body problem.  There are a few interesting points in space, the Lagrange points, at which the gravitational pull from the Sun and Earth are superimposed on each other to give the satellite the same orbital speed as the Earth!

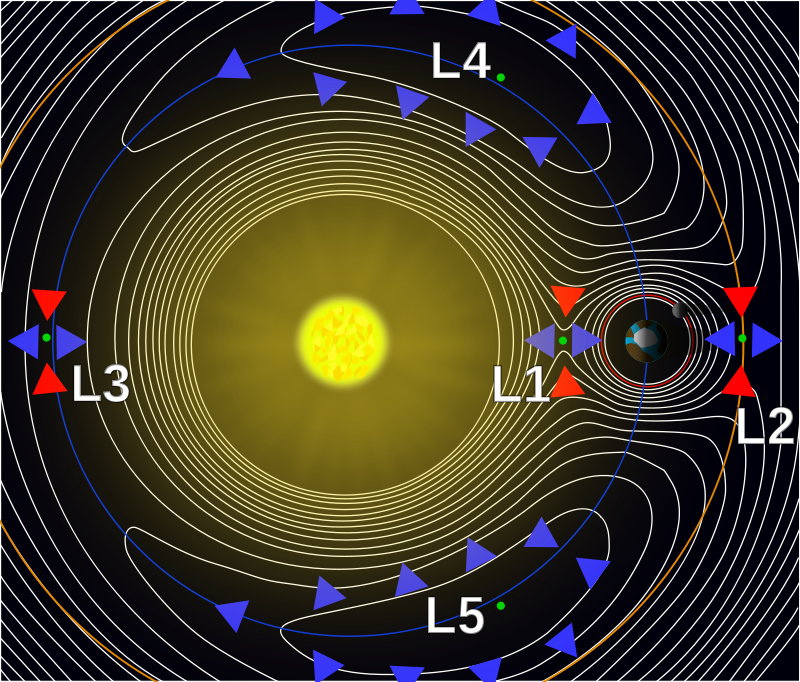
The L1 point is where ISEE3 may end up, so let's look at it.  The satellite will be above the Earth at an altitude of 1.5 million km (932,000 miles), towards the Sun.  At this point, the two body mechanics say that the satellite will orbit the Sun faster than the Earth.  Adding in the complications of the three body problem, we see that the gravitational tug of the Earth towards the Earth,  away from the Sun is canceling out just enough of the Sun's pull to make the satellite orbit at the same angular speed as the Earth.  How useful!

There are other Lagrangian points as well (L2-L5), but we won't discuss them here, other than to say that a similar explanation can be given for each.  L4 and L5 are particularly interesting because they are inherently stable and hence lots of objects get caught there.  There are objects in Earth-Sun L4/L5 and Earth-Moon L4/L5.

Lagrange Points of the Earth-Sun system (Image: Wikipedia)

Lagrange Points of the Earth-Sun system (Image: Wikipedia)

Generally satellites are placed in a small orbit around the L1 point for several reasons, including that it isn't inherently very stable.  The ISEE3 team will have to execute a rather complex series of maneuvers to get to L1 again, using the pull of the moon and making a very close pass that comes within 10's of km of the surface of the moon.  Time is of the essence, as the longer the wait the more they must change the speed of the craft (referred to as Delta V in the engineering jargon).  The ship only has about 150m/s of Delta V left before it runs out of fuel.  It'll take up to 1/3 of that to reposition the satellite, depending on how long the team must wait.

That's the quick and dirty view of Lagrangian points.  I hope this was interesting and helps you understand space exploration, or your addiction to Kerbal Space Program a little more!