Category Archives: Geophysics

Oklahoma Earthquake - I felt it!

Those of us in Oklahoma this morning had quite a nice surprise when at about 9:06 AM local time the ground shook and many experienced an earthquake centered just outside of Norman, OK.  I live on the bottom floor of a 2-story apartment building and was standing when the quake hit.  I head a loud noise like a vehicle roll over, then felt the shake.  My blinds shook and a few plates rattled together.  After immediately realizing what it was I estimated the duration as about 15 seconds, but some of that could have been remnant swinging of objects in my house.  
The initial rating was 4.5 from the USGS (United States Geological Survey), and 5.1 from the OGS (Oklahoma Geological Survey).  These estimates have been revised many times over the day, as well as the location and depth of the quake.  The estimates seem to be settling around a 4.3-4.5 magnitude with a center just west of lake Thunderbird in Norman, OK.  Below is a google map (image: J. Leeman) plotting the OGS estimate of the center with the error as the shaded region.  This uncertainty is about 1.24mi in N/S and 1.12mi in E/W.  The USGS estimate is currently much less constrained, but subject to revision.  

 The earthquake was widely felt with reports from surrounding states.  If you felt the quake you should fill out the 'Did you Feel it?' question form available on the USGS website.  Many thousand reports have been submitted so far and data gathered from over 40 stations. The next image is courtesy of Bill Wilburn, planetarium director at the Science Museum of Oklahoma.  Following that is the plot of arrival times at different stations from Steve Piltz, Tulsa NWS.

 We are also fortunate to currently have the earthscope array stationed in Oklahoma.  The next figure shows current seismic stations on the OGS page.  The yellow stations are earthscope.  Those stations appear to have been saturated, but it could be a plotting issue.  I will not know until I can get ahold of the data.

The final two images are the Carlsbad, NM East Tower seismogram and a focal mechanism plot.  The Carlsbad plot just shows that the earthquake was still very detectable in NM and makes it easy to see why it was recorded by so many stations!  The focal mechanism plot (or moment tensor solution) plots the first movement (up/down) of the ground at the stations to determine the type of earthquake/fault.  Here we see evidence for a strike-slip fault along a SW-NE or SE-NW line.  Simply put this means the ground sheared on a horizontal plane, not shearing along a slanted/vertical face as in normal or transverse faults.  
I'll post more in a future post if we learn anything else significant from/about this quake.  Maybe also some neat arrival plots and a discussion of wave types.  As a note the largest earthquake recorded that originated in Oklahoma was in the El Reno area on April 9, 1952 with a magnitude of 5.5.  The USGS has the following to describe that quake:
This earthquake caused moderate damage at El Reno, Oklahoma City, and Ponca City, including toppled chimneys and smokestacks, cracked and loosened bricks on buildings, and broken windows and dishes. One crack in the State Capitol at Oklahoma City was 15 meters long. Slight damage was reported from many other towns in Oklahoma and from some towns in Kansas and Texas. The earthquake was caused by slippage along the Nemaha fault. Felt over most of Oklahoma and in Arkansas, Iowa, Kansas, Missouri, Nebraska, and Texas.

The iPad: How it is Revolutionizing Field Work

It's not even been one year since the iPad hit the market and it is well on it's way to becoming an essential for many people around the world.  According to CNN, the iPad has the fastest adoption rate of any consumer advice (read the full article here).  I know that the iPad is difficult to put down, after standing in line all afternoon the day of the 3G release I was entertained the entire weekend.

But, what else can you do with the iPad.  We've all seen the movies, games, and flashy organization apps in the adds, but what about more difficult work?  The productivity category was initially slow to start, but now is full of options.

The numbers/pages/keynote set is $30 ($10 each) and has saved me several times.  When I needed to make a promotion slide last minute at a conference keynote came to my rescue.  I simply took images I needed from various emails and online, added some text, and in 10 minutes had a decent looking slide to submit.  Numbers has allowed me to use some handy computational workbooks in the field to make very simple models of data that is coming in.  Last, pages is very handy for quick edits on the road, or when out somewhere on campus.  There are a few glitches, but they have continually be improving, especially in the area of importing Microsoft Office documents.  So far, no track changes exists, but hopefully that will be coming soon.

For quick remote server administration I use iSSH.  This is really a fantastic app with the exception that the arrow keys/command keys on the bluetooth keyboard don't work forcing you to use onscreen keys.  This is the only limitation that prevents me from doing some full scale programming while connected to another machine back at home.

It's always important to know the weather while in the field and I use a combination of Storm Spotter and Radar Scope.  The developer of Storm Spotter is another OU meteorology student and I highly recommend his app.  Radar Scope does have a few things like spotter network, but it does not have any form of surface street map.  Storm Spotter uses google maps which makes exact location or storm chasing much easier.

Another field essential is taking notes.  There are many note apps out there and most do about the same things with different degrees of reliability.  For quick sketches I use Penultimate and for class notes I use Note Taker HD, which has a 'zoom box' that lets me write large with my stylus (the Pogo Sketch) and it is normal sized writing on the page.  Sundry notes is also around, but has not received any use by me for some time.

File sync is also an essential and can be done with Dropbox.  I already loved this service and the mobile app made life easier! Now I can save notes from the field and they instantly sync to my computer at home, my phone, and my laptop.

For field math there is Wolfram alpha (cloud service), Quick Graph, and many apps like MathTasks that do simple calculations on the fly.

Sometimes I'll use a GPS utility to mark out rough locations on a map or even the iPad ArcGIS to get an approximate distance/area.

Finally, we all need files and file editing in the field.  I use Papers to keep my scientific paper library with me at all times.  In the field or at a conference it's easy to find that paper you need a snippet from and email it directly to the interested party/conference goer.  Annotating PDF files is easy with iAnnotate PDF and viewing large files is nice with GoodReader (though Books now does this also).

While all these apps are productivity, you can bet all iPad owners have their favorite music service loaded, Netflix, and other entertainment too.  While I do love using my iPad it does have overheating issues when working out in direct sun on a hot day.  The screen is great at letting solar radiation in, and trapping the re-emitted IR inside the device,  shutting it off in ~10 minutes.  What can you do? Use a case with an open back and keep the screen shaded.  I'm not quite ready to quit carrying paper notes all together, but it's getting close and my daily/travel backpack is getting lighter every year.  Read about other great apps for large scale studies used in Pompeii here.

Images are property Apple.

Earthquakes in NW Arkansas? Yep!

Those of you who live in the northwest Arkansas area were recently 'rocked' by two earthquakes.  These were both small being under 3.0 in magnitude.  I hesitate to give out exact magnitudes because these are determined by looking at at data from several seismic stations (as is the location and depth).  You can imagine that there are relatively few earthquakes in this part of the state, so the seismic network is lacking.

So, why did these earthquakes occur? Have they happened before? Well, in short we don't know and not in recorded history.  Yes there have been movements on faults that have been felt in Benton county before, but these two events are the only earthquakes originating in the county we know of.  The first map shows recorded earthquakes since 1974 to the present (not including these two).  You will observe almost none within 200km of the county.

The initial hypothesis by a University of Arkansas professor, given the shallow depths initially calculated, was that these were the results of cave collapses.  Karst topography (what we have in NWA) consists of layers of caves carved into the subsurface.  It is not uncommon for these to collapse and the UofA professor cited the loud noises heard as support for the collapse theory.  Though the theory is nice, but my initial thoughts were 'where are the sinkholes'?  None have been discovered, not that they would be like the recent sinkhole in Guatemala (picture from Guatemalan Govt.).  I had settled on the personal hypothesis of these being slips of old faults.  There are many of these faults throughout the area, but they have been inactive for a very long time (even in geologic time).  This slipping can be stress built up over long periods of time, introduction of fluids, or loading of the land.  I even thought about a fault running under the railroad bridge in Decatur which does not break, but creeps slowly.  That bridge has been rebuilt several times due to  fault movement.

I heard that people were rushing to buy earthquake insurance and couldn't help but to (almost literally) fall out of my chair laughing.  These are not indications of further earthquakes.  We don't know what exactly is happening, but that is mostly because the area is poorly mapped and we have little geophysical data available about it.  Could more earthquakes happen? Absolutely.  Will they? We can't say.

Next we must discuss how earthquakes are rated.  We use the Richter scale, which is a logarithmic scale.  This means that each step is an order of magnitude more energy.  A 3.0 is ten times larger than a 2.0, so a 4.0 is 100 times larger than a 2.0.  News media commonly misses this and says it was 'twice' as large which is simple ignorance.  We also know it takes a 4.0+ to start breaking glass and doing serious damage.  I have only head reports of a few cracked driveways and see no reason to expect anymore.  Finally there is no 'trend' with only two data points to support earthquakes getting stronger.

Seismic Survey with iPhone Application

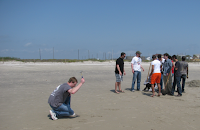
Recently I was on a sedimentary petrology field trip to Galveston, TX.  While we were standing on the beach the class dug a trench to examine some sedimentary structure and I saw an opportunity to try something very interesting...a seismic survey with an iPhone.

After talking with another geophysics major, Dustin, we got four phones and downloaded the iSeismo application.  We knew the layer we were looking for was about 1ft down and was not dipping much so we quickly set out the phones as shown below.  (Line length ~10x depth we wanted to image.)  For a seismic source we first tried a hammer but then ended up using one geologist who jumped, and we collected three shots.  All were from the same location as we were neglecting the dip so a reverse shoot was not necessary.

After we returned I quickly plotted up the data, and to my amazement saw seismic arrivals at ALL iPhones! Then I saw a problem.  The data is time stamped, but when the iPhone syncs with the network time it is not as accurate as we had hoped.  The data were seconds off when I stacked the arrivals on top of one another.  So, without an accurate way to line it up I could not solve for velocities and depths of layers, but for a proof of concept this is a step in the right direction.  This also shows just how quick and easy it is to collect seismic refraction data! With some software modifications or syncing mechanisms this could be repeated with the possibility of better results.  Overall it proves the versatility of both the method and the iPhone.  Below are plots from the iPhone accelerometer in the x,y,z directions for the first and last phones in the line. Thanks to the sedimentary petrology class, Dustin, Dr. Keranen, and Dr. Elmore.