The Vuvuzela: An Annoying Horn but a Fun Filter Project!

As we've watched the world cup matches over the past weeks everyone has been annoyed by the droning hum of the vuvuzela.  Everyone in the crowd blowing on one of these pipes makes life for our ears unpleasant.  What can you do though?

While at SciPy 2010 this week we saw a tutorial about signals with Python.  Another student and I talked about filtering out the drone and after several late nights of hacking it worked! The principle is simple, block the frequency of the horn and it's harmonics.  To do this we use a notch filter that rejects the signal from a certain frequency range.

The code (waves.py) is available and is a short script to read in, filter, display, and write out the files.  Below I show an example of the signal and power spectral density before filtering (left) and after filtering (right).  There are also links to the audio files.  I found three example files and filtered them with three different filter widths (5,10,25 Hz). All runs are available at http://leemanwebb.org/vuvu/ , but that link will disappear and I'll then post a more permanent page after some tweaking with the project.  Be sure to listen to example 3 before and after the 5Hz width filter.

Earthquakes in NW Arkansas? Yep!

Those of you who live in the northwest Arkansas area were recently 'rocked' by two earthquakes.  These were both small being under 3.0 in magnitude.  I hesitate to give out exact magnitudes because these are determined by looking at at data from several seismic stations (as is the location and depth).  You can imagine that there are relatively few earthquakes in this part of the state, so the seismic network is lacking.

So, why did these earthquakes occur? Have they happened before? Well, in short we don't know and not in recorded history.  Yes there have been movements on faults that have been felt in Benton county before, but these two events are the only earthquakes originating in the county we know of.  The first map shows recorded earthquakes since 1974 to the present (not including these two).  You will observe almost none within 200km of the county.

The initial hypothesis by a University of Arkansas professor, given the shallow depths initially calculated, was that these were the results of cave collapses.  Karst topography (what we have in NWA) consists of layers of caves carved into the subsurface.  It is not uncommon for these to collapse and the UofA professor cited the loud noises heard as support for the collapse theory.  Though the theory is nice, but my initial thoughts were 'where are the sinkholes'?  None have been discovered, not that they would be like the recent sinkhole in Guatemala (picture from Guatemalan Govt.).  I had settled on the personal hypothesis of these being slips of old faults.  There are many of these faults throughout the area, but they have been inactive for a very long time (even in geologic time).  This slipping can be stress built up over long periods of time, introduction of fluids, or loading of the land.  I even thought about a fault running under the railroad bridge in Decatur which does not break, but creeps slowly.  That bridge has been rebuilt several times due to  fault movement.

I heard that people were rushing to buy earthquake insurance and couldn't help but to (almost literally) fall out of my chair laughing.  These are not indications of further earthquakes.  We don't know what exactly is happening, but that is mostly because the area is poorly mapped and we have little geophysical data available about it.  Could more earthquakes happen? Absolutely.  Will they? We can't say.

Next we must discuss how earthquakes are rated.  We use the Richter scale, which is a logarithmic scale.  This means that each step is an order of magnitude more energy.  A 3.0 is ten times larger than a 2.0, so a 4.0 is 100 times larger than a 2.0.  News media commonly misses this and says it was 'twice' as large which is simple ignorance.  We also know it takes a 4.0+ to start breaking glass and doing serious damage.  I have only head reports of a few cracked driveways and see no reason to expect anymore.  Finally there is no 'trend' with only two data points to support earthquakes getting stronger.

Physics of a Beer Head- It's All About Tension Gradients

Who doesn't like a good beer? Geologists/geophysicists are always appreciate a nice cold glass of their favorite beverage poured by a skilled bartender that produces a nice frothy head that persists for the entire experience.  The question is why does the head not disappear quickly like soap bubbles?  Douglas Durian and Srinivasa Raghavan wrote up a 'quick study' in the May 2010 issue of Physics Today.  This article is based on that article with some additional information.  Durian and Raghavan also discuss soap bubbles and present high magnification photos of foam structures, but those will be ignored here as their method of persistence is quite different than that of beer foam.

When beer is produced proteins are present in the mix.  If you enjoy the cloudy wheat beers you are seeing proteins precipitate out! Actually something called the isoelectric point determines what happens to the proteins.  If the pH of the beer is too close to the IEP the proteins precipitate out.  The further the pH gets from the IEP the more soluble the proteins are.  Why does it matter?

Remember from high school biology that proteins have hydrophilic and hydrophobic parts to them.  This means that one part of the protein 'likes' water and will immerse itself, but the other end does not like water and tries to stay away from it.  When we look at a foam magnified there are small fluid sections in-between the air bubbles.  Proteins orient themselves in the bubble walls.  Say that a bubble begins to stretch thin and is in danger of bursting.  The stretching of the wall means there are fewer proteins in the middle where the wall is thin and more on the edges.  Proteins can change the surface tension and this gradient is surface tension causes liquid to flow to the thin section, restoring the stability of the bubble.  This effect is known as the Gibbs-Marangoni effect, and is in fact a strong example of the phenomena.

This Gibbs-Marangoni effect was in fact first observed in glasses of wine (pictured) and discussed by Lord Kelvin's brother James back in the mid 1800's.  Carlo Marangoni studied the idea for this dissertation and the solutions of the problem were formalized by Williard Gibbs.  (Yep, that the same guy that independently developed vector analysis, Gibbs free energy, etc)

So is there anything other than pH that can change the persistence of head? Absolutely! Due to gravity the fluid drains to the bottom over time which destabilizes the foam.  There isn't much to do about that, but we can combat Ostwald ripening.  Basically this mean that gas diffuses from smaller bubbles to larger ones.  Laplace described this knowing that the large bubbles have a smaller curvature and therefore lower pressure than small bubbles.  According to the article brewers can add about 20ppm of nitrogen to the beer to slow this process.

The items discussed in this article apply across many scientific items.  There is an everyday example that scientists would call Benard-Marangoni convection, but you probably call it boiling water.

Once again these pictures are from the interweb and not my property.  

Deepwater Horizon and Hydrates

By now all are well aware of the well blowout in the gulf at the 'Deepwater Horizon' site.  Thus far several attempts have been made to curb the flow of crude into the gulf, but none have worked.  One of the first attempts was to use a dome structure to cover the rupture and direct the oil to a waiting barge.  This dome quickly filled with gas hydrate and was made much more buoyant by the hydrate (density of hydrate is less than that of water, especially sea water).  Attached is a picture of the 4-story dome courtesy telegraph.co.uk.  I feel it is important to point out a few things about hydrate the media has either left out or stated incorrectly.

First, what is gas hydrate? The most common buzz word I've seen is 'crystalline gas' or 'solid gas'.  These are contradictions.  We know there are three basic states of matter: solids, liquids, and gasses. (There are also plasmas, Bose-Einstein condensates, string-net liquids, and so on.) You can see that a 'solid gas' is simply incorrect! Gas hydrates are cages of water molecules with a guest molecule of gas trapped inside.  There are different types of cages for different sizes of guest molecules.  Though the material can look like ice it is fundamentally different.

Under the ocean there is quite a lot of methane hydrate.  We have known about hydrate for some time and it's important for past climate change, possible energy production, and as a potential hazard for sea slopes and drilling operations.  Dr. Robert Bea of UC Berkeley has suggested that Halliburton cementing the well only 20 hours before the explosion on the rig is important.  When cement is hardening is releases heat. This heat of crystallization could have heated the hydrate up.  The hydrate weakened the concrete and as it was melting released its gas, causing a surge of pressure to the rig.

Hydrates have been a problem to the industry before, clogging pipelines and apparatus.  Hydrates only form under certain pressure and temperature conditions, so the areas can simply be kept out of P-T ranges where hydrate would be stable.  This is easier said than done, and sometimes inhibitors are injected.  Chemicals such as methanol decrease the stability of hydrate.

So what is the plan now? Currently an attempt to place a new, capped section of pipe on is underway.  The difficulty with any plugging operation is the pressure at which the fluid is shooting out.  If this fails a smaller dome has been built in hopes that it will remain warmer and hydrate will not be stable. There are also measures in place to inject hydrate inhibitors, though this could have unknown environmental impacts.  Currently oil continues to gush out at about 210, 000 gallons/day.  Below is an image from NOAA (May 11) showing the spread of oil then some links to follow.  Numerical modeling of the spread has done surprisingly well as has put rapid mathematical modeling in the spotlight also.

Afterthought:
I received a question about why the flow rate estimates were so widely varied.  In the video of the flow you can see both oil and gas phases coming out of the pipe. If it were just one phase, knowing the scale and frame rate of the pipe would be sufficient to get an accurate estimate. It could be that as oil is releasing pressure more hydrate is dissociating and causing the bursts of mixed gas making the flow hard to figure.


LINKS:
Video of Oil Leak
NOAA Page on the Accident (Updated Daily)
LA Times Article on Dr.Bea's Idea

Chernobyl

Chernobyl nuclear unit number four blew up 24 years ago today.  Officially the disaster killed about 31 people, but we all know that the death toll is much higher.  Today I'd like to briefly discuss the very basic premise of the accident, what actions the Soviets took, and what we can learn from this accident.
The accident occurred during a test that really should have already been preformed.  In the event of the plant losing external power it would take backup generators about a minute to get up to speed and start coolant circulating again.  This was dangerous and the engineers believed that they could use the inertia of the already spinning turbines to generate enough power to run the plant for about 45 seconds.  The details are well documented, but in the end the power spiked, control rods jammed, and the reactor went out of control.  
These RMBK reactors are inherently unstable at low power levels, and the operators did not understand reactor physics well enough to understand what the instrumentation was telling them.  The control rods only reached just over 2m into the reactor before they seized.  The reactor was 7m deep.  
There were two explosions, a steam explosion, followed closely by an explosion from nuclear excursion.  All of this is well explained elsewhere, but at the time the causes were unclear.  In fact, several of the operators thought a tank of hydrogen had exploded, even though they could see chunks of graphite on the ground outside.  
Almost immediately radioactive dust was showering from vents in the plant and many crew received lethal doses and a 'nuclear tan' very quickly.  They were simply replaced with workers from the other reactors.  Some were sent i to lower the control rods manually, only to find that none of that existed anymore.  They instead saw fire hoses dangling unmanned, the firefighters had already fallen after standing right above the core of the unit.   
The government lied in many cases to the workers and public.  One community was given masks and iodine but didn't distribute them to prevent a panic.  The supplies went to waste.  After that liquidation crews were brought in.  The robots were unreliable and failed quickly.  The government sent soldiers onto the reactor with little protection, they were called 'bio-robots'.  The human side of the story is excellently captured in the book Voices from Chernobyl: The Oral History of a Nuclear Disaster, available here.  The book is also available in many libraries and I highly recommend it, though some of the stories are graphic. Pictured above is the reactor after the explosion, it was enclosed in a hastily built sarcophagus, which is now unstable and must be rebuilt.  The condition of the tunnels dug under the plant by 'bio-robots' is also unknown.  The next picture is of a robot bulldozer being tested.  These were used to bury the cities, but failed to work well and were often replaced by humans.  Some photos from the zone also show spots, recording the massive radiation release.  
So what can be learned from this accident? The obvious results are more training, containment domes, and better reactor design.  The other lessons are about government and public education.  Let's focus on the less controversial public education issue.  Many people refused to leave the zone because nothing was wrong.  They couldn't understand the power of the atoms, the sky was blue, and there was a fire in the distance; why should it mean anything to them? This is why the public needs a basic science education, but now I fear the US has gone too far and induced a fear of the atom.  Nuclear power is a technology to be respected, not feared.  With proper construction, safety measures, and current technology there is no reason to fear an accident in the US.  Waste products are another issue entirely.  
In closing I encourage you to do some research and learn about this disaster.  Also remember all the brave 'bio-robots' that were sent to the station to die while attempting to contain the situation.  You can watch this short video for some photographs from the area.  A documentary about the accident is also available on youtube. 
(None of the photographs are mine, all sourced from Wikipedia)

Wisconsin Meteor - A Great Time to Play with Radar Data

As I'm sure you've heard by now last week, what is believed to be a meteor, passed into our atmosphere and exploded over Wisconsin.  The light was seen as far away at St.Louis, MO and was captured on a camera at the University of Wisconsin-Madison.  The video frames have been played on most news networks and are available everywhere online.
As you can imagine the 911 call center (actually 911 call centers over 6 states) was/were flooded with reports of the light, the sonic boom, and other observations.  The NWS also noticed a new trail appear on the radar.  I downloaded the level 2 data and plotted it up.  First we'll look at the reflection.

You can see the trail in the SW corner of Iowa county.  (KDVN radar)  Next is just a blow up of this image.  The meteor path was from west to east.  According to NASA scientists the meteorite was likely not from the current Gamma Virginids meteor shower, but a rock from the asteroid belt.
Next it would be interesting to look at this trail in 3D.  Using level II radar data this is possible.  The next images show this from several different angles.   The directions are labeled so it's easy to get bearings on which way you're looking.  If you notice the trail is sloping down slightly towards the SE.

The average hight for the event was right around 24,000-25,000 ft.  Looking at the plot you can see how small the plot was and how large the strongest reflector in the center is! A few back of the envelope calculations can be done using basic trig to determine some interesting things.  You can try this yourself.  I've posted a link to the radar data at the bottom and a link to a website where you can download a 21 day trail of GR2Analyst.  Just open the data and start slicing it!

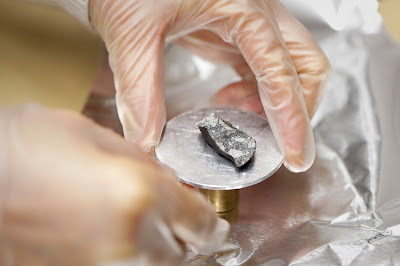
Finally a sample of the meteorite has been recovered at is being examined currently.  There should be many other samples in the area also and hunters are already out looking for them.  With all this in mind you should remember it's not that uncommon for meteorites to enter the atmosphere.  Washing machine size chunks of rock are not abnormal and they burn up in the atmosphere.  If any material makes it to the ground it's probably never seen.  (Since most of the Earth is covered in water most probably hit there.)
 
Below: Scientists prepare a sample of the meteorite for a test


LINKS:
Gibson Ridge Software
Data for This Radar Scan

Highway to Hail

On the evening of April 6th, 2010 we had a nice little storm system move through central Oklahoma.  Short term models earlier in the day were breaking out a supercell around the OKC area about sunset and though those models had done exceptionally well with events in the previous days they missed the storm type here.

On the right is a radar image from that evening where the boundary is visible.  About this time the storm was moving over Norman producing moderately high winds, heavy rain, and small hail.

Above is an image I took right before the precipitation hit Norman, as the hail began to fall I noticed that it was a prime example of what we had already been discussing in cloud physics.

Hail grows around a hail embryo.  Commonly this is graupel or large drops, but sometimes insects have become entrained in the updraft and become the center of a hailstone!  Hail can undergo 'dry' and 'wet' growth implying things about where it is in the cloud at the time.  Without going into too much detail on this we can say that dry growth produces much less dense hail (more air and cloudy looking) while wet growth produces clear layers of almost solid ice.  Switching methods of growth produces the 'onion' like texture on the inside of a hailstone that so many falsely attribute to multiple trips through the updraft.  The trajectory of most hailstones (we think) is remarkably flat!  It is rare for them to recycle through the storm and when they do its not multiple trips.

The shape of the hailstone also tells us about its environment.  There are many excellent papers out on the topic.  After looking at the image above of some hailstones collected from this storm I encourage you to read more on the topic and next time it hails be sure to pick some up and think about the environment that could have formed it.  Could this stone have recycled? Could it have been warmer than it's environment (think latent heating)? Did it melt significantly on the way down?

Seismic Survey with iPhone Application

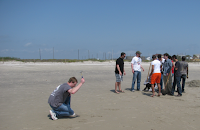
Recently I was on a sedimentary petrology field trip to Galveston, TX.  While we were standing on the beach the class dug a trench to examine some sedimentary structure and I saw an opportunity to try something very interesting...a seismic survey with an iPhone.

After talking with another geophysics major, Dustin, we got four phones and downloaded the iSeismo application.  We knew the layer we were looking for was about 1ft down and was not dipping much so we quickly set out the phones as shown below.  (Line length ~10x depth we wanted to image.)  For a seismic source we first tried a hammer but then ended up using one geologist who jumped, and we collected three shots.  All were from the same location as we were neglecting the dip so a reverse shoot was not necessary.

After we returned I quickly plotted up the data, and to my amazement saw seismic arrivals at ALL iPhones! Then I saw a problem.  The data is time stamped, but when the iPhone syncs with the network time it is not as accurate as we had hoped.  The data were seconds off when I stacked the arrivals on top of one another.  So, without an accurate way to line it up I could not solve for velocities and depths of layers, but for a proof of concept this is a step in the right direction.  This also shows just how quick and easy it is to collect seismic refraction data! With some software modifications or syncing mechanisms this could be repeated with the possibility of better results.  Overall it proves the versatility of both the method and the iPhone.  Below are plots from the iPhone accelerometer in the x,y,z directions for the first and last phones in the line. Thanks to the sedimentary petrology class, Dustin, Dr. Keranen, and Dr. Elmore.

Constellation Cut?

With the release of the proposed budget science education saw a nice boost in funding, but science programs saw cuts. NASA was one of the most hurt agencies. This was simply upsetting as we know how weak we are as a nation when it comes to science. (I've often been scared when visiting a medical doctors office and hearing the doctors confession of barely making it through calculus one.)

Constellation was supposed to get space exploration back on our minds and provide more technological advancements. Many of the modern items we enjoy have their roots in the space program. Our technology has also advanced greatly since the 60's and 70's. The computer on the Apollo missions ran at a whole 2MHz and would shudder if it met a modern graphing calculator, or my iPhone which is over 300 times more powerful! (And about 69.9 pounds less in weight)
Please read, modify, and send the letter below to your representative! Unless you are also a student on a PhD track you might want to change that bit, but otherwise you could use it pretty much unmodified if you wish.

Misconceptions in Science


After some prompting I began to think about things the general public thinks about when 'science' comes up. Commonly this seems to instantly conjure up images of labs, people in white coats, and one adjective...Hard. The links below are two articles I was required to write, but then really enjoyed them and will probably continue to casually investigate the common stigmas embedded in science.

Even just last night I was sharing the joys of astronomy with two of my smaller elementary school cousins and found out the facts I was sharing were not only new to the kids, but many of the adults present also. This has sparked another thought, how often do we remember that the general population has not had much more than 1000 level science training, and were probably not even that interested then? Could it be we are using the wrong approach? Are we not showing how science applies to their lives?
Papers: