Category Archives: Education Opportunity

Surviving a Crash - The Black Box Then and Now

After an airliner crashes there is a search for survivors (of which you have about a 1:100 chance of being among) and the search for the ever important in infamous 'black box'.  The black box records critical flight data that helps accident investigators determine what caused the crash and if there are problems with the airplane model that need to be corrected.  This was the case of the stripping jack screw in the tail of the MD-83 that caused the crash of Alaska Air 261 in 2000.  The black box has undergone many transformations over the years, but it has always had to be a durable machine that can preserve data through  the dramatic forces of a crash, water immersion, and inferno like fires of jet fuel and airframe materials.

Some of the earliest flight data recorders used photographic film rolls that had lines exposed on them by light reflected of sets of mirrors.  The mirrors were deflected different amounts according to aircraft parameters resulting in a 'strip chart' on the film.  This was easy to develop, but was only a one time use as the film had to be replaced after exposure.  The first data recorders just recorded a few simple channels of data and were common only on test flights due to their cost.

Later black boxes, like the one featured in the video below, used metal strips with the data scratched into the metal by a sharp stylus.  These records survived the fire and shock much better than film, but were still single use.  Keep in mind this is still all done with 'old fashioned' technology as there was no solid state memory in these days.  The next step was voice recording.  What were the pilots talking about before the crash?

Video on Analog Recorder

In the 1950's spy gadgets were the rage in the intelligence community and they required some of the same properties that aircraft flight data recorder designers desired: compact, durable, simple.  Wire recording was the answer.  Magnetically encode data on a spool of wire and use a ground based playback/decoding system.  It wasn't long before both the flight data and the cockpit voice data were being recorded on the same wire reel.  This reel could be erased and used again.

Modern flight data recorders and required to store at least 88 parameters by law (US) and they are solid state.  There are a few cases where the data has been unreadable to due destruction of the unit, but new units that propel themselves from the crash may solve that problem.  The new recorders also transmit a beacon signal making them easier to find for about a month.  Some of the smart units are even capable of observing when inputs are changing rapidly and collecting data more often as this is when things are likely to go wrong.

The purpose of this trip through the history of the flight data recorder was not only to show the evolution of a remarkable and very useful device, but to show how engineering problems can be solved without a microchip.  Are the recorders now better than those of the film days? Of course, but it required some out of the box thinking to build the mechanical recorders of the early days of aviation.

Progress on Ultrasonic Mapper

My last post was on the idea, brainstorming, and basic setup of a ultrasonic mapper intended for cave passages.  This post is an update on the prototype that is running now and will hopefully be tested relatively soon when a bit more hardware mounting has been done.

Attached are several photos of the current state of the system, a simple plexiglass mount was constructed to attach the servo and sounder to an old tripod.  This mount will be stronger on a final version and detachable from the tripod.  This is just a proof of concept prototype.

Since servos only rotate 180 degrees the final model will use two sounders opposed to each other to collect a full 360 degree profile.  This means a similar connector (5-pin mic style) will be used with two units mounted in one case, or it may be possible to go with a more sophisticated sounder.  Keep in mind that the point of the whole project is to construct the profiler on a student shoestring budget.  

Below is an 'image' collected.  The vertical line on the right side is the back of an office chair and the feature on the left is the back and seat of a couch.  This was scanned rather slowly over about 40 seconds with many pings averaged out to reduce error.

Since I collected these images I have implemented an intelligent algorithm that makes a quick three ping assessment and based upon the results it will move to the next position or ping up to an additional fifty times to reduce the uncertainty.

The next step will be to make an intelligent scanning rate method that will scan with lower resolution over smooth surfaces and slow down over surface features.  Hopefully the whole scan can be a 15-30 second ordeal allowing quick mapping of passages.

Holiday Engineering Project - Beginning an Ultrasonic Mapper

Over the Thanksgiving break I decided to tackle a small engineering project that has been on my mind for the past month or so.  The basic idea was inspired by learning about Bill Stone's underwater cave mapping system (Stone Aerospace).   It is a relatively complex system constructed by more funding that a college student has at his/her disposal.  Being a caver myself I decided to build a much simpler and cheaper version for both above and below ground mapping.

Since this project is not too large it should be easily constructed over a few weekend hacking sessions, and over the last day the first steps have taken place. The machine uses and Arduino Uno as an interface between a computer and the real world.  While it is true that it would be possible to make a self-contained unit that would store data on a flash drive and maybe even display initial results on some simple display, I opted out of that option for cost and control concerns.  It should be simple to make a simple GUI that allows a netbook to control the setup very nicely and process the data real time.  
Above the basic layout from my notebook is shown.  The ultrasonic ranger (an SRF05) is attached to a rotating mount to sweep through the space around it.  In the initial prototype stages I'm using a simple RC servo since I have it on hand.  Servos only sweep close to 180 degrees to avoid bending control links on models.  While continuous rotation servos are made, they have no position feedback which does not allow accurate positioning of the servo.  It would be possible to use multiple rangers so 180 degrees is enough rotation, but it will be more economical to switch to a slow geared motor with an encoder (maybe a quadrature rotary encoder?) to detect the position as the unit slowly sweeps the space around it.  
Also pictured is the Arduino board and the range finder mounted in a custom case built this afternoon (the window added allows the ping LED to be seen inside the case to confirm the link).  Modification of the PCB and mounting hardware was required.  CAT5e cable along with 4-pin radio mic connectors are used for the power, ground, echo, and trigger pins.  The ranger has a built in PIC controller to pulse the output with a length of the echo time.  The unit seems to range effectively up to about 17 feet.  
While I don't know the accuracy at large distances, or the spread of the 'beam' with the increasing path length, some simple tests should help sort that out.  Currently I've written the interface on the Arduino in C, which will listen for commands over the USB connection.  It this executes those commands (such as move servo, get distance, etc) and returns the appropriate values if necessary.  The communication is asynchronous and not really 'handshaking', but using startbits there is some error checking involved.  
The control from the computer is in the form of a python script that takes easy user input and converts it to the short serial commands in the home-made quick transfer format in the Arduino C code.  Currently it moves the servo and returns distances in cm.  At distances less than 30 cm results seem to be accurate to about 2-5mm.  

The next steps include mounting everything up to get 180 degree scans produced, assessing the accuracy and noise limits of the unit.  I also plan to implement a scanning algorithm that scans more quickly over plan surfaces and slows down over more interesting surfaces.  It will also throw out false returns, which could be due to a range folding issue in large spaces (I have not done anything past back of the envelope on if the signal is strong enough to cause a range folding issue).  A leveling mechanism (manual or automatic) would be nice for field applications.  If this were to be used in mapping a tunnel some kind of simple inertial navigation system with a combination of gyros and accelerometers could be used.  These are all for future development and future posts.  
Have a happy and safe Thanksgiving! 

The Vuvuzela: An Annoying Horn but a Fun Filter Project!

As we've watched the world cup matches over the past weeks everyone has been annoyed by the droning hum of the vuvuzela.  Everyone in the crowd blowing on one of these pipes makes life for our ears unpleasant.  What can you do though?

While at SciPy 2010 this week we saw a tutorial about signals with Python.  Another student and I talked about filtering out the drone and after several late nights of hacking it worked! The principle is simple, block the frequency of the horn and it's harmonics.  To do this we use a notch filter that rejects the signal from a certain frequency range.

The code (waves.py) is available and is a short script to read in, filter, display, and write out the files.  Below I show an example of the signal and power spectral density before filtering (left) and after filtering (right).  There are also links to the audio files.  I found three example files and filtered them with three different filter widths (5,10,25 Hz). All runs are available at http://leemanwebb.org/vuvu/ , but that link will disappear and I'll then post a more permanent page after some tweaking with the project.  Be sure to listen to example 3 before and after the 5Hz width filter.

Seismic Survey with iPhone Application

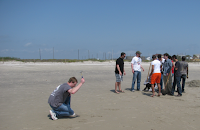
Recently I was on a sedimentary petrology field trip to Galveston, TX.  While we were standing on the beach the class dug a trench to examine some sedimentary structure and I saw an opportunity to try something very interesting...a seismic survey with an iPhone.

After talking with another geophysics major, Dustin, we got four phones and downloaded the iSeismo application.  We knew the layer we were looking for was about 1ft down and was not dipping much so we quickly set out the phones as shown below.  (Line length ~10x depth we wanted to image.)  For a seismic source we first tried a hammer but then ended up using one geologist who jumped, and we collected three shots.  All were from the same location as we were neglecting the dip so a reverse shoot was not necessary.

After we returned I quickly plotted up the data, and to my amazement saw seismic arrivals at ALL iPhones! Then I saw a problem.  The data is time stamped, but when the iPhone syncs with the network time it is not as accurate as we had hoped.  The data were seconds off when I stacked the arrivals on top of one another.  So, without an accurate way to line it up I could not solve for velocities and depths of layers, but for a proof of concept this is a step in the right direction.  This also shows just how quick and easy it is to collect seismic refraction data! With some software modifications or syncing mechanisms this could be repeated with the possibility of better results.  Overall it proves the versatility of both the method and the iPhone.  Below are plots from the iPhone accelerometer in the x,y,z directions for the first and last phones in the line. Thanks to the sedimentary petrology class, Dustin, Dr. Keranen, and Dr. Elmore.